2889
Diagnosis value of Lumbar Spine using synthetic MRI: a comparative study with conventional MRI1Radiology Department of China Medical University First Hospital, Shenyang, China, 2GE Healthcare, MR Application China, Shenyang, China, 3GE Healthcare, MR Application China, Beijing, China
Synopsis
Synthetic MRI is an emerging technique that can produce multiple morphologic contrasts from a single sequence, as well as quantitative T1, T2 and proton density maps. It has been successfully used in the brain, but its role is less well established for MRI of the spine. We aimed to assess the effectiveness and feasibility of synthetic MRI of the lumbar spine by comparing the image quality and diagnostic ability.
Introduction
MRI is being widely used for diagnosis of lumbar spine related diseases, and there are several practical requirements for imaging: high SNR, immunity to pulsation motion and multiple image contrasts. For the last requirement, T1, T2 and T2 fat suppressed images are commonly used to detect spinal abnormalities and lesions. Synthetic MRI is a novel imaging technique that may offer simultaneously acquired multiple relaxation weighted images as well as quantitative relaxation maps 1,2,3,4 . it is hypothesized that synthetic MR may be a potential approach for lumbar spine imaging, as in addition to conventional contrasts, it offers additional clinical information. In this work, the diagnostic value of synthetic MR is investigated using conventional multiple contrast MRI as a reference on patients.Methods
A total of 84 patients were enrolled in this study, local ethical approval and consent forms were obtained. The patients were diagnosed by doctor as trauma (6), degenerative(63), tumor(12) or other lumbar diseases(3). All patients underwent MR exams on a 3.0T whole body scanner (Signa Pioneer, GE, WI), the MR exams consisted of conventional MR sequences and synthetic MRI. The imaging parameters for synthetic MRI were as follows: (Sagittal orientation, 20 slices, slice gap = 1, field-of-view (FOV) = 36× 28 cm, acquisitionmatrix = 320 ×256, slice thickness = 3 mm. ). Matching spatial resolution were used in conventional MRI. . The scan time of the conventional MRI was about 6:30 min and that of the synthetic MR sequence was 6:40 min. Scores were given by the blinded reviewers based on the following aspects of T1, T2 and STIR images obtained by conventional and synthetic MRI: 1) SNR, 2) motion artifacts, 3) diagnostic quality. The Wilcoxon test or the paired-sample t test was used to compare the scores between conventional and synthetic MR and P<0.05 was considered significant 3,5.Results
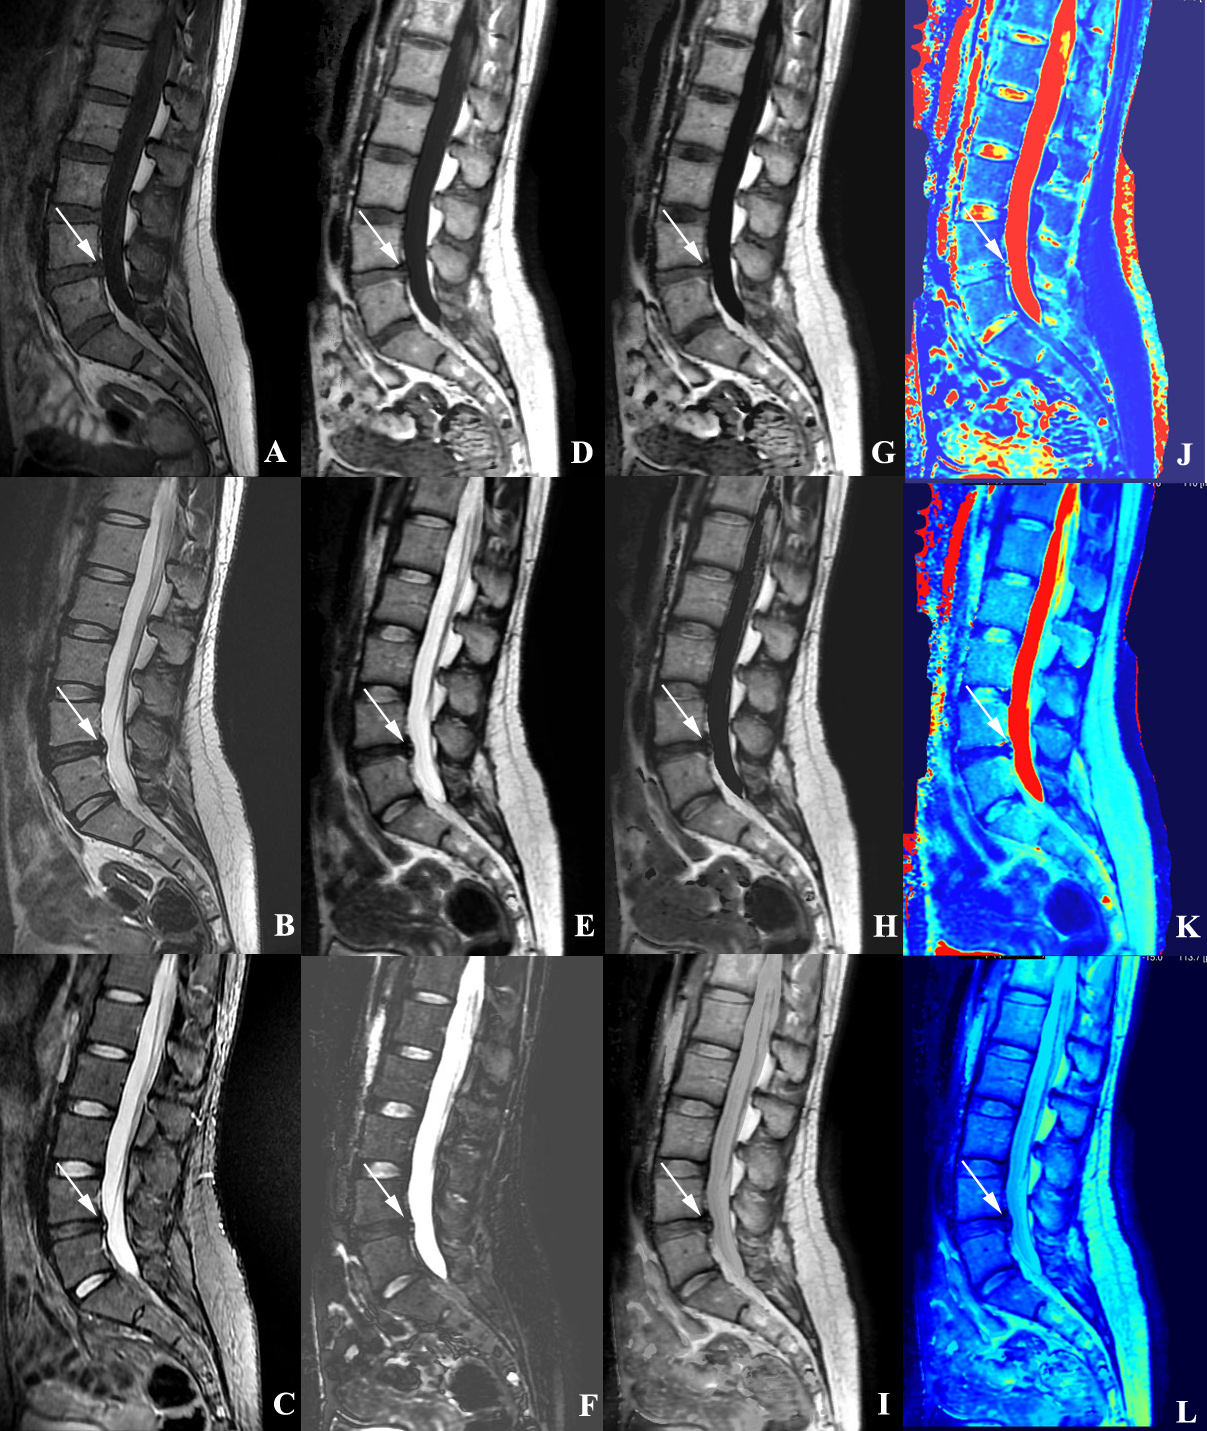
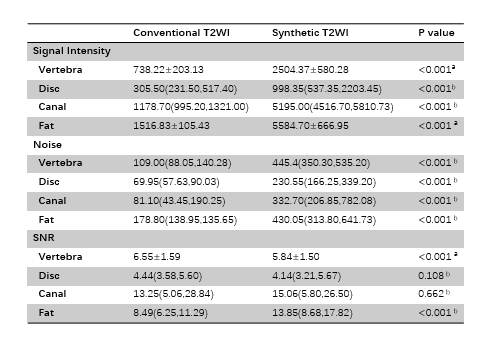
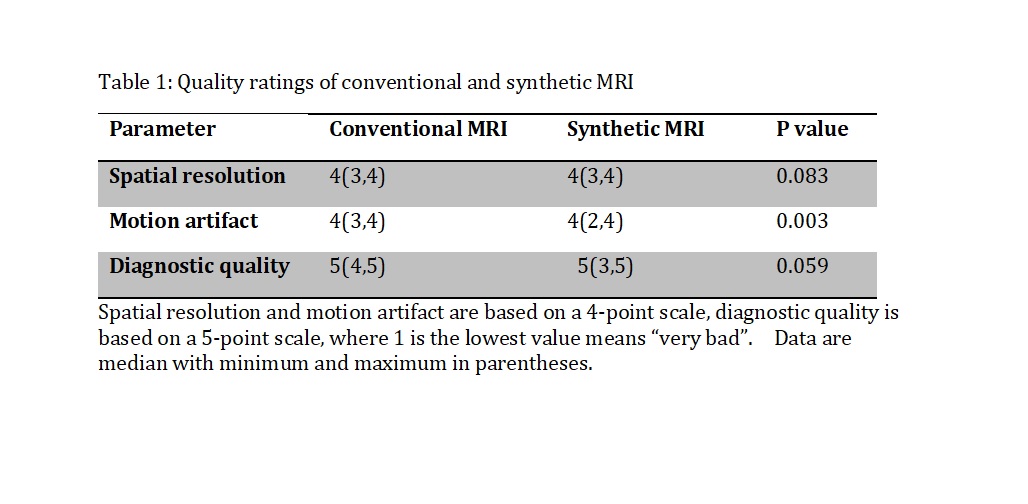
Figure 1 shows representative images of conventional and synthetic MRI of a patient with disc degeneration. For 1) SNR: as summarized in Table 1, no difference in the SNR was observed between conventional and synthetic MR in the disc(p=0.108) and the canal(p=0.662); whereas higher score for SNR of the vertebra was obtained for the conventional MRI (p<0.001). For 2) motion, the scores of conventional MRI were lower than those of synthetic MRI (p<0.005). For 3) diagnostic quality, no difference was found between conventional and synthetic MRI (p=0.059).Discussion
The diagnosis of lumbar spinal diseases requires multiple image contrasts, and synthetic MRI present a potential alternative to the conventional MRI. In this work, by keeping similar scan parameters and scan time, the diagnostic value of synthetic MRI was investigated as compared to conventional MRI. Based on scores received on patient images, no difference in the diagnostic quality was observed between conventional and synthetic MRI, however lower SNR and stronger pulsation motion artifacts were observed in synthetic MRI. This might be attributed to the acquisition nature of synthetic MRI. There might be additional clinical value in other image contrasts and the quantitative relaxation maps for spinal disease diagnosis that to be further explored with larger patient cohort.Conclusion
Image contrasts obtained with synthetic MRI offer similar diagnostic value as conventional MRI, while the diagnostic value of additional contrasts need to be further investigated.Acknowledgements
No acknowledgement found.References
1. Blystad I1,2, Warntjes JBM2,3, Smedby Ö1,2,4, Lundberg P2,5, Larsson EM2,6, Tisell A2,5. Quantitative MRI for analysis of peritumoral edema in malignant gliomas. PLoS One. 2017 May 23;12(5):e0177135.
2. Hagiwara A1, Warntjes M, Hori M, Andica C, Nakazawa M, Kumamaru KK, Abe O, Aoki S. SyMRI of the Brain: Rapid Quantification of Relaxation Rates and Proton Density, With Synthetic MRI, Automatic Brain Segmentation, and Myelin Measurement. Invest Radiol. 2017 Oct;52(10):647-657.
3. Kumar NM1, Fritz B1, Stern SE1, Warntjes JBM1, Lisa Chuah YM1, Fritz J1. Synthetic MRI of the Knee: Phantom Validation and Comparison with Conventional MRI. Radiology. 2018 Nov;289(2):465-477
4. Vargas MI1, Drake-Pérez M2, Delattre BMA3, Boto J4, Lovblad KO4, Boudabous S3. Feasibility of a Synthetic MR Imaging Sequence for Spine Imaging. AJNR Am J Neuroradiol. 2018 Sep;39(9):1756-1763.
5. Cho HH1, Kim IO2, Cheon JE3, Choi YH4, Lee SM1, Kim WS3. Changes in brain magnetic resonance imaging patterns for preterm infants after introduction of a magnetic resonance-compatible incubator coil system: 5-year experience at a single institution. Eur J Radiol. 2016 Sep;85(9):1564-8.
Figures