2885
Investigation of DTI parameters in the corticospinal tract: from cervical cord to motor cortex1Queen Square MS Centre, Department of Neuroinflammation, UCL Queen Square Institute of Neurology, University College London, London, United Kingdom, 2Institute of Medical Science, University of Toronto, Toronto, ON, Canada, 3NeuroPoly Lab, Institute of Biomedical Engineering, Polytechnique Montreal, Montreal, QC, Canada, 4Functional Neuroimaging Unit, CRIUGM, Université de Montréal, Montreal, QC, Canada, 5Spinal Cord Injury Center Balgrist, University of Zurich, Zurich, Switzerland, 6Krembil Research Institute (Krembil), University Health Network, Toronto, ON, Canada, 7Department of Neurophysics, Wellcome Trust Centre for Neuroimaging, UCL Queen Square Institute of Neurology, University College London, London, United Kingdom, 8Max Planck Institute for Human Cognitive and Brain Sciences, Leipzig, Germany, 9Department of Brain and Behavioural Sciences, University of Pavia, Pavia, Italy, 10Brain MRI 3T Centre, IRCCS Mondino Foundation, Pavia, Italy
Synopsis
We have explored diffusion tensor imaging (DTI) metrics along the corticospinal tract (CST) from the cervical cord to the motor cortex, measured using separate whole brain and cervical cord DTI protocols in healthy subjects at two different sites. We have also explored sensitivity to disease in patients with cervical spondylotic myelopathy (CSM), and spinal cord injury (SCI). Several studies have looked either at brain or cervical cord separately, which makes it difficult to learn about possible interactions between brain and cord. Here, we combine brain and cord measurements and examine how the CST is affected in CSM and SCI.
Introduction
The corticospinal tract (CST) is a white matter (WM) motor pathway starting at the cerebral cortex that terminates on lower motor neurons and interneurons in the spinal cord, controlling movements of the limbs and trunk1.
There are two divisions of the CST; lateral, which crosses the midline in the cord, and controls the limbs and digits, and ventral, which controls the trunk muscles, and stays on the same side of the body.
Quantitative MRI metrics in the CST are expected to be affected by cord pathology, including multiple sclerosis, amyotrophic lateral sclerosis, cervical spondylotic myelopathy (CSM), and spinal cord injury (SCI)2.
Diffusion Tensor Imaging (DTI) provides several indices thought to be sensitive to tissue microstructural abnormalities. These are the fractional anisotropy (FA), mean diffusivity (MD), and axial and radial diffusivities (AD and RD) and can be related to specific aspects of tissue damage/repair, e.g. demyelination and axonal damage. Several studies have examined either the brain or the cord CST separately. Here we characterise brain and cord measurements obtained from separate cord and brain DTI protocols, but during the same scanning session, in healthy controls (HC) and CSM/SCI patients, acquired as part of a multi-centre study involving two different clinical sites.
Methods
MRI Acquisition:
At two sites the following subjects were scanned using a 3T Siemens Skyra Fit (Siemens Healthineers, Erlangen, Germany), with a 16-channel head and neck coil:
Site 01: 4 HC [2F, age 37.5±14.6 years (mean ± standard deviation (SD))], 1 CSM (F, 71), 1 SCI (F, 44);
Site 02: 5 HC (1F, 47.0±10.3), 10 CSM (4F, 55.3±11.4).
The same whole brain and cervical cord (covering levels C2-C5) DTI protocols were performed at both sites; acquisition parameters are given in Figure 1.
Image Analysis:
Brain DTI data were co-registered to MNI space prior to running TractSeg (an automatic WM segmentation tool)3. The subject-specific CST obtained using TractSeg was used to mask DTI parameter maps, estimated using Camino4 (also in MNI space), and subsequently downsampled to give 5mm segments in the foot/head direction, from the bottom of the pons upwards.
Similarly, cord DTI data were transformed to the PAM50 template space5, and the CST obtained using the spinal cord toolbox6 (version 3.2.0) was used to mask DTI parameter maps, also downsampled to give 5mm sections along the foot/head direction.
In the cord, the left ventral and right lateral CST, and similarly right ventral and left lateral CST were combined. Between-group whole brain/cord CST differences were tested via one-way ANCOVA (using IBM SPSS for Windows, v22.0), with age and gender included as covariates.
Results
Example single slice brain and cord images for a HC are shown in Figure 2.
Mean parameter values measured along the CST in the foot/head direction are plotted in Figures 3 (HC both sites) and 4 (HC and CSM site 02).
Whole cord and brain CST mean parameter values are given in Figure 5.
Intra-site CoVs were 0.86-7.36% and 3.65-13.6% in site 01 brain and cord respectively, and 1.18-2.41% and 6.53-25.1% in site 02 respectively. Inter-site CoVs ranged from 1.11-8.28% in the brain and 4.86-19.6% in the cord.
At site 01, right brain CST MD was increased in CSM and SCI (p<0.05). In the cord, left MD and RD were reduced in CSM and increased in SCI (p<0.05), compared to HC.
At site 02, right brain AD was reduced in CSM (p<0.05), and in the cord right FA was reduced in CSM (p<0.05), compared to HC.
Discussion and Conclusions
We established a pipeline to extract the CST profile from the cervical spinal cord to the brain in standard space. Qualitatively, the profiles of all DTI parameters along both CSTs followed very similar patterns, when comparing HC across sites or CSM and HC at site 02 (figures 3 and 4). However, some differences may be appreciated indicating areas where subjective variability may be higher, e.g. near the cortex.
The higher DTI parameters observed in the cord compared to the brain could be due to the much lower b-value (500smm-2) used in the cord protocol7. Cord parameters were also more variable, possibly due to the lower SNR of the protocol.
Alterations of DTI parameters at different levels along the CST in CSM patients can be seen in figure 4. Statistically significant changes were observed between CSM and SCI and HC when comparing averaged brain or cord CST, demonstrating the sensitivity of CST metrics to pathology; however this data is part of a larger ongoing multi-centre study, which is expected to strengthen these findings.
Acknowledgements
This study was funded by INSPIRED (a spinal cord imaging grant funded by the International Spinal Research Trust, Wings for Life, and CHNF). Funding was also received from the MS Society of the UK (grant reference 77/2018), and the Department of Health’s NIHR Biomedical Research Centres funding scheme (NIHR BRC UCLH/UCL High Impact Initiative-BW.mn.BRC10269). Additionally, this project has received funding from the European Union's Horizon 2020 research and innovation programme under the grant agreement No 681094, and is supported by the Swiss State Secretariat for Education, Research and Innovation (SERI) under contract number 15.0137. We would also like to thank all the participants of the study.References
[1] Kolb, B. & Whishaw, I. Q. (2009). Fundamentals of human neuropsychology: Sixth edition. New York, NY: Worth Publishers;
[2] Gandini Wheeler-Kingshott, CAM et al Neuroimage 84:1082-93 (2014);
[3] Wasserthal J et al. NeuroImage Volume 183: 239-253 (2018);
[4] Cook, PA et al. Proc ISMRM p2759 (2006);
[5] De Leener B et al­. NeuroImage 165 :170-79 (2018);
[6] De Leener B et al NeuroImage 45 (Pt A):24-43 (2017) ;
[7] Hui ES et al. Neuroimage 49(3): 2366-74 (2010).
Figures
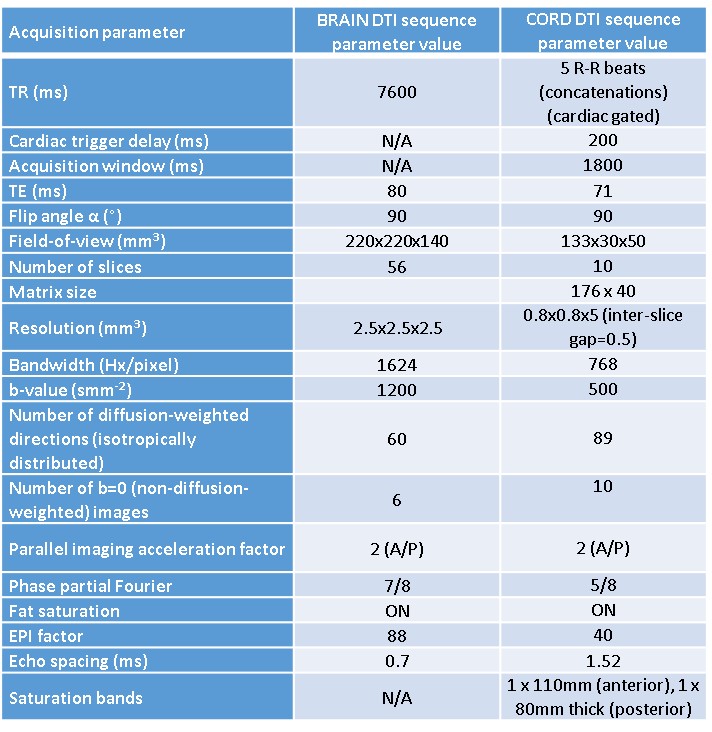
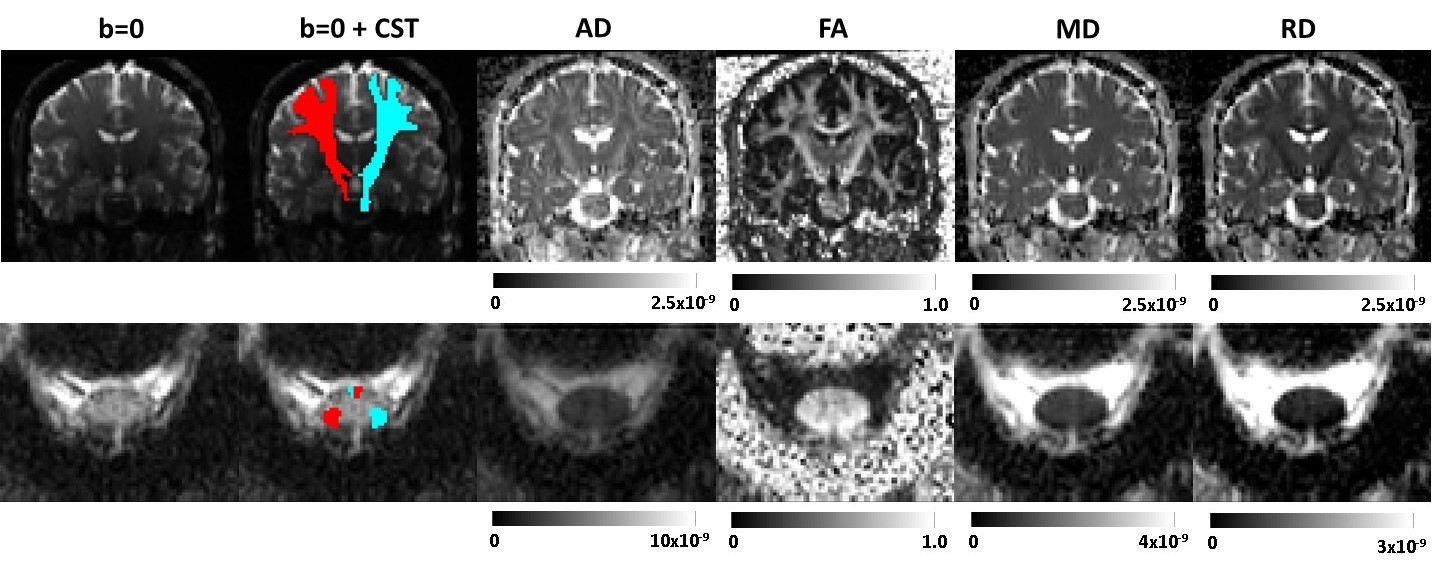
Figure 2: Single slice example HC images and parameter maps for the brain (top), displayed coronally, and cord (bottom), displayed axially. From left to right: b=0, b=0 with CST overlaid (right in red, left in blue), AD, FA, MD, RD. Colour bar units are m2s-1 (except for FA which is a ratio).
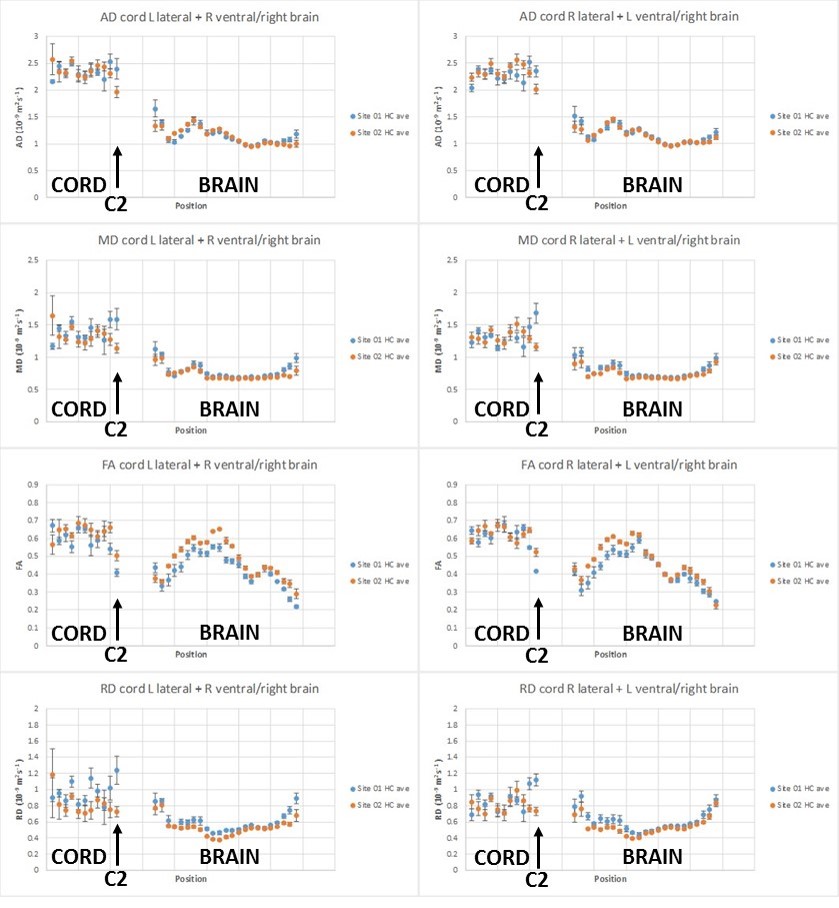
Figure 3: HC average CST DTI parameter values from both sites plotted as a function of position from the cervical cord upwards in 5mm sections (note the gap between cord and brain at the brainstem level). Arrows indicate C2 cervical cord level, and error bars are standard errors. The left ventral and right lateral cord CST were paired with left brain and vice versa, since the lateral portions of the CST cross over at the level of the medulla/brainstem, whereas the ventral portions do not.
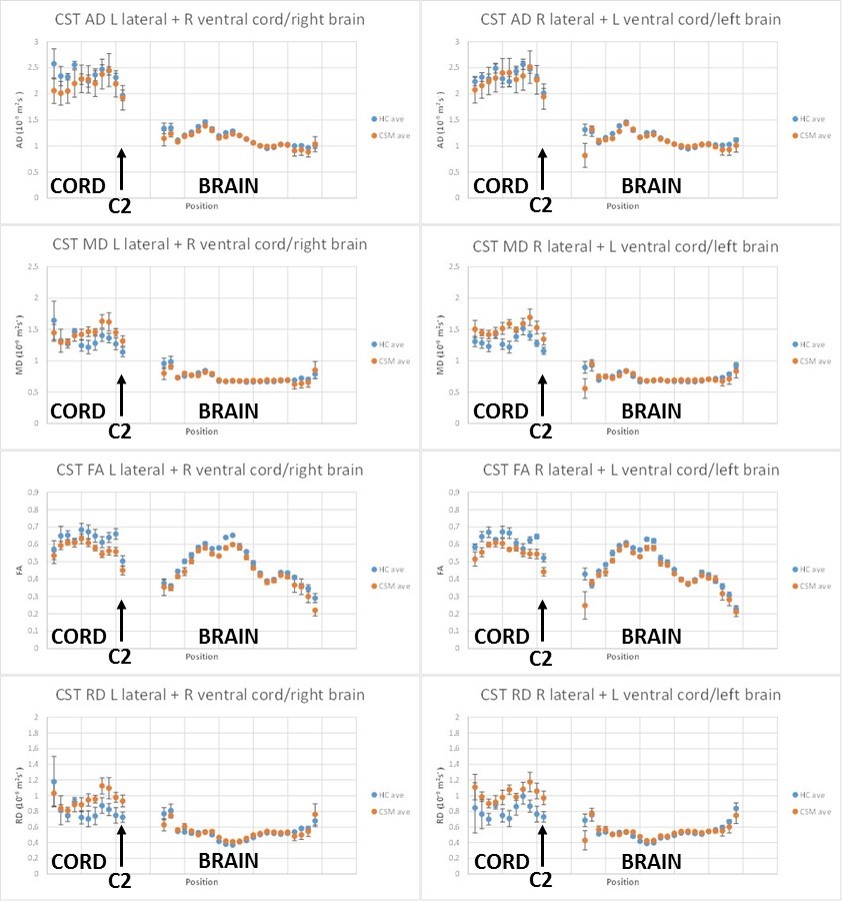
Figure 4: Site 02 CST DTI parameter values plotted as a function of position from the cervical cord upwards in 5mm sections (note the gap between cord and brain at the brainstem level). Arrows indicate C2 cervical cord level, and error bars are standard errors. The left ventral and right lateral cord CST were paired with left brain and vice versa, since the lateral portions of the CST cross over at the level of the medulla/brainstem, whereas the ventral portions do not.
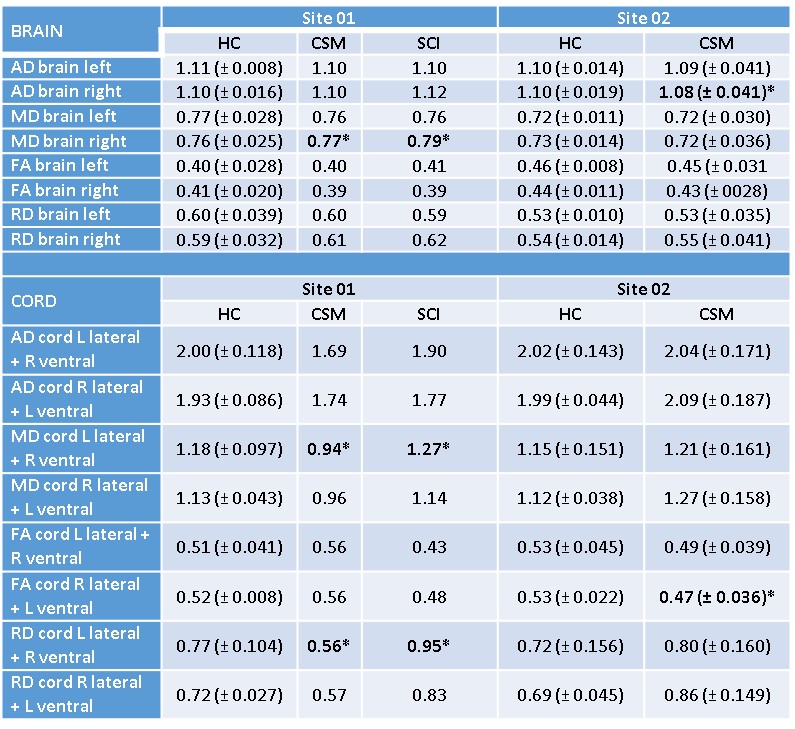
Figure 5: Brain or cord parameters over all CST levels (mean ±SD) for each site and subject group; *= p<0.05 compared to HC. Units are m2s-1 (except for FA which is a ratio).