2884
Quantitative MRI investigation above a cervical myelopathy in traumatic and non-traumatic spinal cord injury1Spinal Cord Injury Center Balgrist, University of Zurich, Zurich, Switzerland, 2Department of Neurophysics, Max Planck Institute for Human Cognitive and Brain Sciences, Leipzig, Germany, 3Department of Brain Repair and Rehabilitation, UCL Institute of Neurology, London, United Kingdom, 4Wellcome Trust Centre for Neuroimaging, UCL Institute of Neurology, London, United Kingdom
Synopsis
Traumatic Cervical Spinal Cord Injury (tSCI) and non-traumatic Cervical Spondylotic Myelopathy (CSM) present a focal damage to the cervical cord with different time profile. Myelin and axonal loss occurs in SCI and CSM; however, little is known how these neurodegenerative changes are comparable in both groups. Therefore, we applied T2*-weighted and DTI MRI at the cervical cord to compare macro/microstructural changes in CSM and tSCI. While the macrostructural changes were similar in both groups, DTI detected more microstructural changes in SCI. Time-dependent compensatory mechanism in CSM might account for less neurodegeneration and better clinical function compared to tSCI.
Background
Traumatic Cervical Spinal Cord Injury (tSCI) and non-traumatic Cervical Spondylotic Myelopathy (CSM) both lead to upper limp impairment due to a cervical myelopathy. While compression of the spinal cord slowly develops over time in CSM patients, tSCI results from a sudden onset damage to the cord. Despite the obvious clinical differences, experimental evidence suggests that common pathophysiological changes (e.g. demyelination and axonal damage) are triggered both in tSCI 1,2 and CSM 3. However, little is known about how these changes are comparable in SCI and CSM patients. Quantitative MRI (qMRI) measures showed great potentials to detect specific macro/microstructural changes of the cord 4–7. This could be carried out in CSM and later be translated to tSCI to overcome some of the shortcomings in SCI MRI. Therefore, we applied T2*-weighted MRI and diffusion tensor imaging (DTI) in both tSCI and CSM remote from the injury to compare macro/microstructural parameters sensitive to neurodegenerative changes in both groups.Materials and Methods
Twenty-five chronic tSCI patients (AIS A-D, mean age (±std) =47.4±19.8 years, 5 female) with cervical injury and 20 CSM patients (AIS D, mean age= 52.0 ± 14.2 years, 6 female) underwent a T2*-weighted (MEDIC) and a DTI scan on Skyra 3T Siemens Scanner. To assess macro-structural changes rostral to the lesion (C2-C3), a T2*-weighted MRI was performed using 3D multi-echo GRE sequence perpendicular to the cord with a resolution of 0.5×0.5 mm2, FOV=192×162mm2, slice-thickness=2.5 mm TR/TE=44/19 ms, and BW=260 Hz/pixel. Next, to quantify microstructural changes of the SC at the identical level, a high-resolution DTI was applied with a cardiac-gated reduced-FOV single-shot EPI sequence with following acquisition parameters: 6 images with b=0 s/mm2 and 30 images with b=500 s/mm2, nominal acquisition time=6.17 min. TR/TE=350/71 ms; slice thickness=5 mm, resolution=0.76×0.76 mm2; FOV=133×30 mm2; 5/8 Partial-Fourier imaging in the phase-encoding direction. All patients underwent clinical assessments measuring the upper limb sensorimotor functions (e.g. Upper extremity motor score (UEMS) and GRASSP8). We used Jim 6.0 software to measure cross-sectional spinal cord area (SCA), applying a semiautomatic 3D active-surface model. Grey matter (GMA) and white matter area (WMA) were extracted manually. DTI data were processed using the ACID toolbox optimized for the spinal cord 9. A diffusion tensor was fitted using a robust tensor fitting algorithm that accounts for outlier volumes due to motion and physiologic artefacts 10. The following DTI maps were extracted: fractional anisotropy (FA), mean, axial, and radial diffusivity (MD, AD, and RD). Next, the DTI maps were spatially normalized to a self-constructed mean diffusivity template residing in the spinal Montreal Neurological Institute space 11. Finally, all DTI index maps were smoothed with a full width at half-maximum Gaussian kernel with 0.5. Statistical analysis of all macrostructural MRI data was performed with Stata13 (Stata- Corp LP, College Station, TX), the level of significance was set to p=0.05. To compare microstructural changes between patient’s groups, we used SPM12 for voxel-based analysis of the different DTI maps (FA, AD, RD). All statistical parametric maps were thresholded with p<0.05 (family-wise error corrected).Results
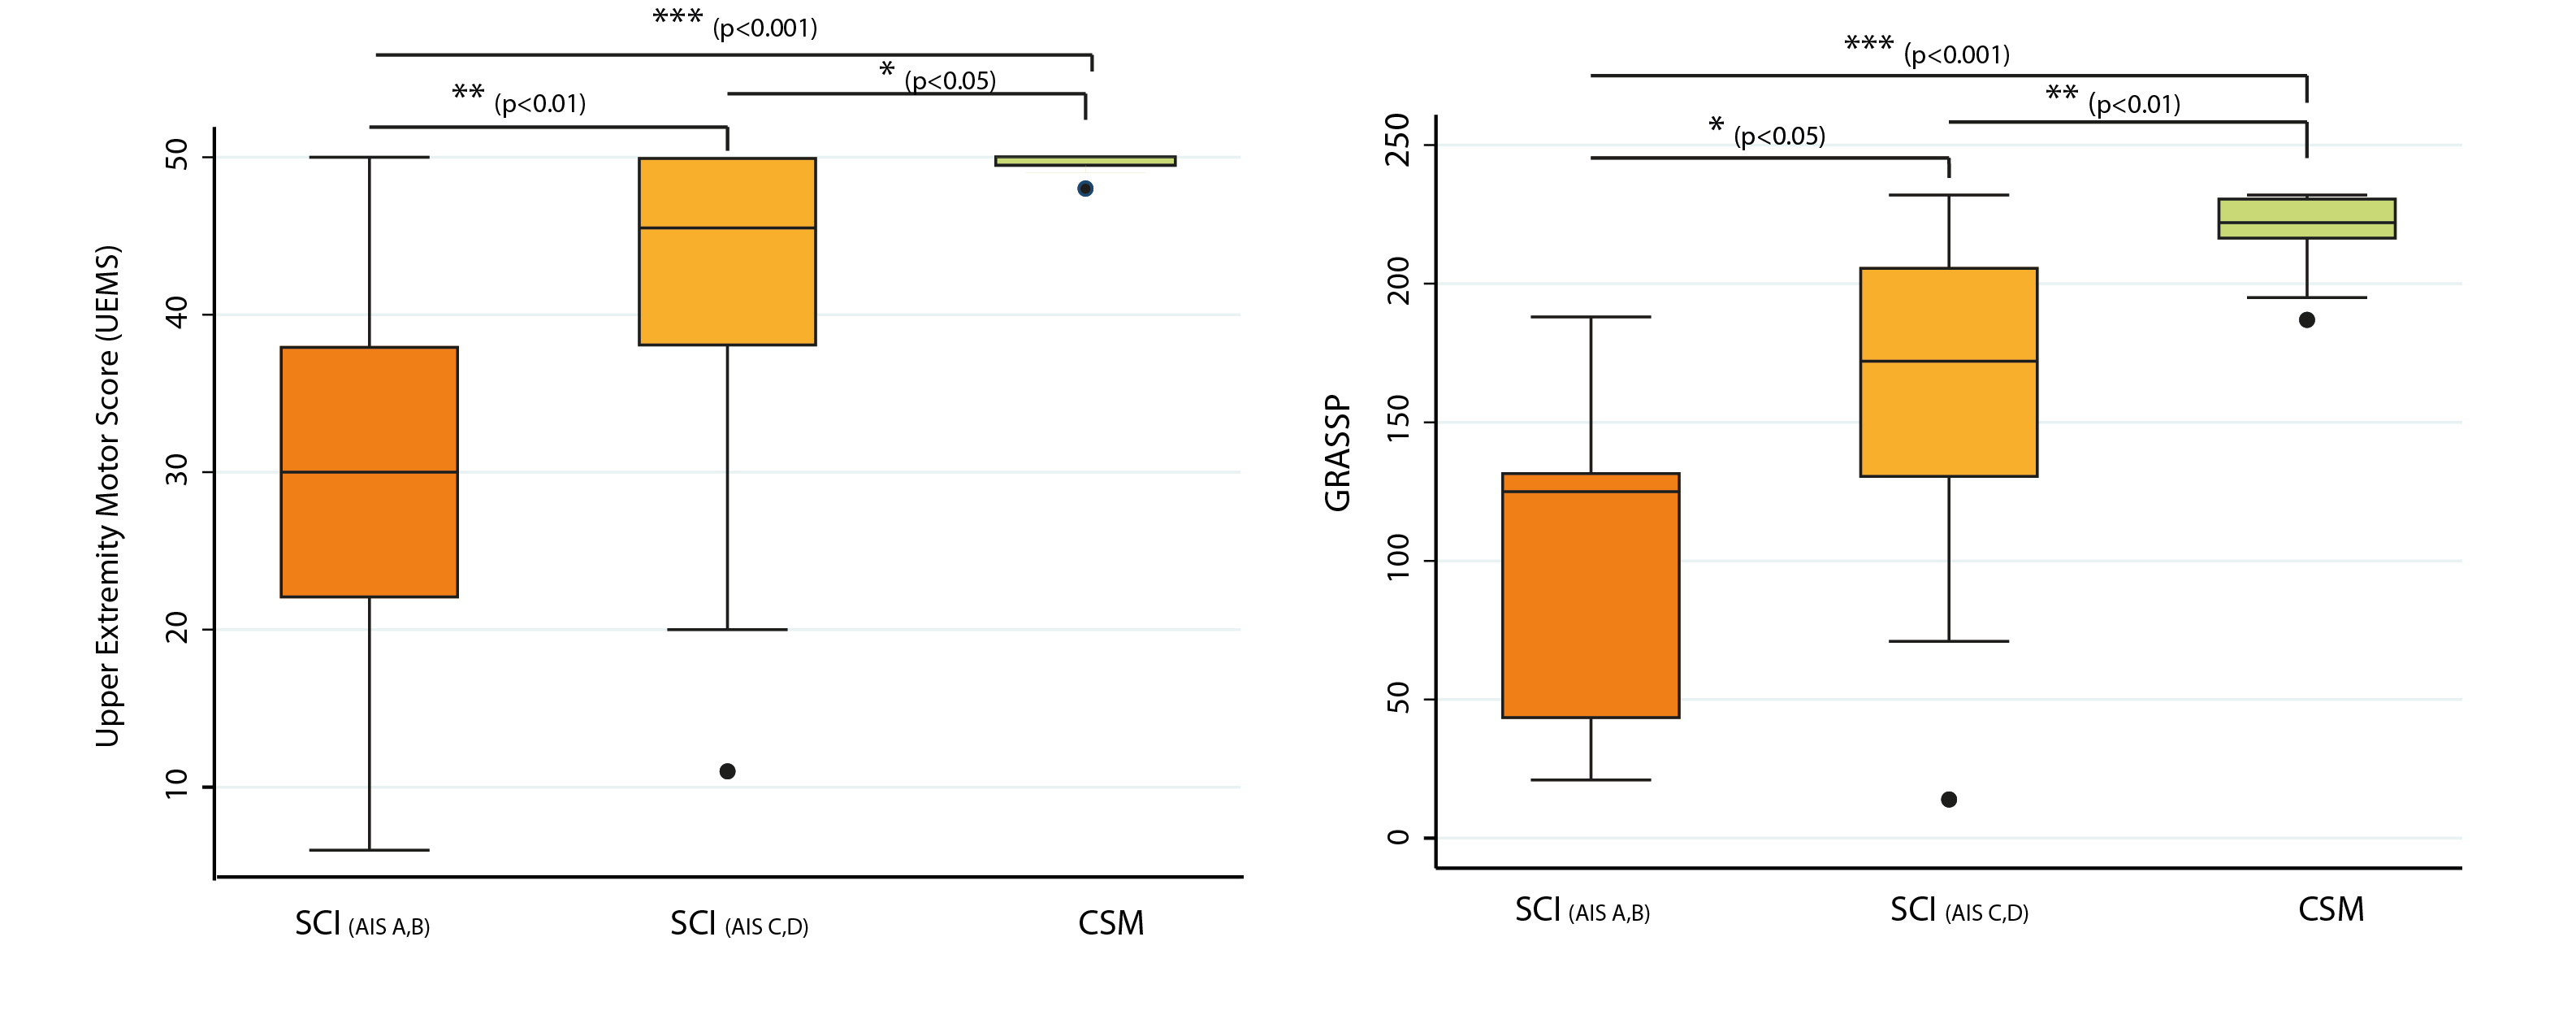
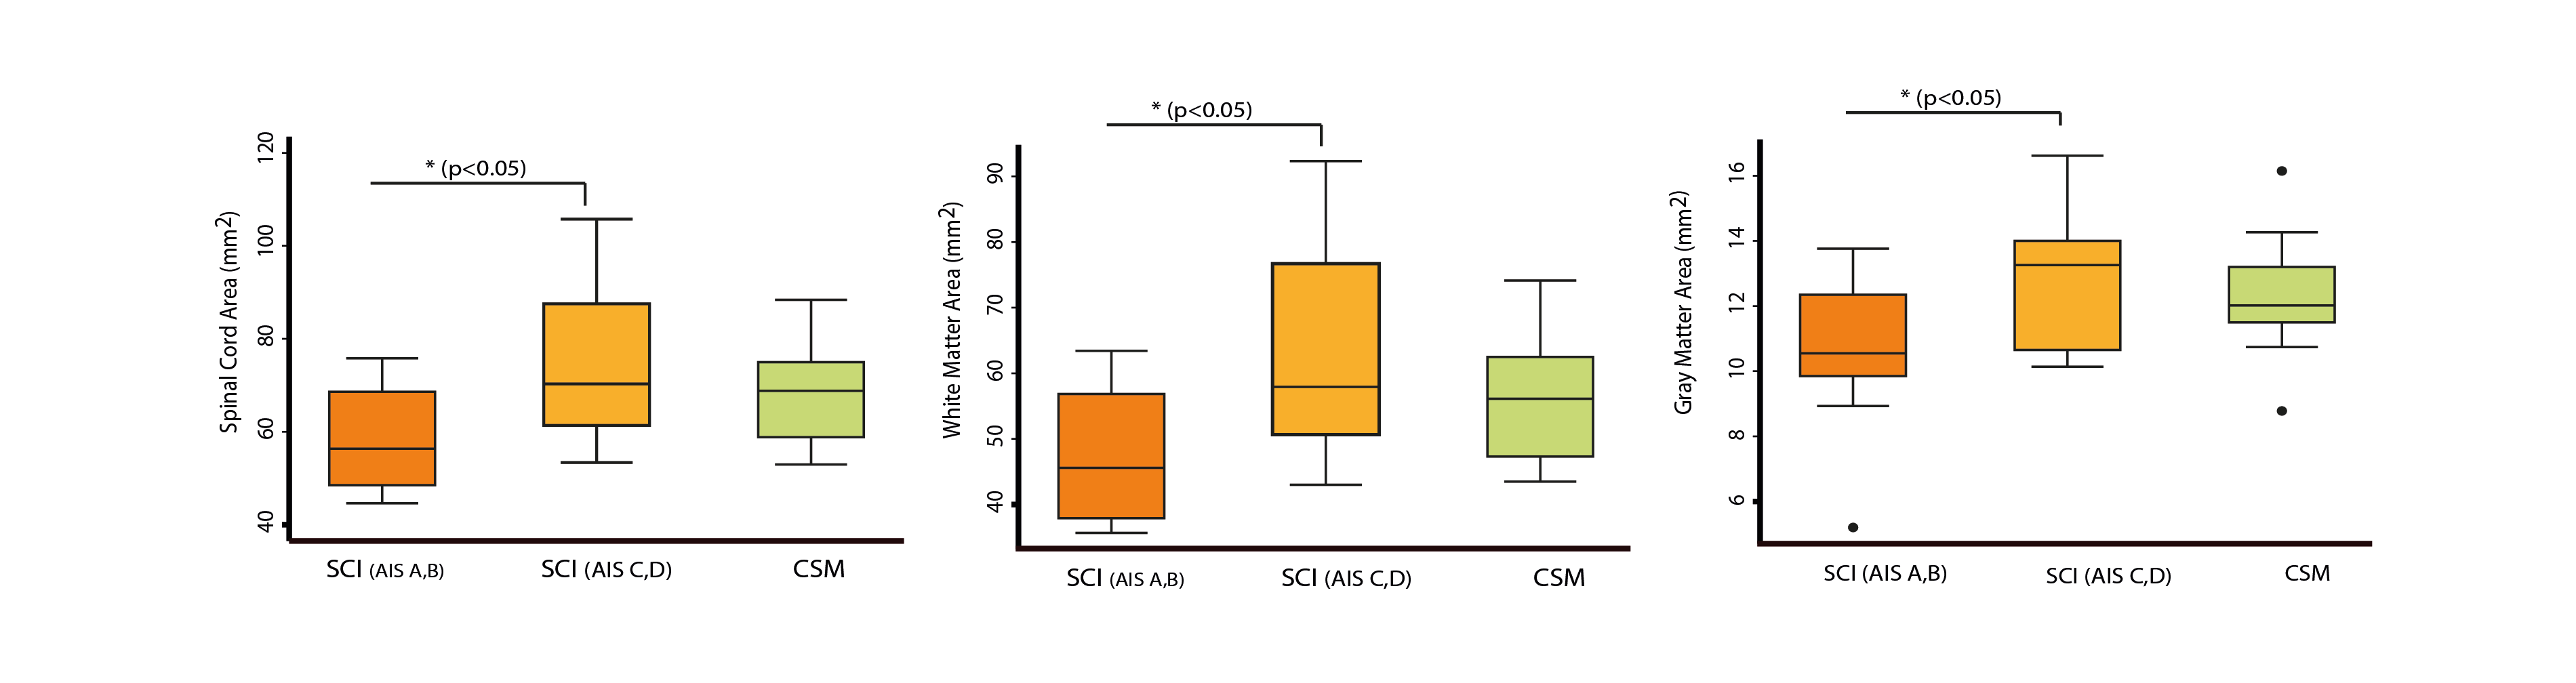
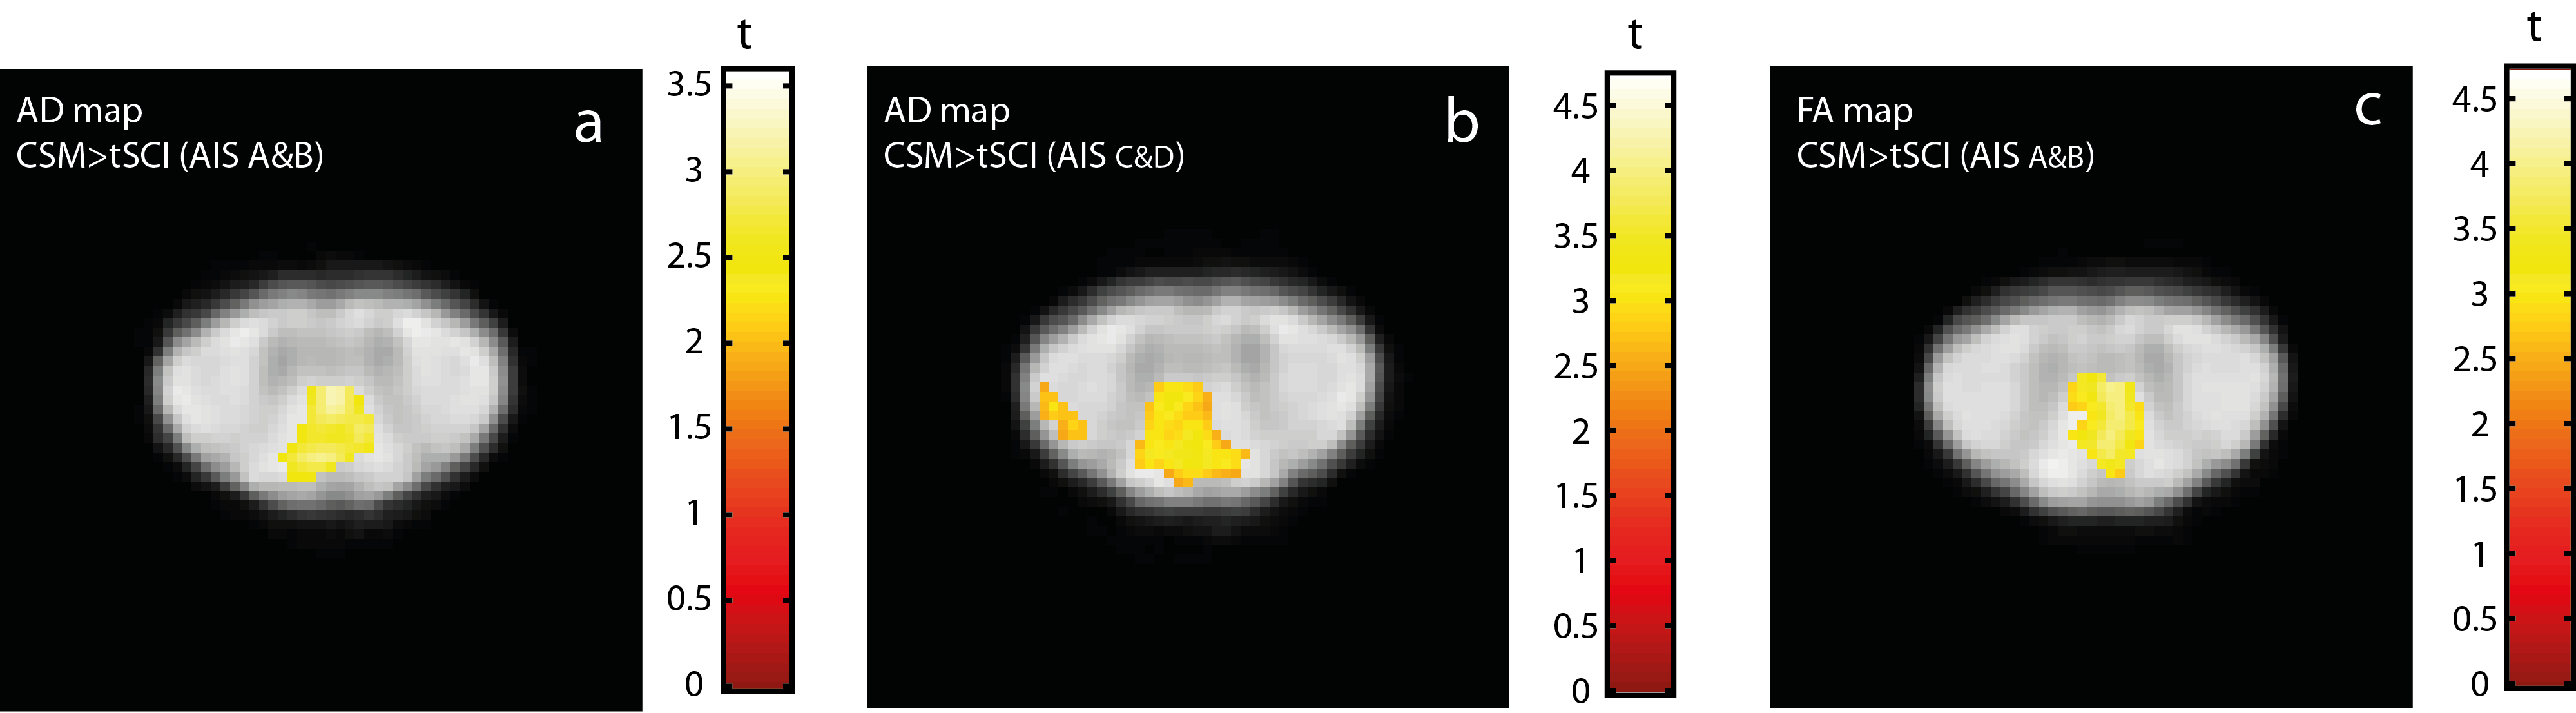
Traumatic SCI groups (AIS A&B and C&D) showed worse impairments in upper limb sensorimotor function when compared to the CSM group (p<0.001 and p<0.05, respectively) (Fig. 1). In terms of macrostructural differences, the SCA did not show differences between tSCI patients (58.9±11.8 mm2 and 75.3±16.7 mm2, respectively) and CSM patients (69.2±10.4 mm2) (Fig. 2). In tSCI groups, AD was reduced in the dorsal column (AIS A&B=-14.4%, p=0.005 and AIS C&D=-12.6%, p<0.001) and in the lateral corticospinal tract (AIS C&D= -11.1%, p=0.041) compared to the CSM patients. FA in dorsal column was reduced only in severely impaired SCI patients (AIS A&B group=-18.1%, p=0.001) compared to CSM patients (Fig. 3). There was no significant difference between RD measured in tSCI and CSM.Discussion and Conclusion
We applied high-resolution T2*-weighted MRI and DTI in tSCI and CSM. While significant differences were found in sensorimotor functions of severely impaired tSCI and CSM, the magnitude of macrostructural changes rostral to the level of the cervical myelopathy was similar. However, microstructural changes (i.e. axonal degeneration and demyelination) detected with DTI parameters were more pronounced in tSCI patients. Despite the difference in the clinical presentation, the magnitude of macrostructural changes rostral to the cervical myelopathy was rather similar in both groups. Thus, time-dependent compensatory mechanism in CSM patients might account for better functional status in CSM compared to tSCI. Such improved understanding of neurodegenerative changes via qMRI offers potential biomarkers for targeting underlying mechanisms of changes in clinical trials.Acknowledgements
This study was funded by INSPIRED (a spinal cord imaging grant funded by the International Spinal Research Trust, Wings for Life, and CHNF). Additionally, this project has received funding from the European Union's Horizon 2020 research and innovation program under the grant agreement No 681094 and is supported by the Swiss StateSecretariat for Education, Research and Innovation (SERI) under contract number 15.0137. We would also like to thank all the participants of the study.References
1. Lemon RN, Griffiths J. Comparing the function of the corticospinal system in different species: organizational differences for motor specialization? Muscle Nerve [online serial]. 2005;32:261–279.
2. Starkey ML, Schwab ME. Anti-Nogo-A and training: Can one plus one equal three? Exp. Neurol. Academic Press; 2012. p. 53–61.
3. Karadimas SK, Moon ES, Yu WR, et al. A novel experimental model of cervical spondylotic myelopathy (CSM) to facilitate translational research. Neurobiol Dis Academic Press; 2013;54:43–58.
4. Martin AR, De Leener B, Cohen-Adad J, et al. Can microstructural MRI detect subclinical tissue injury in subjects with asymptomatic cervical spinal cord compression? A prospective cohort study. BMJ Open 2018;8:e019809.
5. Cohen-Adad J. Microstructural imaging in the spinal cord and validation strategies. Neuroimage [online serial]. Academic Press; Epub 2018 Apr 7.
6. Huber E, David G, Thompson AJ, Weiskopf N, Mohammadi S, Freund P. Dorsal and ventral horn atrophy is associated with clinical outcome after spinal cord injury. Neurology. American Academy of Neurology; Epub 2018 Mar 28.:10.1212/WNL.0000000000005361.
7. Grabher P, Mohammadi S, Trachsler A, et al. Voxel-based analysis of grey and white matter degeneration in cervical spondylotic myelopathy. Sci Rep Nature Publishing Group; 2016;6:24636.
8. Kalsi-Ryan S, Curt a, Verrier MC, Fehlings MG. Development of the Graded Redefined Assessment of Strength, Sensibility and Prehension (GRASSP): reviewing measurement specific to the upper limb in tetraplegia. J Neurosurg Spine 2012;17:65–76.
9. Mohammadi S, Möller HE, Kugel H, Müller DK, Deppe M. Correcting eddy current and motion effects by affine whole-brain registrations: Evaluation of three-dimensional distortions and comparison with slicewise correction. Magn Reson Med Wiley-Blackwell; 2010;64:1047–1056.
10. Kamble RB, Venkataramana NK, Naik AL, Rao S V. Diffusion tensor imaging in spinal cord injury. Indian J Radiol Imaging Wolters Kluwer -- Medknow Publications; 2011;21:221–224.
11. Fonov VS, Le Troter A, Taso M, et al. Framework for integrated MRI average of the spinal cord white and gray matter: The MNI-Poly-AMU template. Neuroimage . Elsevier Inc.; 2014;102:817–827.
Figures