2880
Tracking progressive neurodegenerative processes after spinal cord injury: 5-year follow-up1Spinal cord injury center Balgrist, University of Zurich, Zurich, Switzerland
Synopsis
Spinal cord injury (SCI) triggers a cascade of neurodegenerative and compensatory changes across the neuroaxis. Rehabilitative training has been shown to improve clinical outcome following SCI. However, the spatial and temporal patterns of neurodegenerative processes follow a complicated trajectory over 2-years. Previous studies have already shown trauma-induced neurodegenerative processes and highlight the relationships amongst these in the cord and brain. Here, we investigate the trajectories of neurodegenerative changes that occur over a period of 5 years post-SCI.
Introduction:
Traumatic spinal cord injury (SCI) is a devastating and life changing incidence that leads instantaneously to permanent paralysis and loss of sensory input1. Functional recovery following SCI is rather restricted and the majority of patients will be left with severe impairments2. Rehabilitative training has been shown to improve clinical outcome while the neuronal mechanisms underlying neurological and functional recovery are not well understood3. Recent advances in quantitative neuroimaging of the spinal cord (SC) and brain provide the possibility of monitoring temporal changes of the macrostructure from the earliest onset of SCI. A longitudinal follow-up study over 2 years post-SCI provided already important insights into progressive degenerative changes across the neuroaxis4–6. The current study aims to extend this longitudinal study to 5-years follow-up in order to fully characterize the temporal profiles of the different trajectories of neurodegeneration across the neuroaxis. This would enable us to better understand the time course of basic disease mechanisms underpinning degeneration and neuronal damage and assess its contribution to recovery and impairment. We hypothesize that the cascade of neurodegenerative changes levels off with a lesion-level and activity dependent diaschisis over 5 years follow-up; and that the magnitude of trajectories in cord and brain (motor and sensory) areas relate to clinical recovery/impairment. We therefore aim to track the temporal and regional evolution of remote and focal MRI based structural changes over 5 years.Method:
Eighteen patients with traumatic SCI and 21 healthy controls participated in a 5-year longitudinal study. All participants underwent structural MRI (T1-weighted images) scans and multi parameter mapping (MPM) scans of whole-brain and cervical cord over 5 years (baseline, 2 months, 6 months, 12 months 24 months, and 60 months). In total, 212 MRI datasets were analyzed. However, currently we present only results from T1w scans. Patients were also assessed with the ISNCSCI motor and sensory scores7, SCIM scores8 and GRASSP scores9. The structural images were preprocessed using VBM10 and smoothed with 6-mm FWHM Gaussian-kernel. They underwent 2-stage summary statistics in SPM11. In the first stage, we used all time point scans from each subject to estimate the individual linear trajectory models y(t) = β0 + β1*t and generate the intercepts (β0) and rate of change (β1) maps; then in the second stage, rate of change maps of patients and controls were used in a 2-sample t-test to test for group differences while adjusting for age and sex. In order to investigate the morphometric changes at the cord level, we measured cross‐sectional spinal cord area (CSA), by manually segmenting the T1w MPRAGE image, at level C2/C3 using JIM 6.0 software12. And to measure anterior–posterior width (APW) and left–right width (LRW) next to CSA, an ellipse was fit to the boundary of the CSA. Then cervical SC data was analyzed using Stata 1313Results:
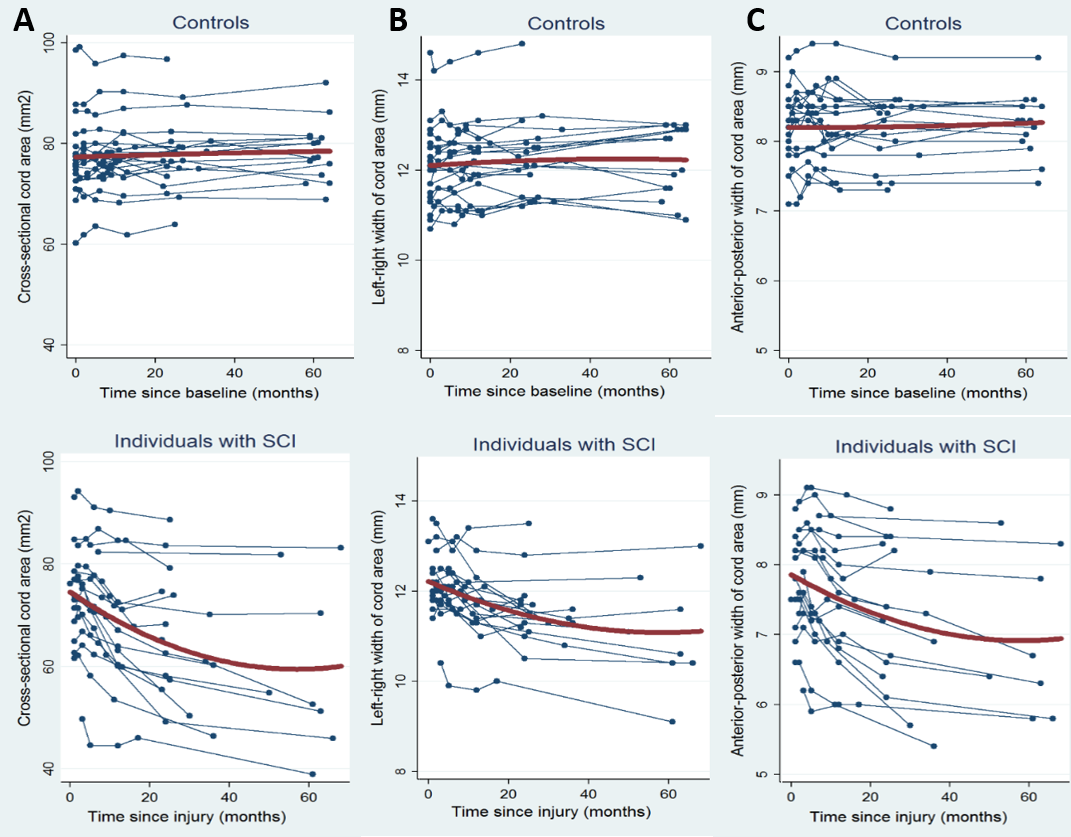
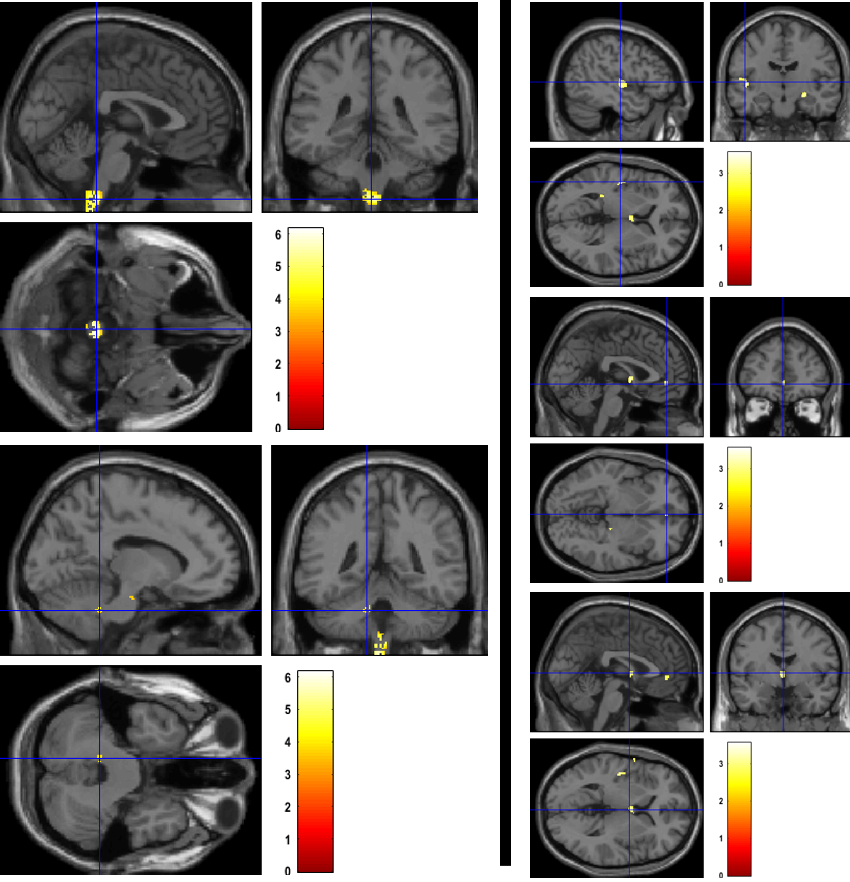
At the level of the spinal cord a decline in CSA by 0.53 mm2 per month (p < 0.001), APW by 0.03 mm per month (p < 0.001), and LRW by 0.04 mm per month (p < 0.001) was found in patients compared to controls (Figure 1). The rate of change of cord area decelerated (i.e., a positive quadratic effect) by 0.005 mm2 per month (p < 0.001), APW by 0.0003 mm per month (p < 0.001) and LRW by 0.0004 mm per month, (p< 0.001) over 5 years in patients compared to controls. At the level of the brain, WM volume within the corticospinal tracts (CST) of patients decreased more rapidly than in controls, with differences in the medulla oblongata and cerebellar peduncle over 5 years. GM volume decreased in the left insula, left ACC, and left thalamus (Figure 2).Discussion & Conclusion:
Trajectories of atrophy were observed in the same areas at the level of the cord and brain as already identified over the first 2 years5. Crucially, we now provide evidence that the rate of change on cord area and brain volume decelerated, indicating a halting of the neurodegenerative changes induced by a focal injury to the spinal cord at 45 years follow-up. Quantitative MR data (MT, R2*) will be analyzed next to understand the microstructural changes occurring in areas of atrophy and its association with clinical outcome.Acknowledgements
This work was supported by Wings for Life – Spinal Cord Research FoundationReferences
1. Zariffa J, Kramer JLK, Fawcett JW, et al. Characterization of neurological recovery following traumatic sensorimotor complete thoracic spinal cord injury. Spinal Cord. 2011;49(3):463-471. doi:10.1038/sc.2010.140.
2. Curt A, Van Hedel HJA, Klaus D, Dietz V. Recovery from a Spinal Cord Injury: Significance of Compensation, Neural Plasticity, and Repair. J Neurotrauma. 2008;25(6):677-685. doi:10.1089/neu.2007.0468.
3. Huber E, Curt A, Freund P. Tracking trauma-induced structural and functional changes above the level of spinal cord injury. Curr Opin Neurol. 2015;28(4):365-372. doi:10.1097/WCO.0000000000000224. 4. Freund P, Weiskopf N, Ashburner J, et al. MRI investigation of the sensorimotor cortex and the corticospinal tract after acute spinal cord injury: a prospective longitudinal study. Lancet Neurol. 2013;12(9):873-881. doi:10.1016/S1474-4422(13)70146-7.
5. Ziegler G, Grabher P, Thompson A, et al. Progressive neurodegeneration following spinal cord injury. Neurology. March 2018:10.1212/WNL.0000000000005258. doi:10.1212/WNL.0000000000005258. 6. Grabher P, Callaghan MF, Ashburner J, et al. Tracking sensory system atrophy and outcome prediction in spinal cord injury. Ann Neurol. 2015;78(5):751-761. doi:10.1002/ana.24508.
7. Kirshblum SC, Waring W, Biering-Sorensen F, et al. International standards for neurological classification of spinal cord injury (Revised 2011). J Spinal Cord Med. 2011;34(6):547-554. doi:10.1179/107902611X13186000420242.
8. Catz A, Itzkovich M, Agranov E, Ring H, Tamir A. SCIM--spinal cord independence measure: a new disability scale for patients with spinal cord lesions. Spinal Cord. 1997;35(12):850-856.
9. Kalsi-Ryan S, Beaton D, Curt A, et al. The Graded Redefined Assessment of Strength Sensibility and Prehension: Reliability and Validity. J Neurotrauma. 2012;29(5):905-914. doi:10.1089/neu.2010.1504. 10. Ashburner J, Friston KJ. Voxel-Based Morphometry—The Methods. Neuroimage. 2000;11(6):805-821. doi:10.1006/nimg.2000.0582.
11. Friston K, Holmes A, Worsley K, Poline J, Frith C, Frackowiak R. Statistical parametric maps in functional imaging: A general linear approach. Hum Brain Mapp. 1994;2(4):189-210.
12. JIM, Xinapse Systems – Medical Image Analysis. http://www.xinapse.com/.
13. STATA 13. https://www.stata.com/.
Figures