2879
Investigating microstructural correlates of neuropathic pain in spinal cord injury patients using source-based morphometry1Spinal cord injury center Balgrist, University of Zurich, Zurich, Switzerland
Synopsis
Spinal cord injury (SCI) triggers a cascade of neurodegenerative and compensatory changes across the neuroaxis. The majority of SCI patients develop neuropathic pain (NP) as a secondary complication. In this study, we applied source-based-morphometry to investigate remote microstructural changes sensitive to myelin and iron deposition in brain areas associated with pain processing and explored the associations of these microstructural changes with pain intensity.
Introduction:
The majority of Spinal cord injury (SCI) patients develop neuropathic pain (NP) as a secondary consequence following injury. NP negatively impacts the quality of life, it is associated with depression, and reduces a patient's capacity to participate in rehabilitation and return to work1. Crucially, NP– once established– continues or even worsens over time2. This study aims to investigate the relationship between the remote microstructural changes in the brain and the magnitude of NP using source-based morphometry (SBM). SBM3 is a technique that uses independent component analysis to provide morphological variations among subjects for instance gray matter (GM) and white matter (WM). The main advantage of SBM3 is it is multivariate analysis and accounts for spatial dependencies between different brain regions unlike univariate analysis4, thus more sensitive than univariate analysis.Method:
Thirty chronic SCI patients (age 44.66 years ± 16.7)
with a traumatic injury (13 neuropathic-pain (NP) and 17 no-pain (No-NP))
underwent a high resolution MPRAGE and multi parameter
mapping (MPM) scans. MPM maps are useful in looking
at microstructural changes in the brain and consists of magnetization transfer
(MT), longitudinal relaxation rate (R1), and transverse relaxation rate (R2*)
maps whereas MPRAGE images are useful to look at the volumetric changes in the
brain. The MPRAGE
images and the MPM maps were preprocessed using VBM4
& VBQ5 and segmented into gray matter
(GM), white matter (WM), and cerebrospinal fluid (CSF). These segmentations
were then smoothed with 6-mm FWHM Gaussian-kernel and used as input to
SBM to get different components (between 6 to 10) and its associated mixing-matrix
as output. Each column of the mixing-matrix
expresses the contribution of every component to the 30 subjects. Therefore, a
two-sample t-test
can be used to each of these columns to test which components show a difference
between NP and No-NP patients. A corrected threshold of p < 0.05 (FDR-corrected)
was used as control for the number of components tested. To test the clinical association
of each region in the significant components, a mask was created from these
regions and the voxel values extracted from all individuals. Then a linear regression
analysis was performed to investigate the associations between micro-structural changes and pain
intensity) corrected for age and lesion level.Results:
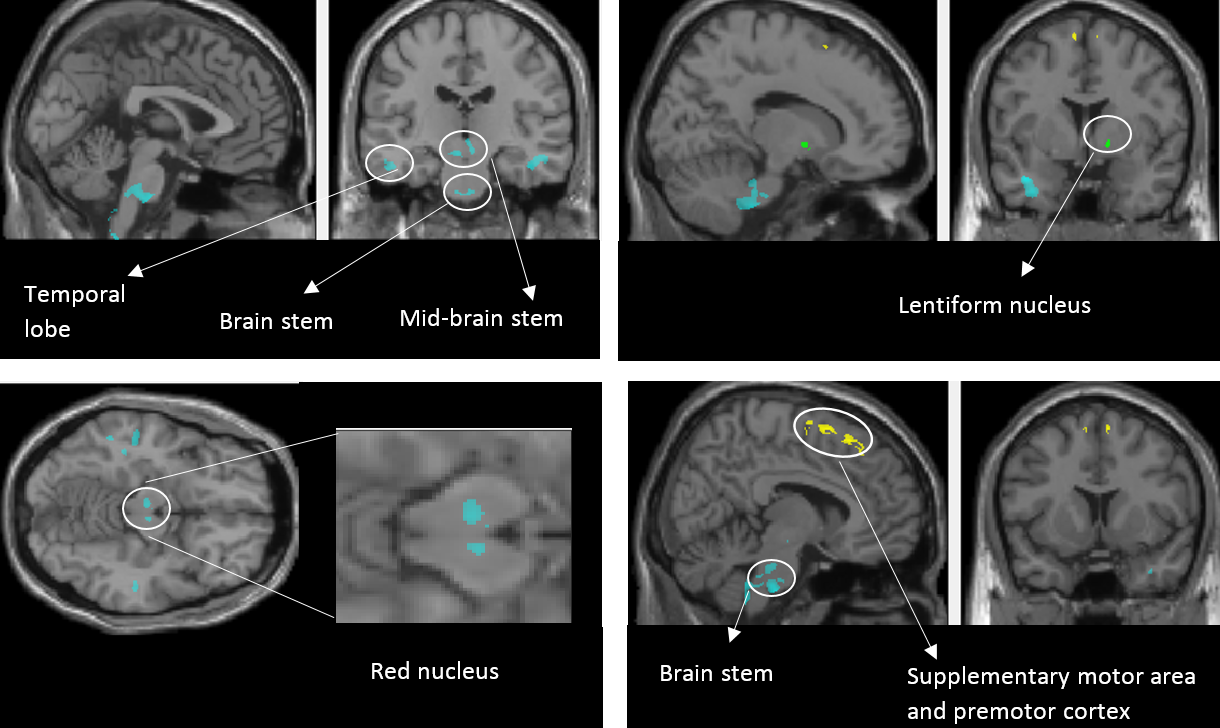
Individuals with NP had reduced myelin-sensitive MT in pre-motor cortex and supplementary motor area, reduced iron-sensitive R2* in the lentiform nucleus, and increased R2* in the Red nucleus (bilaterally), brainstem and temporal lobe when compared to SCI patients with no pain (Figure-1). They also showed reduced GM volume in S1, M1, pre-motor cortex, precuneus and thalamus; and increased GM volume in the insula, rolandic operculum, para-hippocampal gyrus, fusiform gyrus, middle temporal gyrus and angular gyrus6 when compared to SCI patients with no pain (Figure-2). In patients with NP, greater GM volume in the insula was associated with higher pain-intensity (r =0.66; p =0.02) whereas higher GM volume in the thalamus was associated with lower pain-intensity (r =0.67; p =0.02) (Figure-3). No microstructural correlations with pain intensity were detected.Discussion & Conclusion:
We observe for the first-time myelin (MT) and iron-sensitive (R2*) changes in the areas associated with pain processing (Figure-1). In patients with NP, decreased R2* – reflecting less iron accumulation – was found in the red nucleus, brainstem, and temporal lobe indicating that these areas are more metabolically active than in those patients with no pain7. Studies have shown that stroke causes NP8, but in SCI these must be trans-synaptic changes that occur, for instance at lentiform nucleus and cause NP. And we observed increased R2* at lentiform nucleus, which indicate the damage to lentiform nucleus. Decreased MT values for NP patients in the atrophied premotor cortex indicates demyelination within areas of atrophy. A study comparing NP and No-NP patients using DTI observed increased MD values in NP group, representing more demyelination/axonal loss which is in line with our findings. Along with microstructural changes, we also see volumetric changes (Figure-2) in NP patients. They were in line with previous studies where they have been reported for different pain conditions6,10–13 Regression analysis showed significant associations between the observed structural changes and pain intensity (Figure-3). Specifically, GM volume in the posterior-insula was positively correlated with pain-intensity, whereas GM volume in the thalamus was negatively correlated with pain-intensity. Though both posterior-insula and thalamus are involved in pain processing6,14 further investigations should be performed to understand why these regions are acting in a bidirectional manner.Acknowledgements
This work was supported by Wings for Life – Spinal Cord Research FoundationReferences
1. Burke D, Fullen BM, Stokes D, Lennon O. Neuropathic pain prevalence following spinal cord injury: A systematic review and meta-analysis. Eur J Pain. 2017;21(1):29-44. doi:10.1002/ejp.905.
2. Siddall PJ, McClelland JM, Rutkowski SB, Cousins MJ. A longitudinal study of the prevalence and characteristics of pain in the first 5 years following spinal cord injury. Pain. 2003;103(3):249-257. doi:10.1016/S0304-3959(02)00452-9.
3. Xu L, Groth KM, Pearlson G, Schretlen DJ, Calhoun VD. Source-based morphometry: The use of independent component analysis to identify gray matter differences with application to schizophrenia. Hum Brain Mapp. 2009;30(3):711-724. doi:10.1002/hbm.20540.
4. Ashburner J, Friston KJ. Voxel-Based Morphometry—The Methods. Neuroimage. 2000;11(6):805-821. doi:10.1006/nimg.2000.0582.
5. Draganski B, Ashburner J, Hutton C, et al. Regional specificity of MRI contrast parameter changes in normal ageing revealed by voxel-based quantification (VBQ). Neuroimage. 2011;55(4):1423-1434. doi:10.1016/j.neuroimage.2011.01.052.
6. Gustin SM, Peck CC, Wilcox SL, Nash PG, Murray GM, Henderson LA. Different pain, different brain: thalamic anatomy in neuropathic and non-neuropathic chronic pain syndromes. J Neurosci. 2011;31(16):5956-5964. doi:10.1523/JNEUROSCI.5980-10.2011.
7. Martucci KT, Ng P, Mackey S. Neuroimaging chronic pain: what have we learned and where are we going? Future Neurol. 2014;9(6):615-626. doi:10.2217/FNL.14.57.
8. Russmann H, Vingerhoets F, Ghika J, Maeder P, Bogousslavsky J. Acute infarction limited to the lenticular nucleus: clinical, etiologic, and topographic features. Arch Neurol. 2003;60(3):351-355.
9. Bushnell MC, Duncan GH, Hofbauer RK, Ha B, Chen JI, Carrier B. Pain perception: is there a role for primary somatosensory cortex? Proc Natl Acad Sci U S A. 1999;96(14):7705-7709.
10. Castillo Saavedra L, Mendonca M, Fregni F. Role of the primary motor cortex in the maintenance and treatment of pain in fibromyalgia. Med Hypotheses. 2014;83(3):332-336. doi:10.1016/j.mehy.2014.06.007.
11. Gustin SM, Wrigley PJ, Youssef AM, et al. Thalamic activity and biochemical changes in individuals with neuropathic pain after spinal cord injury. Pain. 2014;155(5):1027-1036. doi:10.1016/j.pain.2014.02.008.
12. Cao S, Qin B, Zhang Y, et al. Herpes zoster chronification to postherpetic neuralgia induces brain activity and grey matter volume change. Am J Transl Res. 2018;10(1):184-199.
13. Ab Aziz CB, Ahmad AH. The role of the thalamus in modulating pain. Malays J Med Sci. 2006;13(2):11-18.
Figures