2878
Simultaneous Voxel Based Analysis of Brain and Spinal Cord: Application to Spinal Cord Injury Patients1Spinal Cord Injury Center Balgrist, University Hospital Zurich, University of Zurich, Zurich, Switzerland, Zürich, Switzerland, 2Wellcome Centre for Human Neuroimaging, UCL Institute of Neurology, University College London, UK, London, United Kingdom, 3Department of Neurophysics, Max Planck Institute for Human Cognitive and Brain Sciences, Leipzig, Germany, Leipzig, Germany, 4Department of Brain Repair and Rehabilitation, UCL Institute of Neurology, University College London, London, UK, London, United Kingdom
Synopsis
Assessing the sequelae of a focal CNS injury across the entire neuroaxis holds great potential to better understand the temporal and spatial distributed pathophysiological changes. Currently, voxel-based analysis is either performed at the level of the spinal cord or brain. As a result, most imaging studies fail to implement and analyse the interactions between remote areas across the CNS. In this study, a new probabilistic-atlas including brain and cervical spinal cord (SC) was used for the simultaneous, fully automated and multi-parametric analysis in SPM framework. This approach was validated by assessing trauma-induced changes in SCI patients and compared with findings from analytical tools assessing the brain and cord separately.
Background
Spinal cord injury (SCI) triggers widespread and progressive structural changes within the spinal cord and brain. MRI data, such as MPRAGE are sensitive to morphometric changes; whereas quantitative magnetic resonance imaging (qMRI) protocols, e.g. multi-parameter mapping (MPM) provide quantitative estimates of longitudinal relaxation rate (R1=1/T1), effective proton density (PD*), magnetization transfer saturation (MT) and effective transverse relaxation rate (R2*=1/T2*) which are sensitive to myelin and iron changes. Such data help to provide a better understanding of underlying mechanisms in the brain and spinal cord (SC). To date, no tools have been available for the simultaneous analysis of microstructural changes in the brain and SC, which instead have to be analysed independently. In this study we incorporate a newly developed probabilistic atlas into the SPM framework (fil.ion.ucl.ac.uk/spm) to conduct a simultaneous brain and cervical spinal cord analysis of SCI.Materials and Methods
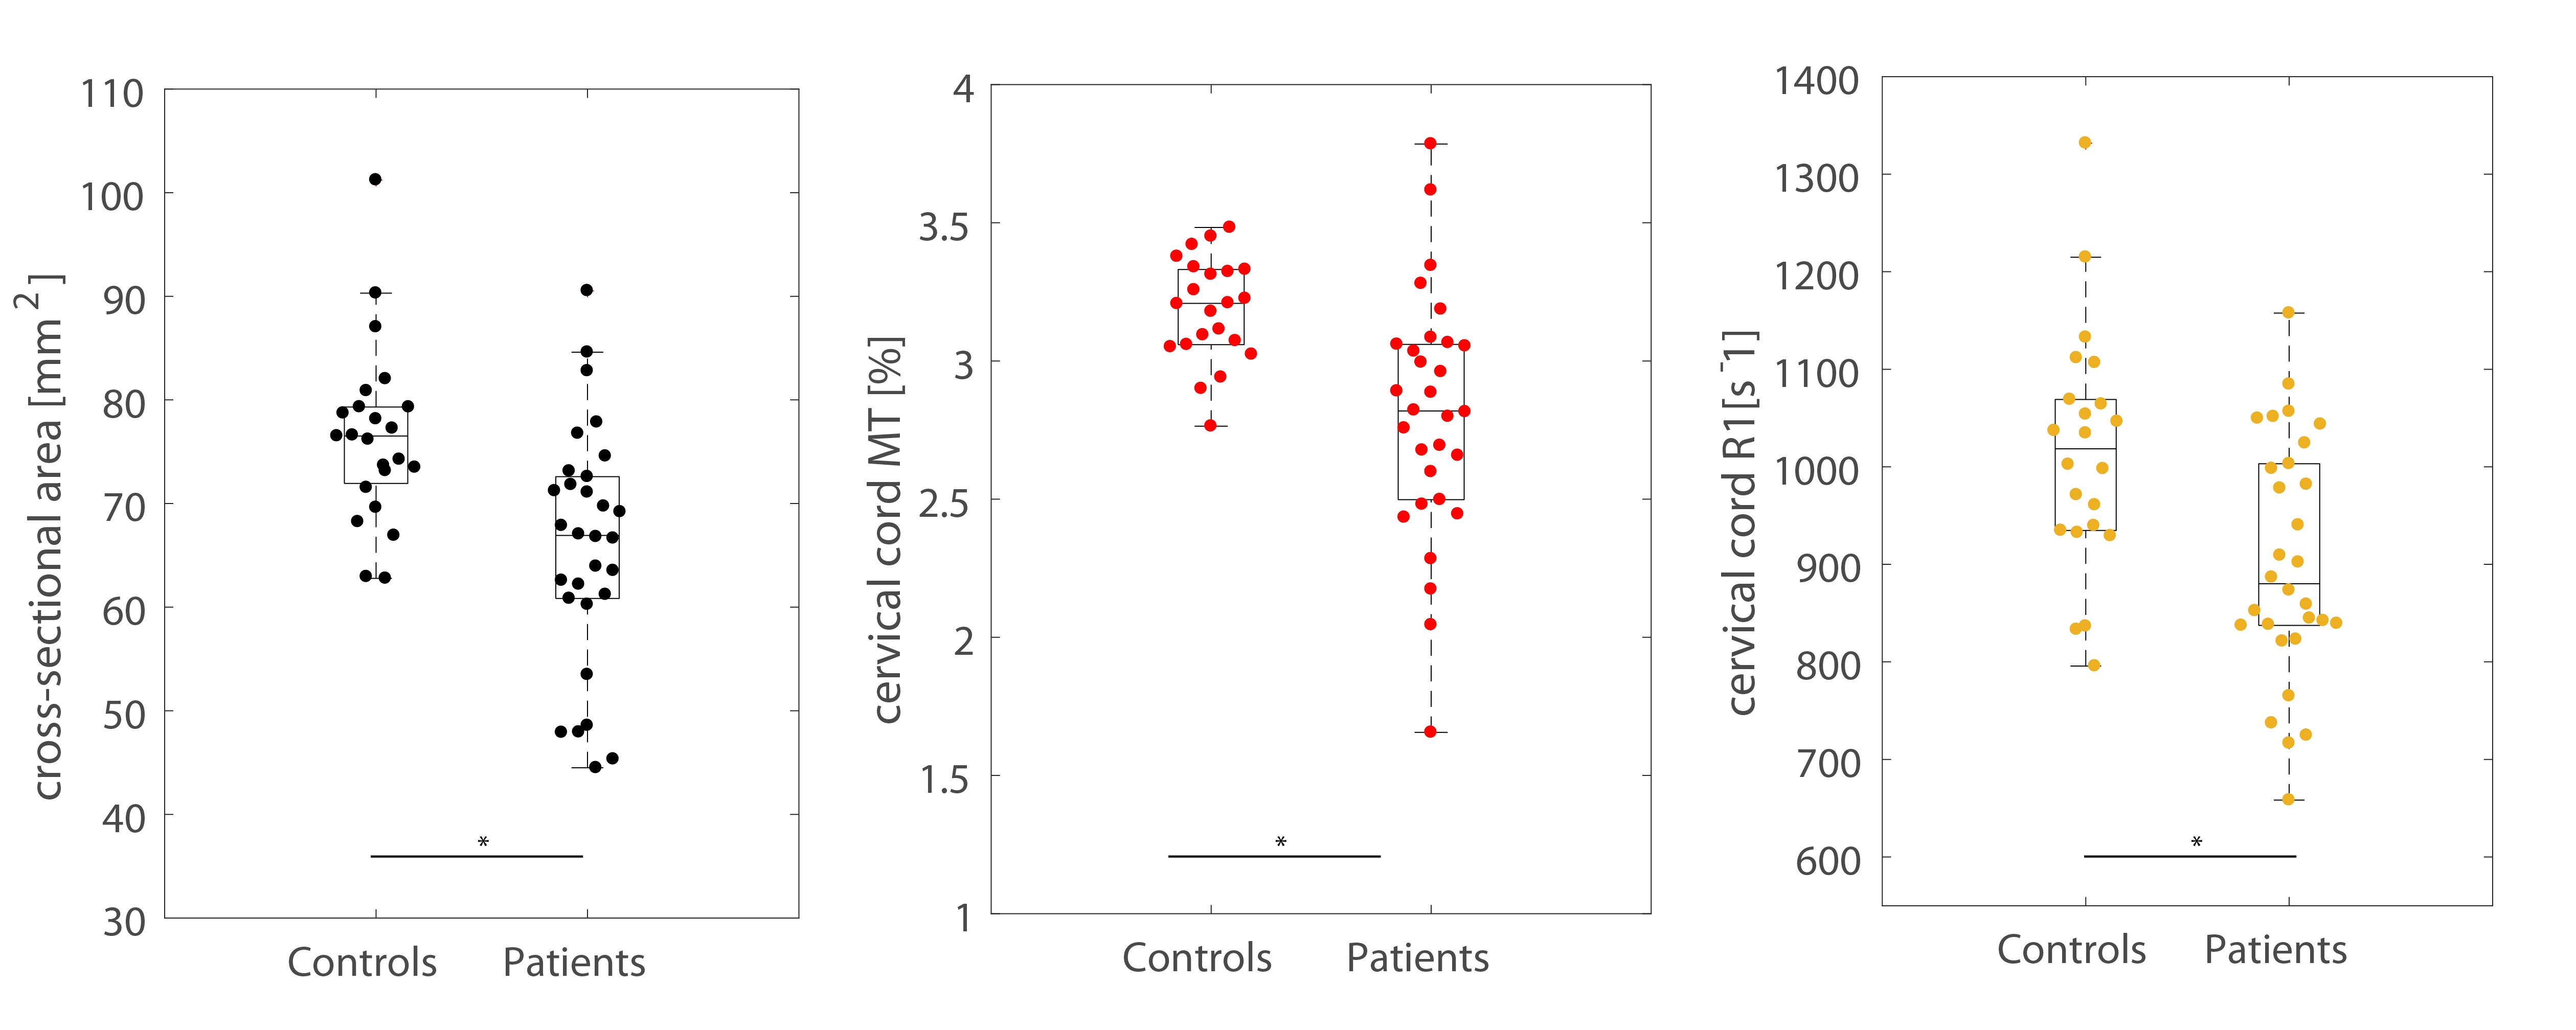
QMRI data from 30 patients (29 men; age = 42.61 ± 17.63) with chronic traumatic SCI and 23 healthy subjects (13 men; age = 36.87 ± 11.76) were acquired. The acquisition protocol included: a 3D-MPRAGE T1-weighted scan (FOV=224×256mm2, TR/TE=2420/4.18ms, BW=150Hz/p) and the MPM protocol (TR/flip angle=25ms/23° for T1-weighted, 25ms/4° for PD-weighted and 37ms/9° for MT-weighted images). Voxel-wise analyses of morphometry (VBM2) and the quantitative parameter maps (VBQ3) were carried out. In order to extend the analysis to incorporate both the brain and SC, a new probabilistic atlas of the brain and cervical SC was created using a generative semi-supervised modelling approach as presented in Blaiotta et. al1. Multivariate structural MR data of healthy subjects were used for generating the template. The template provides seven tissue maps including brain and spinal cord until level C3. We incorporated this template in the pre-processing of VBM2 and VBQ3 pipelines. The delineation of GM and WM in the cord was not consistent across all levels and so these probability maps were merged to form one class representing the SC. These modified VBM/VBQ pipelines are able to analyse brain and SC simultaneously and we refer to this as the “Brain+SC” approach and without SC in the analysis as the “Brain-only” approach. These data were analysed voxel-wise in SPM using general linear modelling. To validate our findings on the cord level using new template, MPRAGE images were analysed at level C2/C3 in Jim 6.0 software using an active-surface model in a semi-automatic approach. Microstructural changes at the identical SC level were calculated using in-house MATLAB scripts4 based on nearest neighbour region growing followed by ellipse fitting in MT maps and then superimposed on R1 and R2s maps. The spinal cord parameters were assessed using ANOVA adjusted for age using Stata 13.Results
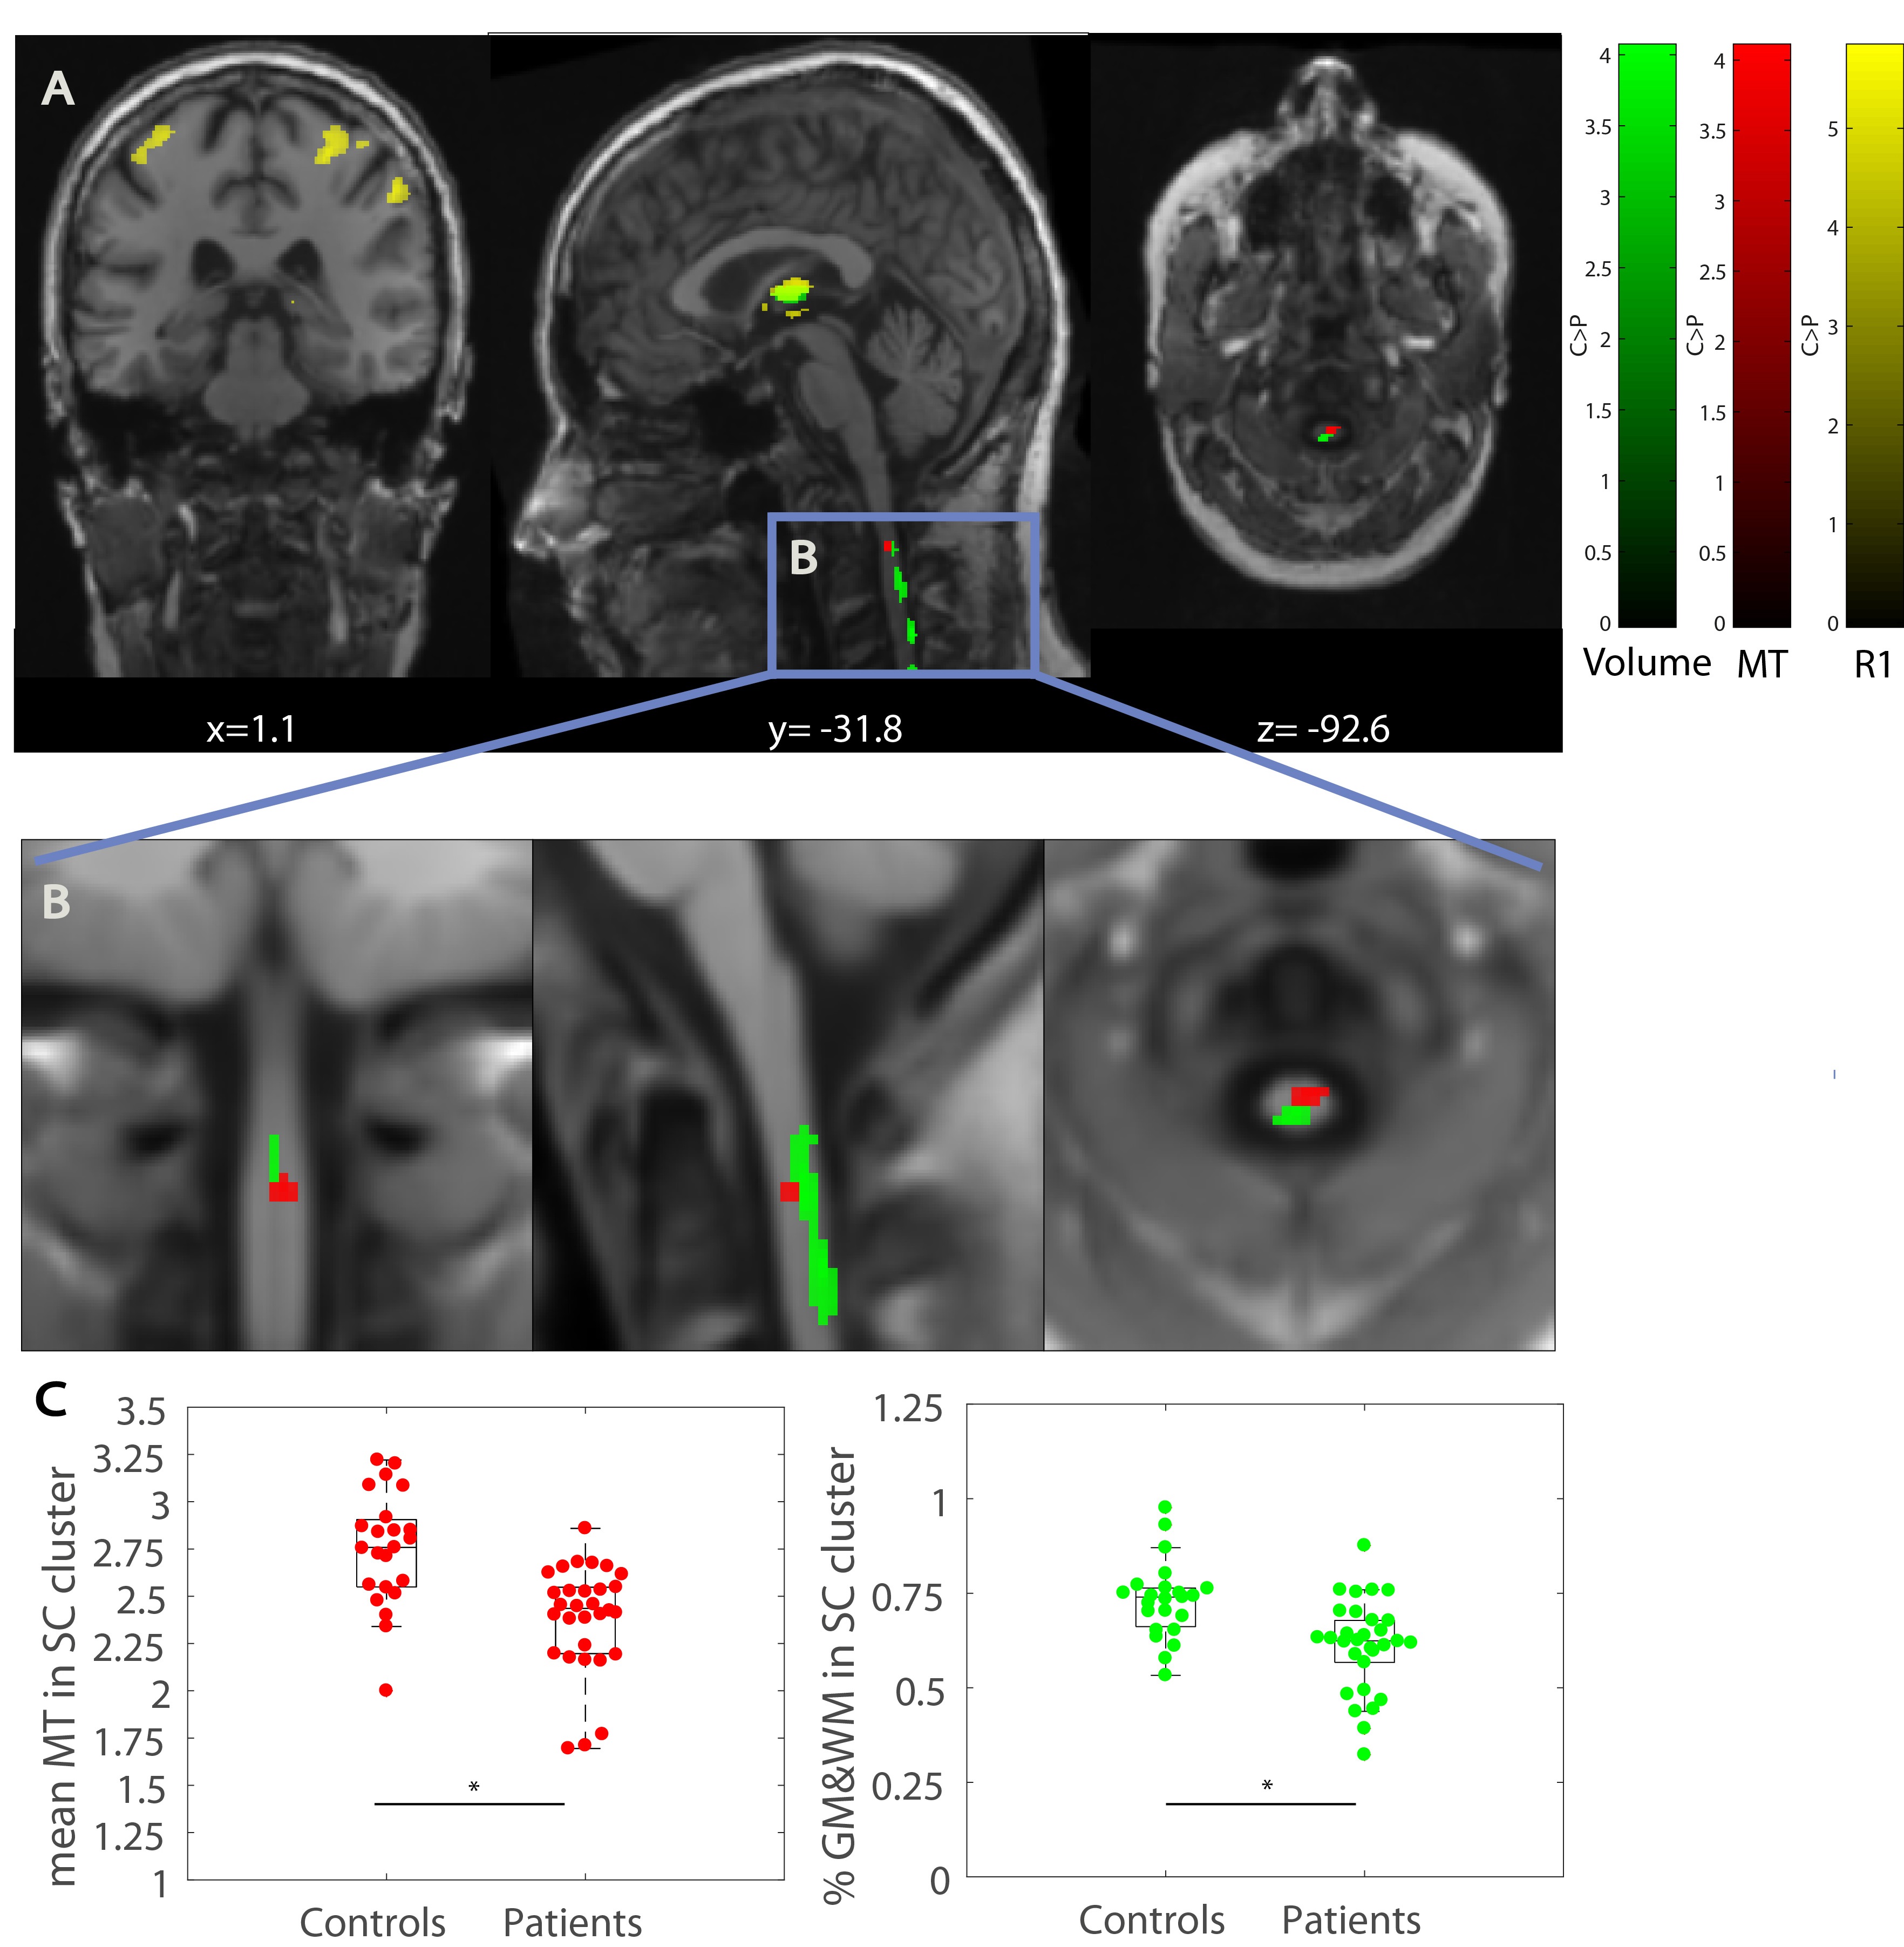
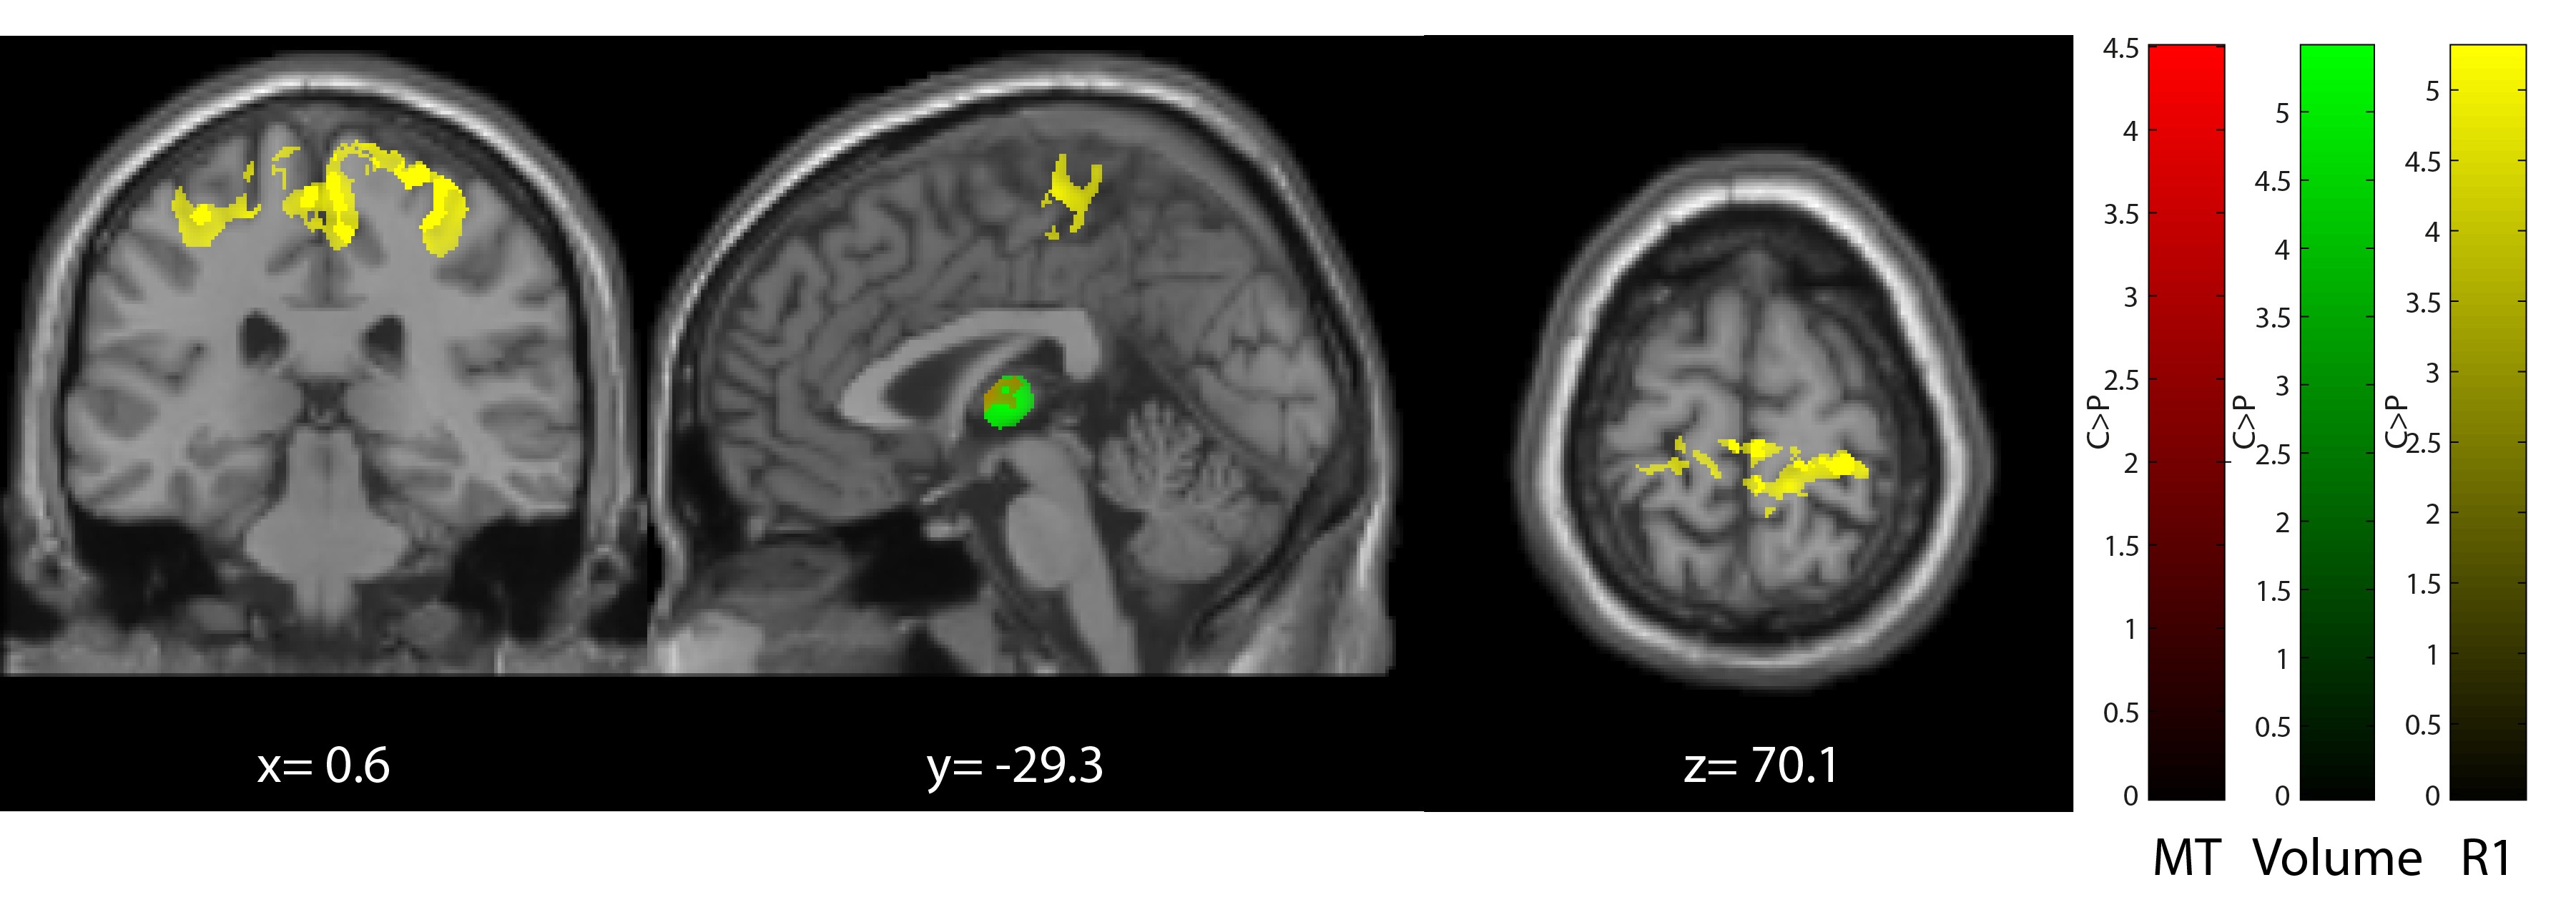
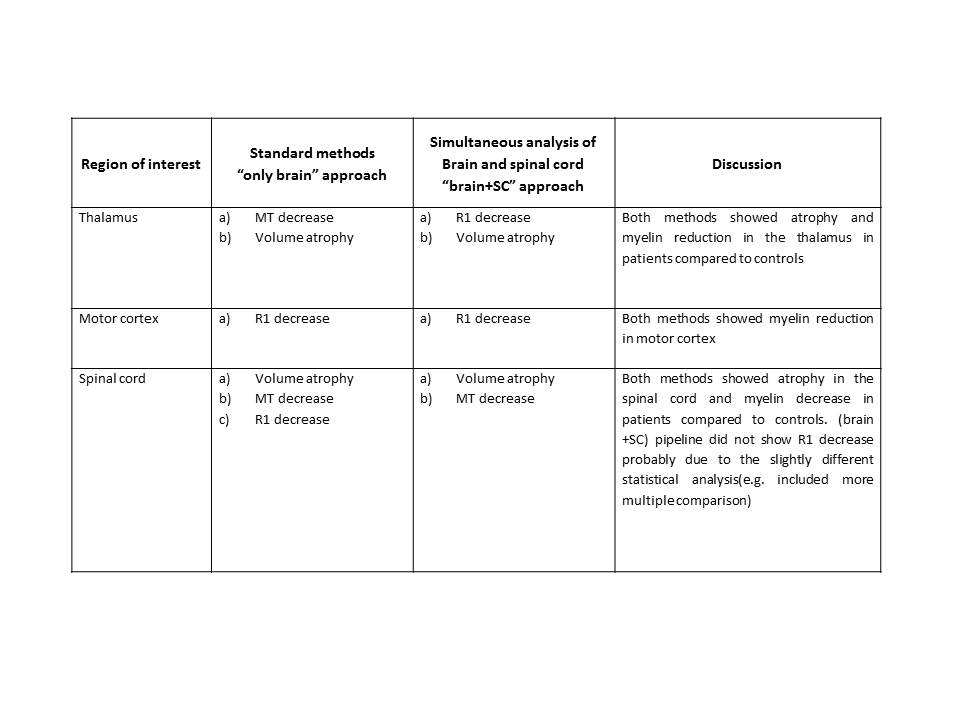
“Brain+SC” approach revealed significant atrophy in left thalamus and reduced myelin-sensitive R1 in bilateral thalamus, bilateral motor cortex and bilateral sub-cortical motor regions in patients compared to controls (Fig.1). Structural changes were shown at the level of the SC reporting atrophy and MT decrease in patient compared to controls at level C2/C3 (Fig. 1). Analysis using “Brain-only” VBM/VBQ pipelines showed similar findings (Fig. 2); as did the Jim-based analysis (Fig. 3). Table 1 provides a comparative summary of findings from the two methods.Discussion
The simultaneous analysis of brain and cervical spinal cord was performed for the first time on SCI in a unique framework including pre-processing and statistics in the same environment. Results in the brain showed SCI-induced atrophy and myelin sensitive decrease in regions affected by the disease which are in line previous reports5. At the cord level (C2/C3), atrophy and reduced myelin sensitive MT are observed in SCI compared to controls. Further Template improvement such as combining high resolution spinal cord images with lower resolution brain MRI could provide a better classification of GM and WM at the SC level. MRI denoising using Gaussian smoothing kernel leads to undesired partial volume effect in the SC, further investigation is needed to address the right smoothing kernel and size in the SC.Conclusion
In this study a new Template incorporating brain and SC was used in VBM/VBQ pre-processing and statistical analyses to assess the interaction across the full CNS. This offers direct implications for future clinical interventions assessing interactions between remote areas thus bringing the novel insights of complex interactions across the entire CNS following a focal CNS injury and beyond. Future application on functional MRI may provide synchronized analysis of brain and cervical SC allowing a better understanding of signals processing and journey from SC to brain.Acknowledgements
This work was supported by the MRC and Spinal Research Charity through the ERA-NET Neuron joint call (MR/R000050/1). The Wellcome Centre for Human Neuroimaging is supported by core funding from the Wellcome [203147/Z/16/Z].References
1. Blaiotta C. Bayesian Generative Learning of Brain and Spinal Cord Templates from Neuroimaging Datasets Thesis submitted in partial fulfilment of the requirements for the degree of Doctor of Philosophy Wellcome Trust Centre for Neuroimaging Institute of Neurology Cont. 2017;(January).
2. Ashburner J, Friston KJ. Why Voxel-Based Morphometry Should Be Used. Neuroimage. 2001;14(6):1238-1243. doi:10.1006/nimg.2001.0961.
3. Weiskopf N, Suckling J, Williams G, et al. Quantitative multi-parameter mapping of R1, PD*, MT, and R2* at 3T: A multi-center validation. Front Neurosci. 2013;7(7 JUN):1-11. doi:10.3389/fnins.2013.00095.
4. Ashburner J, Friston KJ. Unified segmentation. 2005;26:839-851. doi:10.1016/j.neuroimage.2005.02.018.
5. Grabher P, Callaghan MF, Ashburner J, et al. Tracking sensory system atrophy and outcome prediction in spinal cord injury. Ann Neurol. 2015;78(5):751-761. doi:10.1002/ana.24508.
6. Solstrand Dahlberg L, Becerra L, Borsook D, Linnman C. Brain changes after spinal cord injury, a quantitative meta-analysis and review. Neurosci Biobehav Rev. 2018;90(April):272-293. doi:10.1016/j.neubiorev.2018.04.018.
Figures