2877
Feasibility of magnetisation transfer ratio measurements in the proximal lumbar plexus using healthy volunteers at 3T1Queen Square MS Centre, Department of Neuroinflammation, UCL Queen Square Institute of Neurology, Faculty of Brain Sciences, University College London, London, United Kingdom, 2Philips Healthcare, Surrey, United Kingdom, 3Philips Healthcare, Tokyo, Japan, 4Medical Physics and Biomedical Engineering, University College London, London, United Kingdom, 5Universitat Oberta de Catalunya, Barcelona, Spain, 6Brain MRI 3T Research Centre, IRCCS Mondino Foundation, Pavia, Italy, 7Department of Brain and Behavioural Sciences, University of Pavia, Pavia, Italy
Synopsis
Magnetic resonance neurography (MRN) has become a widely used non-invasive tool for assessing the lumbar plexus with application to inflammatory, neoplastic, metabolic and traumatic pathologic conditions. Given that the main pathological process involved in the majority of these neurological conditions results in the alteration of myelin content, this pilot study proposes and demonstrates in healthy controls the feasibility of using MRN to facilitate reliable measurements of magnetisation transfer ratio, a biophysically meaningful MR biomarker, which has been shown to be directly influenced by the amount of myelin in neural tissue.
INTRODUCTION
Magnetic resonance neurography (MRN) has been
used extensively in recent years to study inflammatory, neoplastic, metabolic
and traumatic pathologic conditions affecting the peripheral nervous system1-3.
Typically, tissue damage is assessed qualitatively from these images by
observing changes in the signal intensity and/or cross-sectional area of the peripheral
nerves. However, such observations provide little information regarding the
underlying pathophysiological processes involved in each case, highlighting the
need for using quantitative MRI (qMRI) methods. Given the neuropathological
evidence that demyelination is the main pathophysiological mechanism involved
in the majority of these neurological conditions, the use of a more biophysically
meaningful qMRI biomarker such as magnetisation transfer ratio (MTR), which has
been shown to be directly influenced by the amount of myelin in neural tissue, would be appropriate not only
for aiding the diagnosis but potentially guiding appropriate therapeutic
interventions. This pilot study in healthy
controls demonstrates the feasibility of using MRN to facilitate reliable
measurements of MTR in the proximal lumbar plexus, opening up the possibilities
to study a broad spectrum of neurological conditions in vivo.METHOD
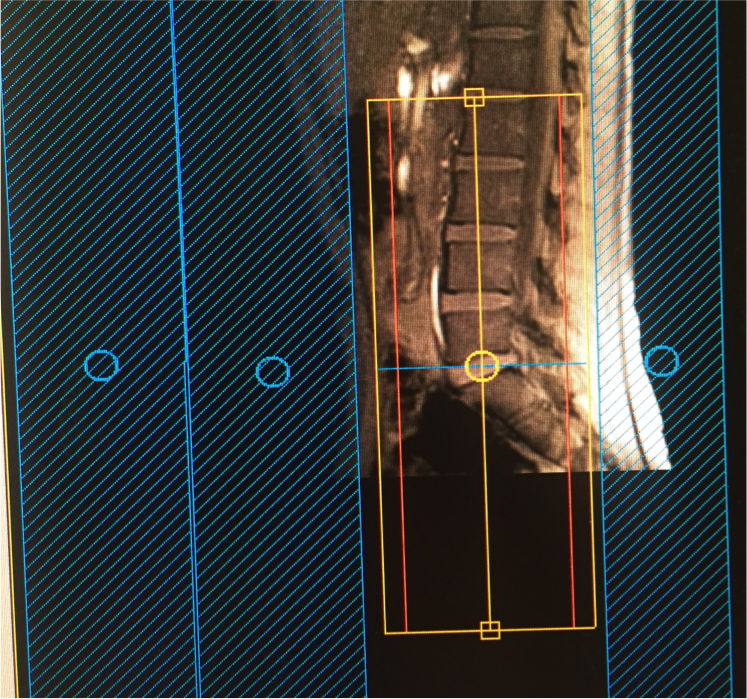
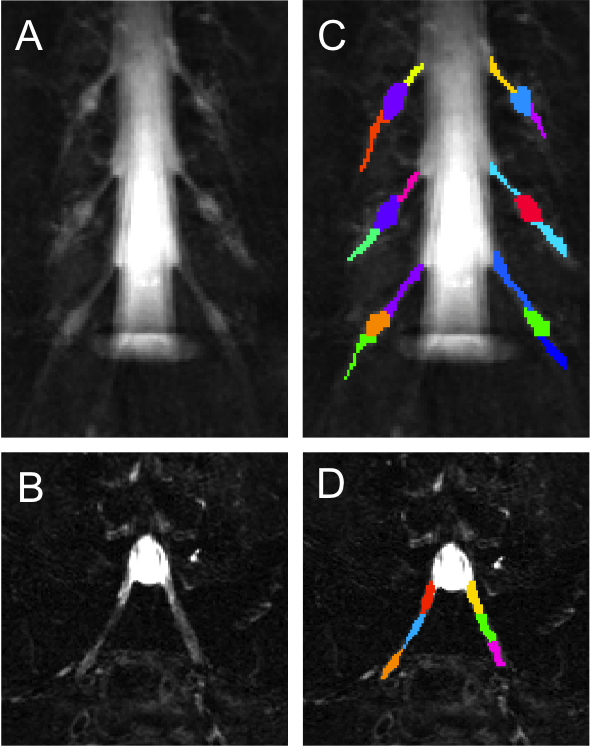
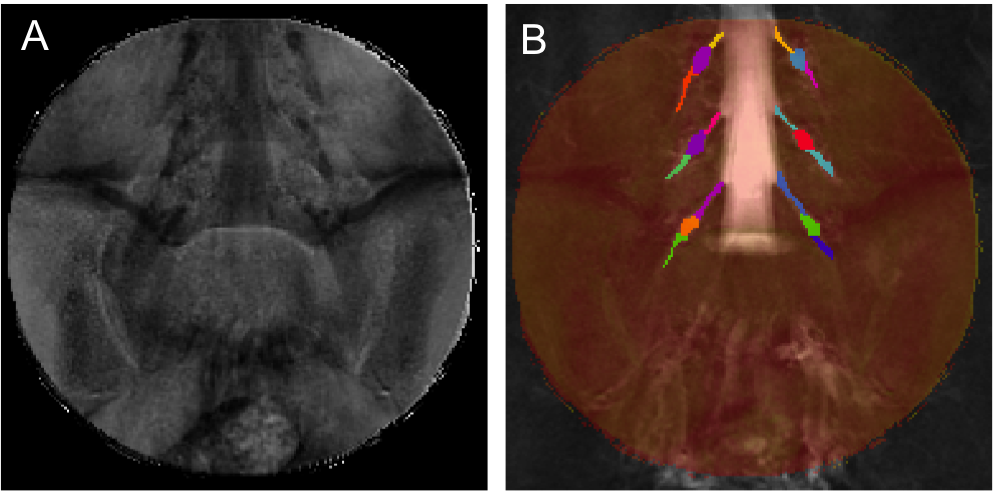
1) Participants: 5 healthy controls were recruited (mean age 39 years, 2 female, range 29-60). Informed consent was obtained from all participants and the study was approved by local ethics; 2) MR imaging: Using a Philips Achieva 3T and the product 15-channel SENSE spine coil, the lumbosacral spine was imaged coronally using the 3D SHINKEI sequence4,5, as follows: TR = 2500 ms; TE = 192 ms, FOV = 180 × 180 mm2, voxel size = 1 x 1 x 1 mm3, number of averages = 2, TSE factor = 100, iMSDE duration = 50 ms, 81 slices, scanning time of 10:20 min. The imaging volume was positioned at the superior margin of the L2 vertebral body with the volume extending caudally towards the sacral segments, to ensure coverage of L2-L5 segments in all subjects (Figure 1); an example image is shown in Figure 2A and 2B. MTR imaging was performed using identical scan geometry to the SHINKEI acquisition as follows: 3D FFE dual-echo ‘stack of stars’ (TR / TE1 / TE2 = 36 / 1.56 / 2.7 ms; flip angle α = 10°), with and without Sinc - Gaussian shaped MT saturation pulses with nominal α = 360°; offset frequency = 1 KHz, and duration 16 ms; number of slices = 81; FOV = 180 x 180 mm2; voxel size = 1 x 1 x 1 mm3; scanning time of 10:45 min. In order to assess scan-rescan reproducibility, all volunteers underwent the same scans twice with a minimum of 1 week gap between each scan; 3) Image analysis: Image segmentation was performed manually in FSLview (http://www.fmrib.ox.ac.uk/fsl/) using the SHINKEI images. For each lumbar segment (L2-L5), annotated binary masks were used to distinguish between the proximal nerve root (PNR), the dorsal root ganglion (DRG) and the distal nerve root (DNR) regions (Figure 2C and 2D). All MTR volumes were registered to their respective SHINKEI volumes using affine registration with NiftyReg6; an example of a MTR map is shown in Figure 3. 4) Statistical analysis: Statistical analysis was performed using SPSS 24.0 (SPSS, Chicago, Ill., USA). Firstly, differences in MTR values between the left and right lumbar segments were investigated using paired t-tests. For the assessment of scan-rescan reproducibility of the MTR measures, the coefficient of variation (COV) was calculated using the mean and standard deviation from the repeated measures and the equation COV = [SD/mean] × 100%. Differences in MTR values between PNR, DRG and DNR regions in each individual lumbar segment were investigated using one-way analysis of variance (ANOVA).RESULTS
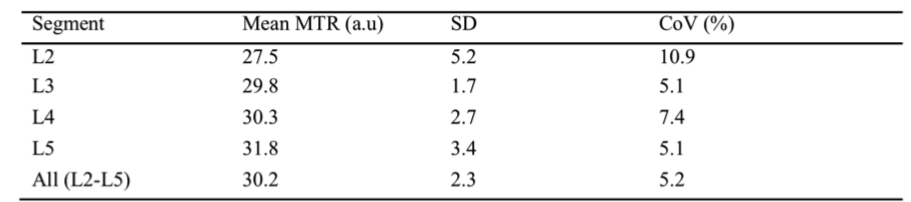
Paired t-tests revealed no significant differences in MTR values between left/right lumbar segments. As such, all subsequent analyses were performed in the right lumbar segments only. Table 1 shows the mean (SD) MTR measures and COV values obtained in each lumbar segment on the right side. Using one-way ANOVA, a statistically significant difference in MTR was identified between the PNR and DNR regions but no difference was identified between any of the other regions.DISCUSSION AND CONCLUSION
In this pilot study we have demonstrated the feasibility of obtaining reliable MTR measures in the proximal lumbar plexus providing a first report of normative values. Additionally, we have established that no significant differences in MTR (i.e. myelin content) exist between left/right lumbar segments, although significant differences exist between the PNR and DNR regions suggesting a difference in myelin content in these regions. Future investigations using a larger sample population will be required to confirm the results presented in this pilot study.Acknowledgements
The UK MS Society and the UCL-UCLH Biomedical Research Centre for ongoing support. CGWK receives funding from ISRT, Wings for Life and the Craig H. Neilsen Foundation (the INSPIRED study), from the MS Society (#77), Wings for Life (#169111), Horizon2020 (CDS-QUAMRI, #634541). FP is a non-clinical Postdoctoral Guarantors of Brain fellow.References
1) Pham M, Bäumer T, Bendszus M. Peripheral nerves and plexus: imaging by MR-neurography and high-resolution ultrasound. Curr Opin Neurol. 2014;27(4):370-9.
2) Chhabra A, Belzberg AJ, Rosson GD, et al. Impact of high resolution 3 tesla MR neurography (MRN) on diagnostic thinking and therapeutic patient management. Eur Radiol. 2016;26(5):1235-44.
3) Kollmer J, Bendszus M, Pham M. MR Neurography: diagnostic imaging in PNS. Clin Neuroradiol. 2015;25(Suppl 2):283-9.
4) Yoneyama M, Takahara T, Kwee T.C, et al. Rapid high resolution MR neurography with a diffusion-weighted pre-pulse, Magn. Reson. Med. Sci. 2013;12(2):111–119.
5) Kasper J.M, Wadhwa V, Scott K.M, et al. SHINKEI-a novel 3D isotropic MR neurography technique: technical advantages over 3DIRTSE-based imaging, Eur. Radiol. 2015;25(6):1672–1677.
6) Modat M, Cash DM, Daga P, et al. Global image registration using a symmetric block-matching approach. J Med Imaging (Bellingham). 2014;1(2):024003.
Figures