2875
AREX (Apparent Exchange-Dependent Relaxation Rate) CEST MRI in the Spinal Cord at 3T: Application to Multiple Sclerosis1Department of Biomedical Engineering, Vanderbilt University, Nashville, TN, United States, 2Vanderbilt University Institute of Imaging Science, Nashville, TN, United States, 3Phillips Healthcare, Baltimore, MD, United States, 4Department of Neurology, Vanderbilt University, Nashville, TN, United States, 5Department of Radiology and Radiological Science, Vanderbilt University, Nashville, TN, United States
Synopsis
In this study, we evaluated AREX(apparent exchange-dependent relaxation rate) in the human spinal cord in patients with MS. Current clinical MRI is insensitive to biochemical changes which may precede inflammatory lesions in the spinal cord. Development of an MRI biomarker capable of detecting tissue changes prior to lesion formation would improve our diagnostic and prognostic capabilities. APT CEST is an MRI contrast approach sensitive to protein and peptide concentration and AREX removes magnetization transfer, T1-relaxation, and RF-spillover effects. Our results suggest that AREX is an improvement over alternative methods and may increase sensitivity to pathological changes in the spinal cord.
Introduction
In multiple sclerosis (MS), damage to the spinal cord often results in significant neurological dysfunction affecting patients in their day-to-day lives [1]. MRI is ubiquitously used to detect lesions within the spinal cord of MS patients, however, current clinical scans are insensitive to biochemical changes which may precede inflammatory lesions. Development of an MRI biomarker capable of detecting tissue changes prior to lesion formation would improve our diagnostic and prognostic capabilities while also increasing our understanding of MS disease pathology. Amide proton transfer (APT) chemical exchange saturation transfer (CEST) is an MRI contrast approach reliant on the transfer of spin information from the protons of mobile solutes to the surrounding water. APT CEST has shown sensitivity to protein and peptide concentration, as well as tissue pH [2]. Endogenous CEST effects are difficult to consistently quantify due to influences by a number of confounding factors, including contributions from magnetization transfer components, RF-spillover, and changes to T1-relaxation. This is especially true in MS where T1 is known to change in damaged tissue. Recently, a quantification method has been developed which is said to correct for these extraneous influences, known as apparent exchange-dependent relaxation rate, or AREX [3]. In this study, we sought to evaluate the sensitivity of AREX to tissue changes in MS patients through a cross-cohort analysis.Methods
Six healthy volunteers (2M/4F, 39±12 years of age) and eleven MS patients (3M/8F, 46±10 years of age, 10 RRMS/1 PPMS) were recruited for the study after informed consent. A 3T whole body scanner (Philips, Best, The Netherlands) and a 16-channel sensitivity encoding (SENSE) neurovascular coil were used to acquire all images. We acquired a single slice between the C3 and C4 vertebrae. All images were registered to a multi-slice, multi-echo gradient echo (mFFE) prior to analysis. A WASSR sequence was performed for B0 field correction. The CEST sequence consisted of a single 150ms 2µT saturation pulse acquired at 36 asymmetric offset frequencies between ±5 ppm and corrected for respiration according to By et al [4]. Additional parameters include: FOV=160mm x 160mm, voxel size=1mm x 1mm, SENSE=2(RL), TR/TE=305/12ms, α=20°, NSA=5. T1 mapping for AREX calculation was done using a multi flip angle sequence. Additional parameters include: FOV=160mm x 160mm, voxel size=1.5mm x 1.5mm, TR/TE=20/4.6ms, α=5,15,20,25,30°. All analysis was performed in Matlab (Mathworks, Nattick, MA). Regions of interest for white matter and lesions were identified using the anatomical reference (mFFE). AREX and MTR asymmetry were calculated at 3.5 ppm, and a variation on AREX, which we will call AREXint, represents a summation of the AREX values over a range of offset frequencies from 3.2 to 3.8 ppm.Results
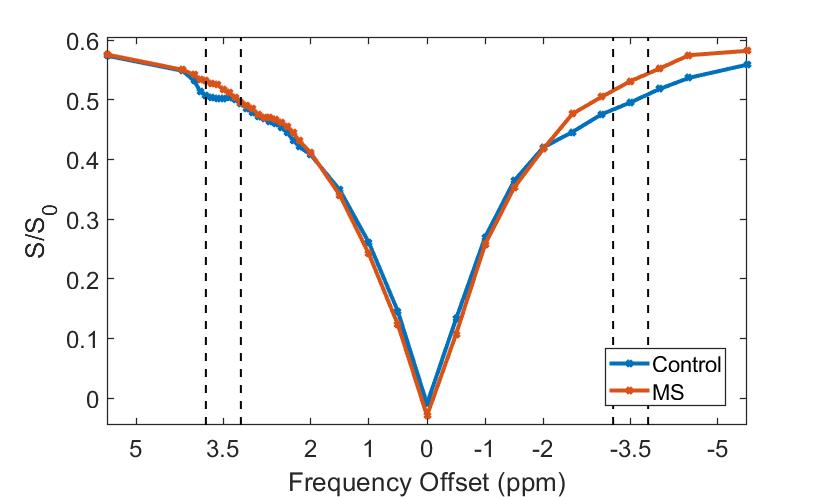
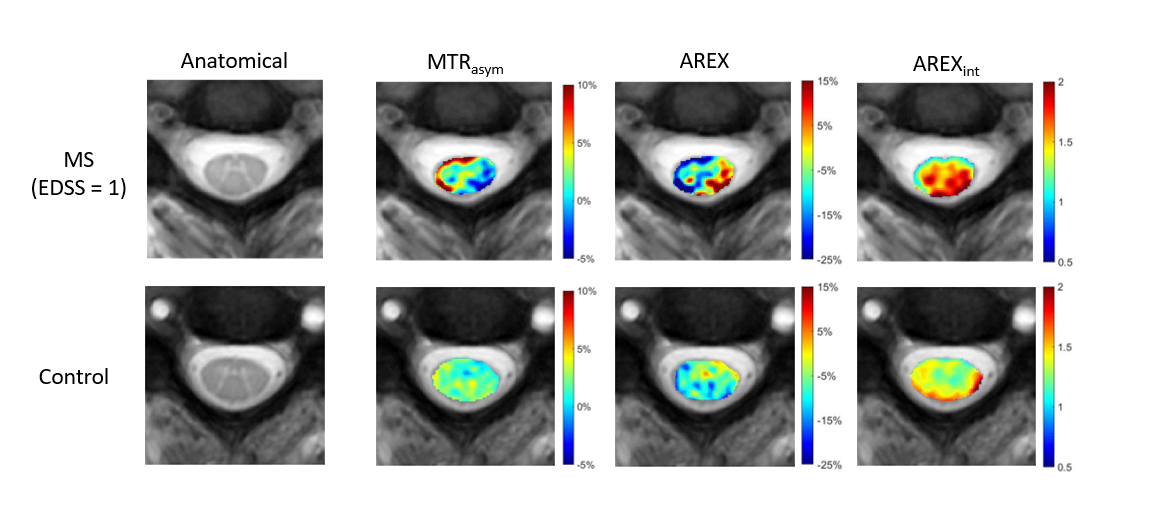
Mean Z spectrum shows a decrease in the CEST effect at the frequency range of interest when compared to healthy controls (Fig. 1). In the MS patients, the upfield arm of the z-spectrum shows a decrease in NOE/MT effect resulting in an increase in the signal. This is important as in MS, it is understood that semisolid components of tissue are lost during the disease reducing the NOE/MT contribution to the z-spectrum. We observed an overall increase in both AREX and AREXint in the MS group when compared to healthy controls. Figure 2 shows maps for each calculated index in a representative MS with minimal disability (EDSS = 1) and healthy volunteer. Distinct contrast variations can be observed in each of the CEST metrics that are not visible in the anatomical image. The CEST effect in the left lateral column of the MS patient increases between scans which is further highlighted when correcting for T1. When integrating over the frequency range, the apparent damage to the spinal cord in the MS patient becomes clear.Discussion
Our results suggest that AREX quantification, and its removal of T1 changes across patient populations, is an improvement over CEST asymmetry and appears to highlight tissue damage in mildly impaired MS patients more-so than conventional MRI alone. The change in upfield saturation in the MS Z spectrum, likely due to reduced MT effects in MS patients, warrants further investigation, as contributions from NOE and MT are poorly understood and may influence our quantification methods. The sensitivity to mildly affected MS patients is critical to understanding the disease evolution, and AREX sensitivity to change over time will be further examined in these patients. We propose that MR imaging sensitive to exchange opens the door for exploring the spinal cord in disease, especially where inflammation plays less of a role in overall disability than does tissue microstructure and molecular damage.Acknowledgements
National MS Society Conrad Hilton Foundation R21 (NIH/NINDS 1R21NS087465-01)References
1. Popescu, B.F.G., I. Pirko, and C.F. Lucchinetti, Pathology of multiple sclerosis: where do we stand? Continuum (Minneapolis, Minn.), 2013. 19(4 Multiple Sclerosis): p. 901-921.
2. Zhou, J., et al., Using the amide proton signals of intracellular proteins and peptides to detect pH effects in MRI. Nat Med, 2003. 9(8): p. 1085-90.
3. Zaiss, M., et al., Inverse Z-spectrum analysis for spillover-, MT-, and T1-corrected steady-state pulsed CEST-MRI – application to pH-weighted MRI of acute stroke. 2014. 27(3): p. 240-252.
4. By, S., et al., Amide proton transfer CEST of the cervical spinal cord in multiple sclerosis patients at 3T. Magn Reson Med, 2018. 79(2): p. 806-814.
Figures