2872
MRI investigation of neurodegeneration in subacute SCI and its relation to functional outcome1Spinal Cord Injury Center Balgrist, University Hospital Zurich, University of Zurich, Zurich, Switzerland, 2Department of Neurophysics, Max Planck Institute for Human Cognitive and Brain Sciences, Leipzig, Germany, 3Wellcome Trust Centre for Neuroimaging, UCL Institute of Neurology, London, United Kingdom
Synopsis
In this study, for the first time, we performed voxel- and atlas-based DTI analysis along with high-resolution T2*-weighted imaging in subacute spinal cord injury (SCI) to investigate early micro- and macrostructural changes remote from the injury at C2/C3. Thereby, we aimed to test the predictive ability of early tract-specific degeneration for the chronic functional outcome. DTI and tissue area measurements between SCI patients and controls revealed demyelination in the dorsal columns, indicative of early anterograde degeneration of sensory tracts. Importantly, these early microstructural changes predicted 1-year functional recovery, demonstrating the clinical eloquence of early DTI measurements as a prognostic tool.
Introduction
Although our knowledge on traumatic spinal cord injury (SCI) has improved dramatically over the past decades, still little is known about the degenerative changes occurring remote from the injury1. Experimental studies revealed early anterograde degeneration and subsequent retrograde degeneration of the sensory and motor tracts above and below the injury site2. However, these changes are yet to be shown in-vivo in subacute SCI patients.
Diffusion Tensor Imaging (DTI) has demonstrated great potential to detect white matter alterations during development and in pathological conditions3. While the vast majority of DTI studies are performed in the brain, recent developments in the imaging protocol and post-processing have made the adoption of DTI to the spinal cord possible4.
In this study, we applied spinal cord DTI along with T2*-weighted structural imaging to investigate above-level micro- and macrostructural changes at C2/C3 in subacute SCI patients. Compared to previous investigations involving acute/subacute SCI patients, our study benefitted from the enhanced spatial specificity allowed by tract- and voxel-based analysis, enabling us to probe the integrity of white matter in a tract-specific way. This allowed us, for the first time, to test the prognostic value of early, tract-specific DTI measurements for the 1-year functional recovery.
Methods
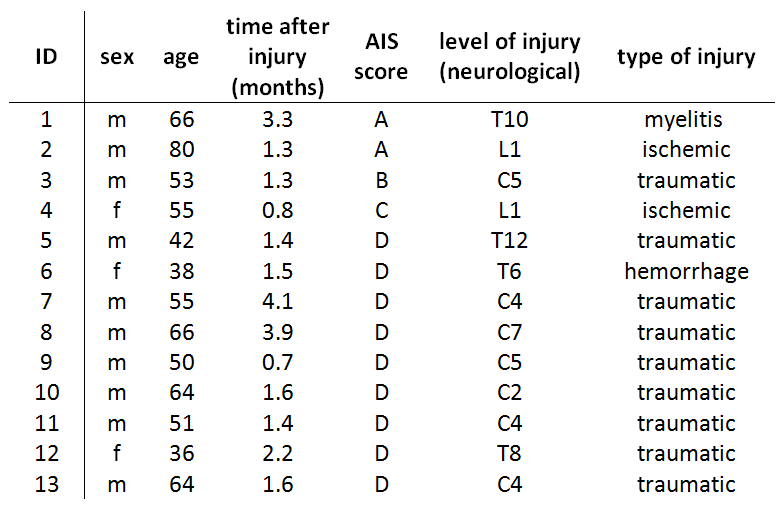
A total of 13 SCI patients (3 females, age (mean±std): 55.4±12.6 years) and 13 controls (3 females, age: 43.8±16.9 years) were scanned on a 3T Siemens SkyraFit system. Patients were scanned an average (±std) of 1.9±1.1 months after injury (Fig. 1). The functional outcome of the patients at 1 year was assessed using the ISNCSCI protocol5.
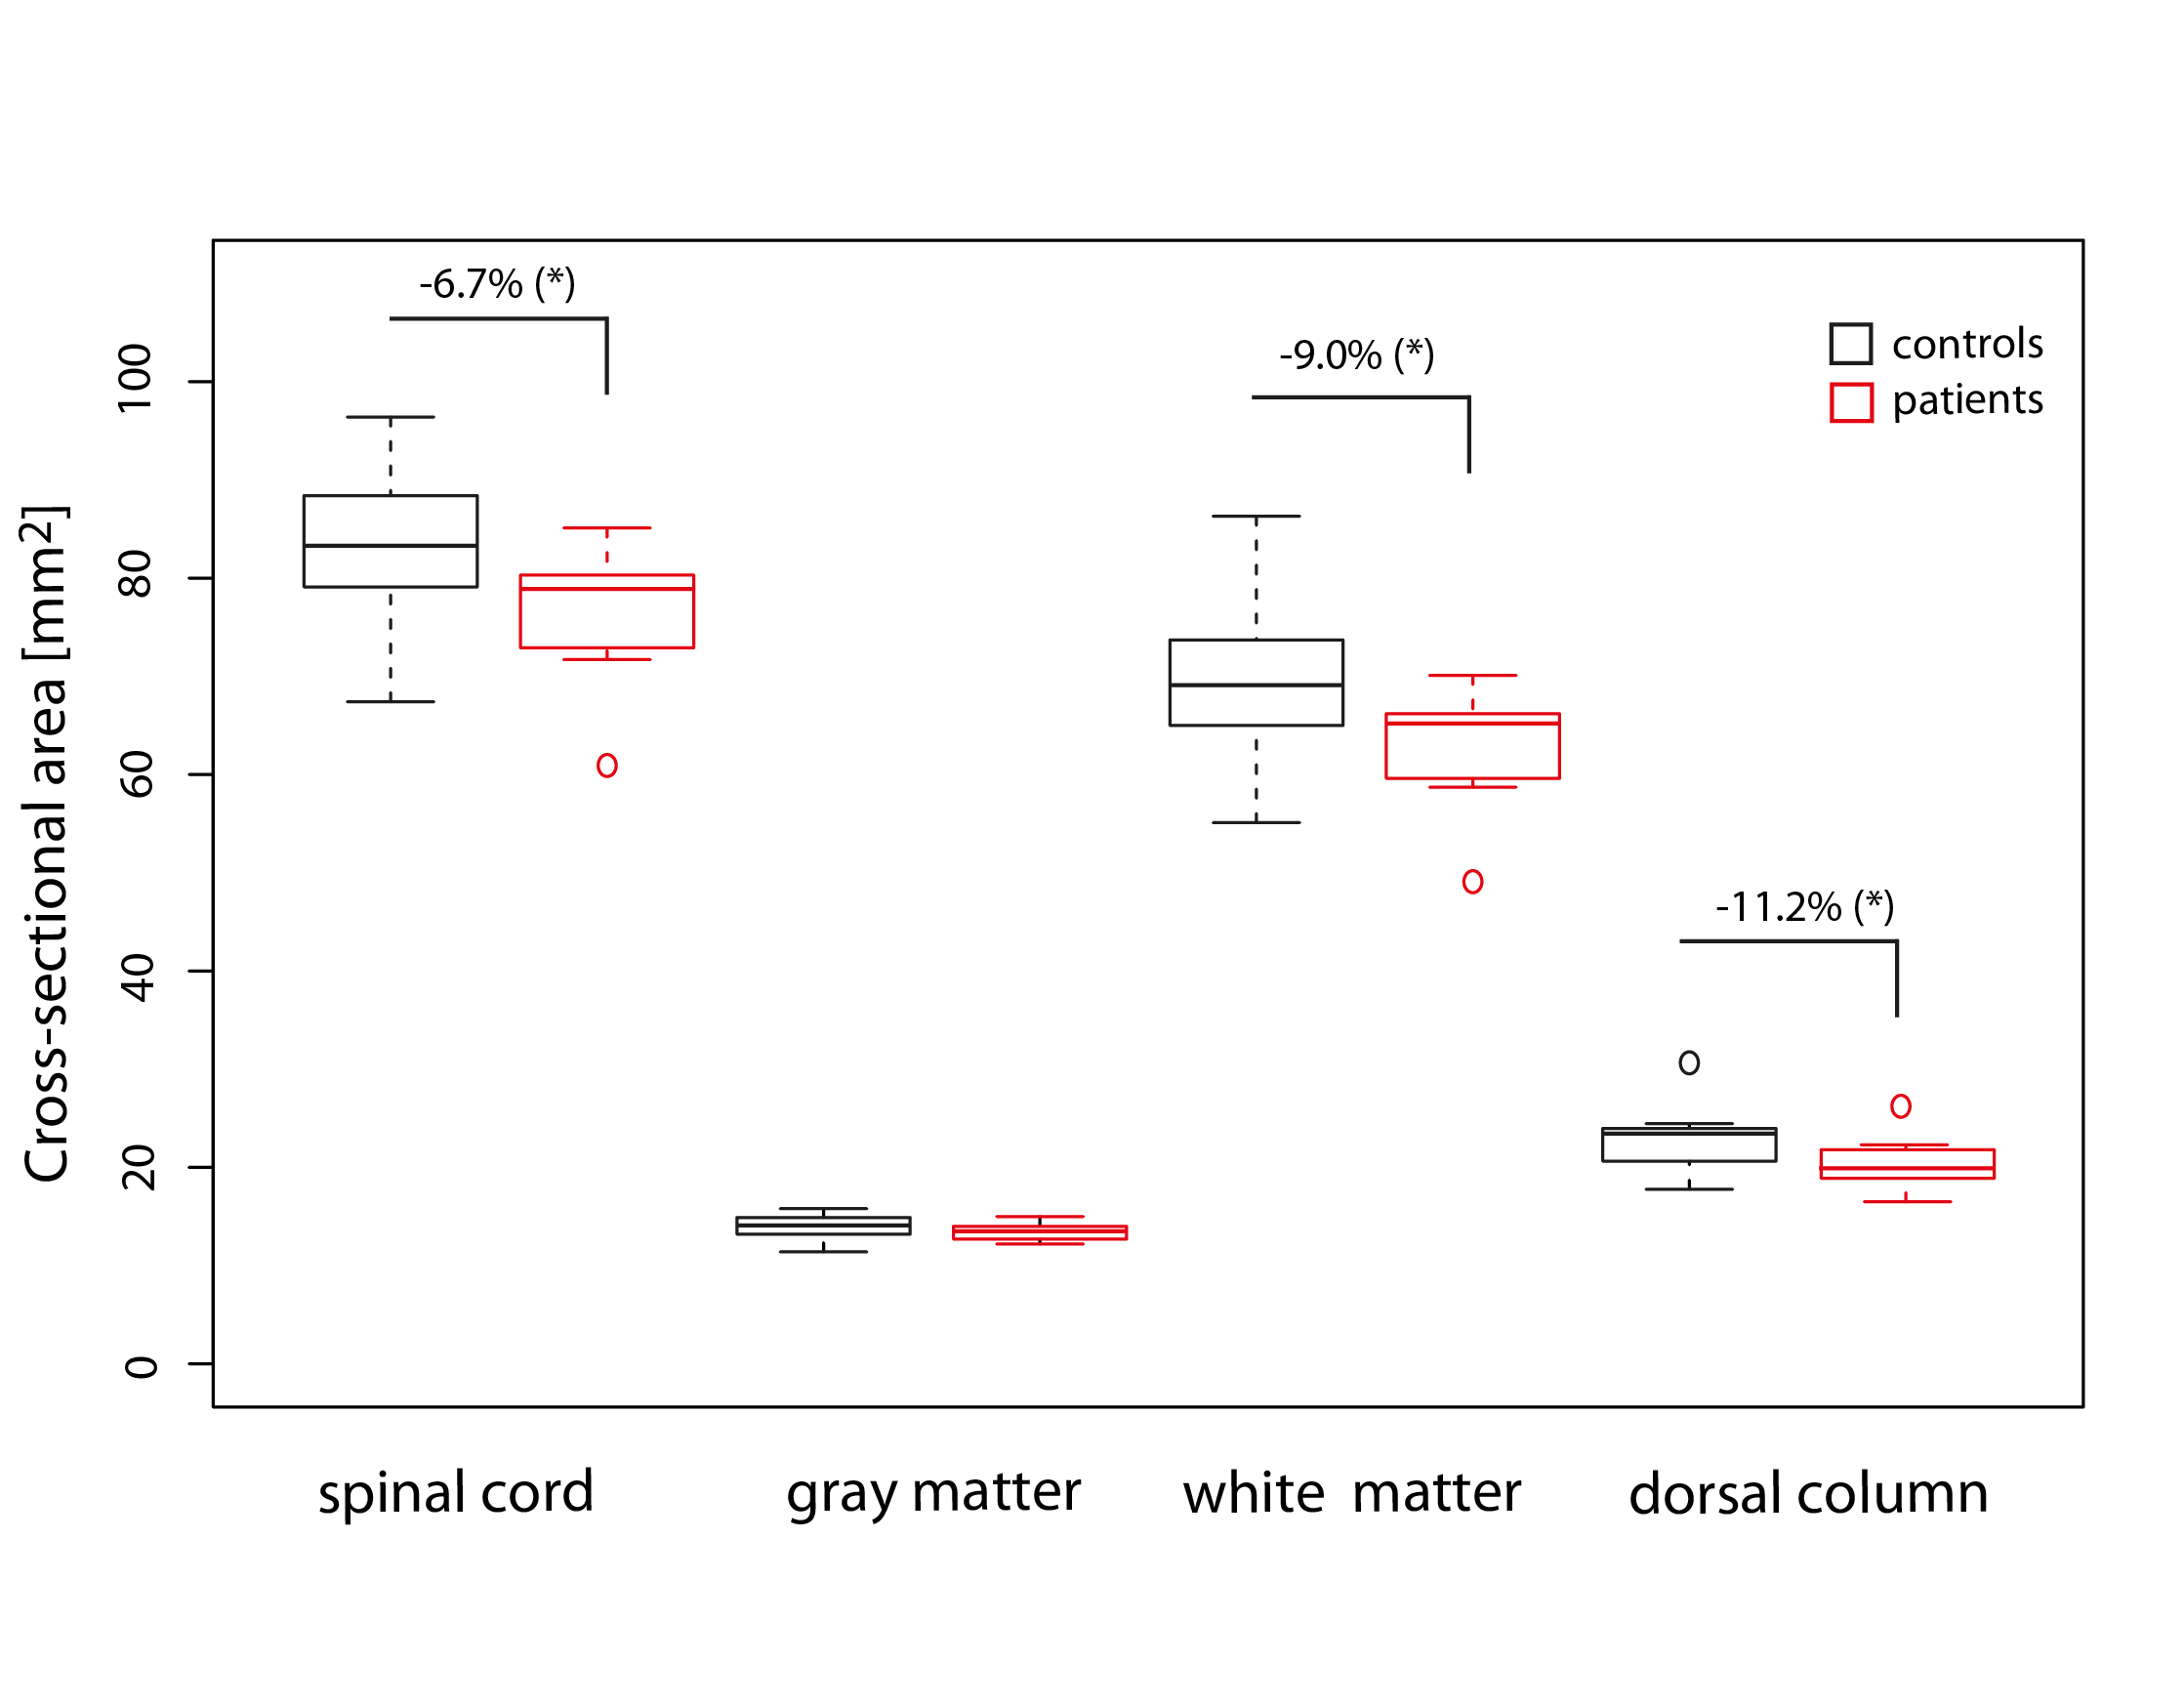
A T2*-weighted 3D multi-echo spoiled GRE image (Siemens MEDIC sequence) was acquired in the axial-oblique plane, centered at the lower edge of C2/C3 intervertebral disk. Following parameters were used: 10 slices, resolution=0.5x0.5x5mm3, FOV=192x162mm2, TE=19ms, TR=44ms, flip angle=11°, acquisition time=7:16min, 4 averages. The averaged image was segmented for spinal cord (SC) and gray matter (GM) using the sct_deepseg_sc and sct_deepseg_gm algorithms of Spinal Cord Toolbox (SCT)6. Based on these segmentations, cross-sectional areas of SC (SCA), GM (GMA), WM (WMA), and DC (DCA) averaged across slices were calculated.
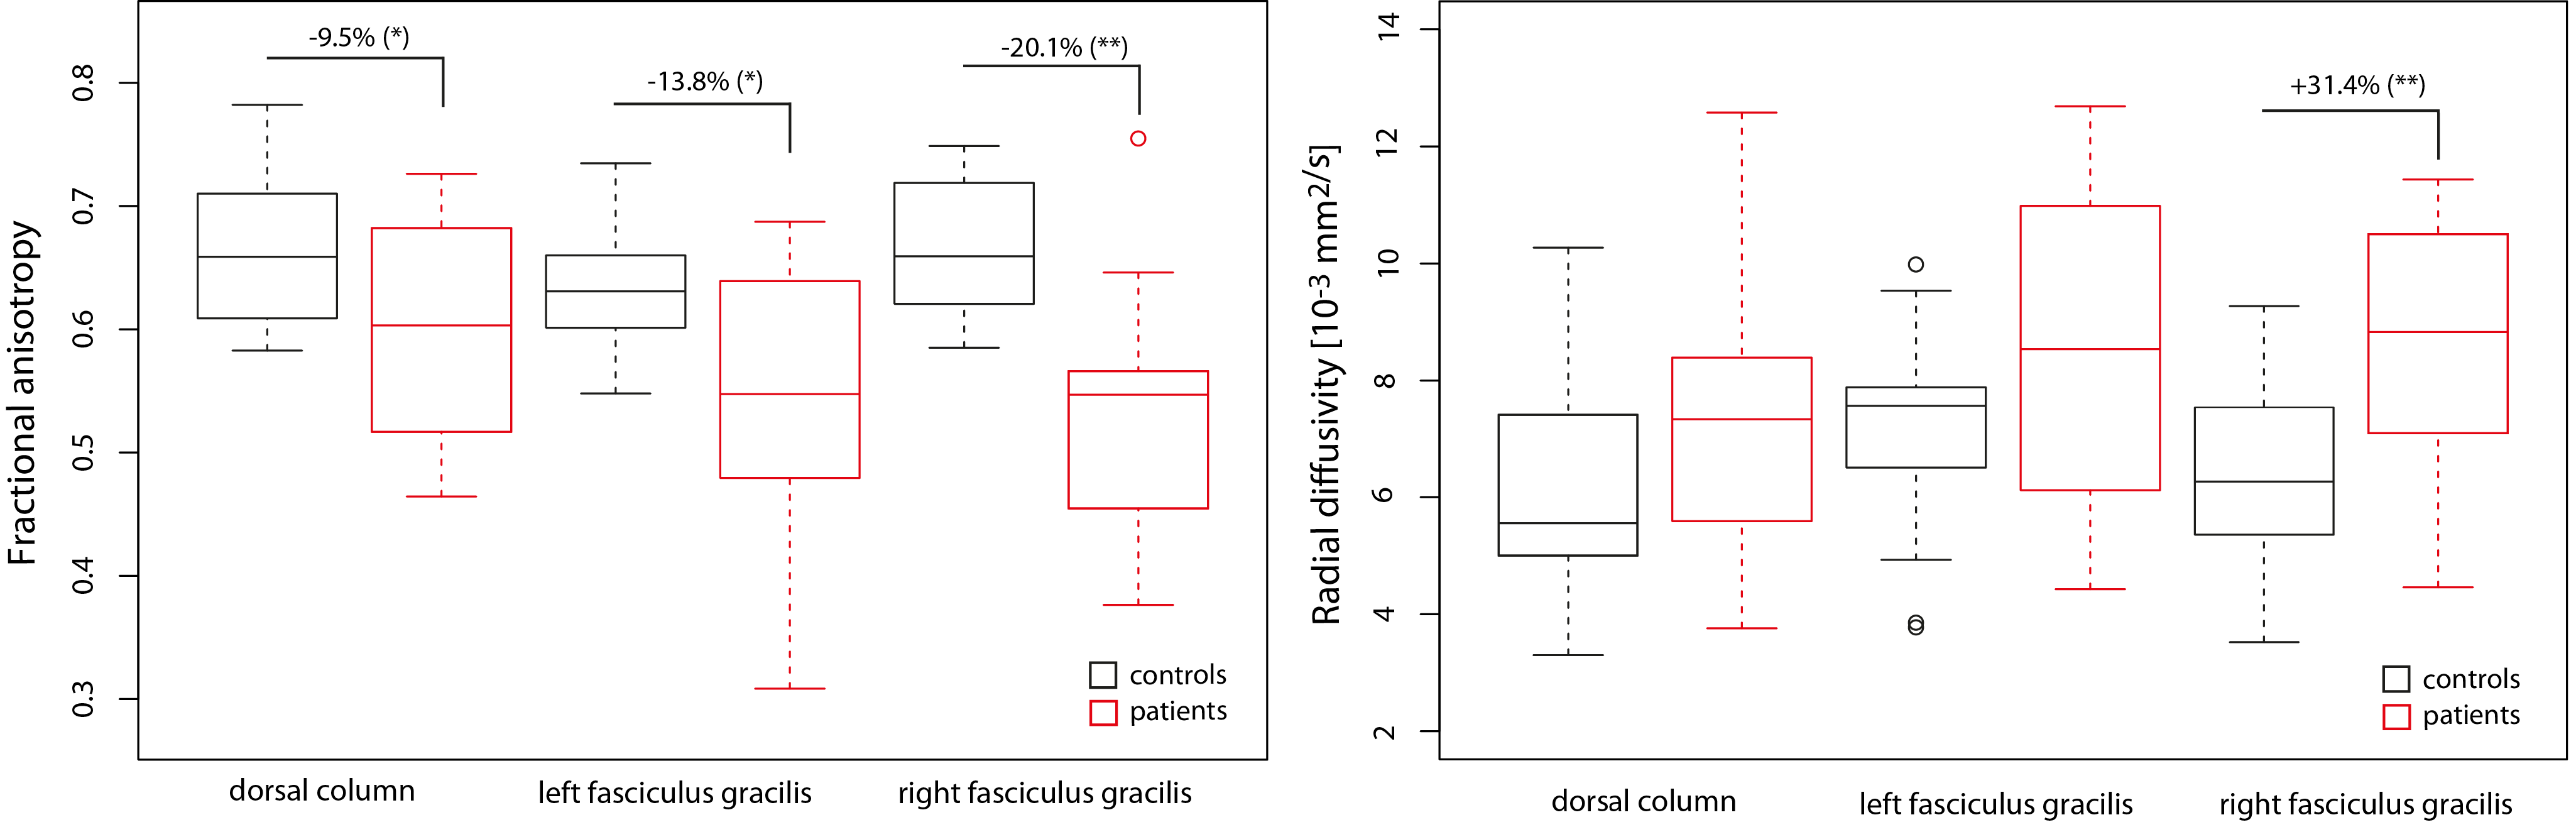
The Diffusion Tensor Imaging (DTI) dataset was acquired using a cardiac-gated reduced-FOV single-shot spin-echo EPI sequence with identical slice prescription, and consisting of 60 diffusion-weighted (b=500s/mm2) and 7 T2-weighted (b=0s/mm2) images. Acquisition parameters were: resolution=0.76x0.76x5mm3, FOV=133x30mm2, TE=73ms, TR=350ms. The acquisition time was approximately 8min. After artifact correction, DTI scalar maps including fractional anisotropy (FA), mean diffusivity (MD), axial (AD) and radial diffusivity (RD) were obtained using the robust fitting algorithm in the ACID toolbox7. Subsequently, the DTI dataset was normalized to the PAM50 template using SCT8. Finally, an atlas-based analysis was performed to extract mean values from WM tracts.
Group-level differences of cross-sectional areas and DTI metrics were assessed using two-sample t-test (one-tailed, α=0.05). DTI metrics were compared voxel-wise using SPM, where p-values were corrected for multiple comparisons at a familywise-error rate of 0.05. Associations between cross-sectional areas, DTI metrics, and 1-year outcomes were assessed using Pearson’s linear correlation coefficient (p<0.05).
Results
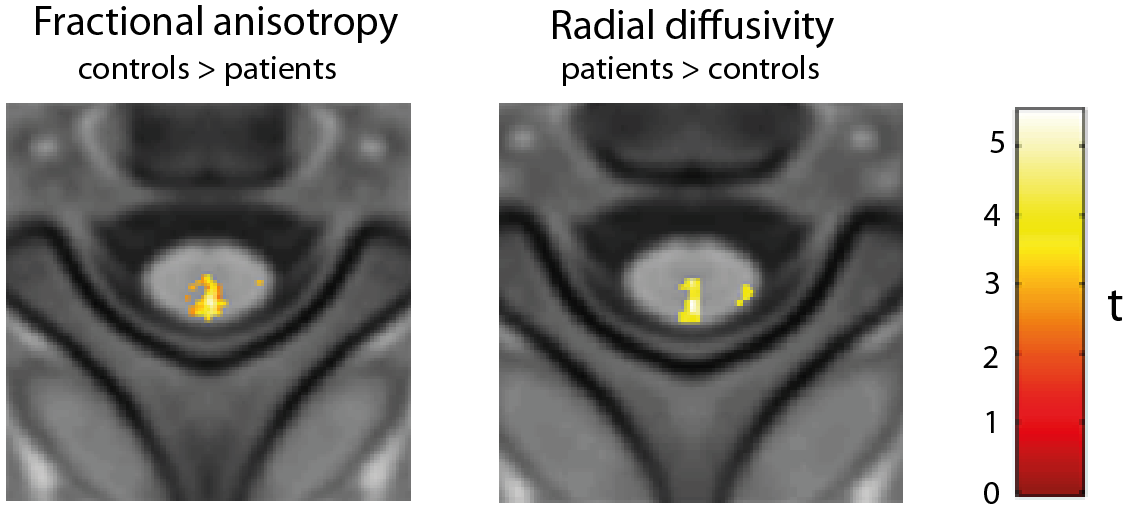
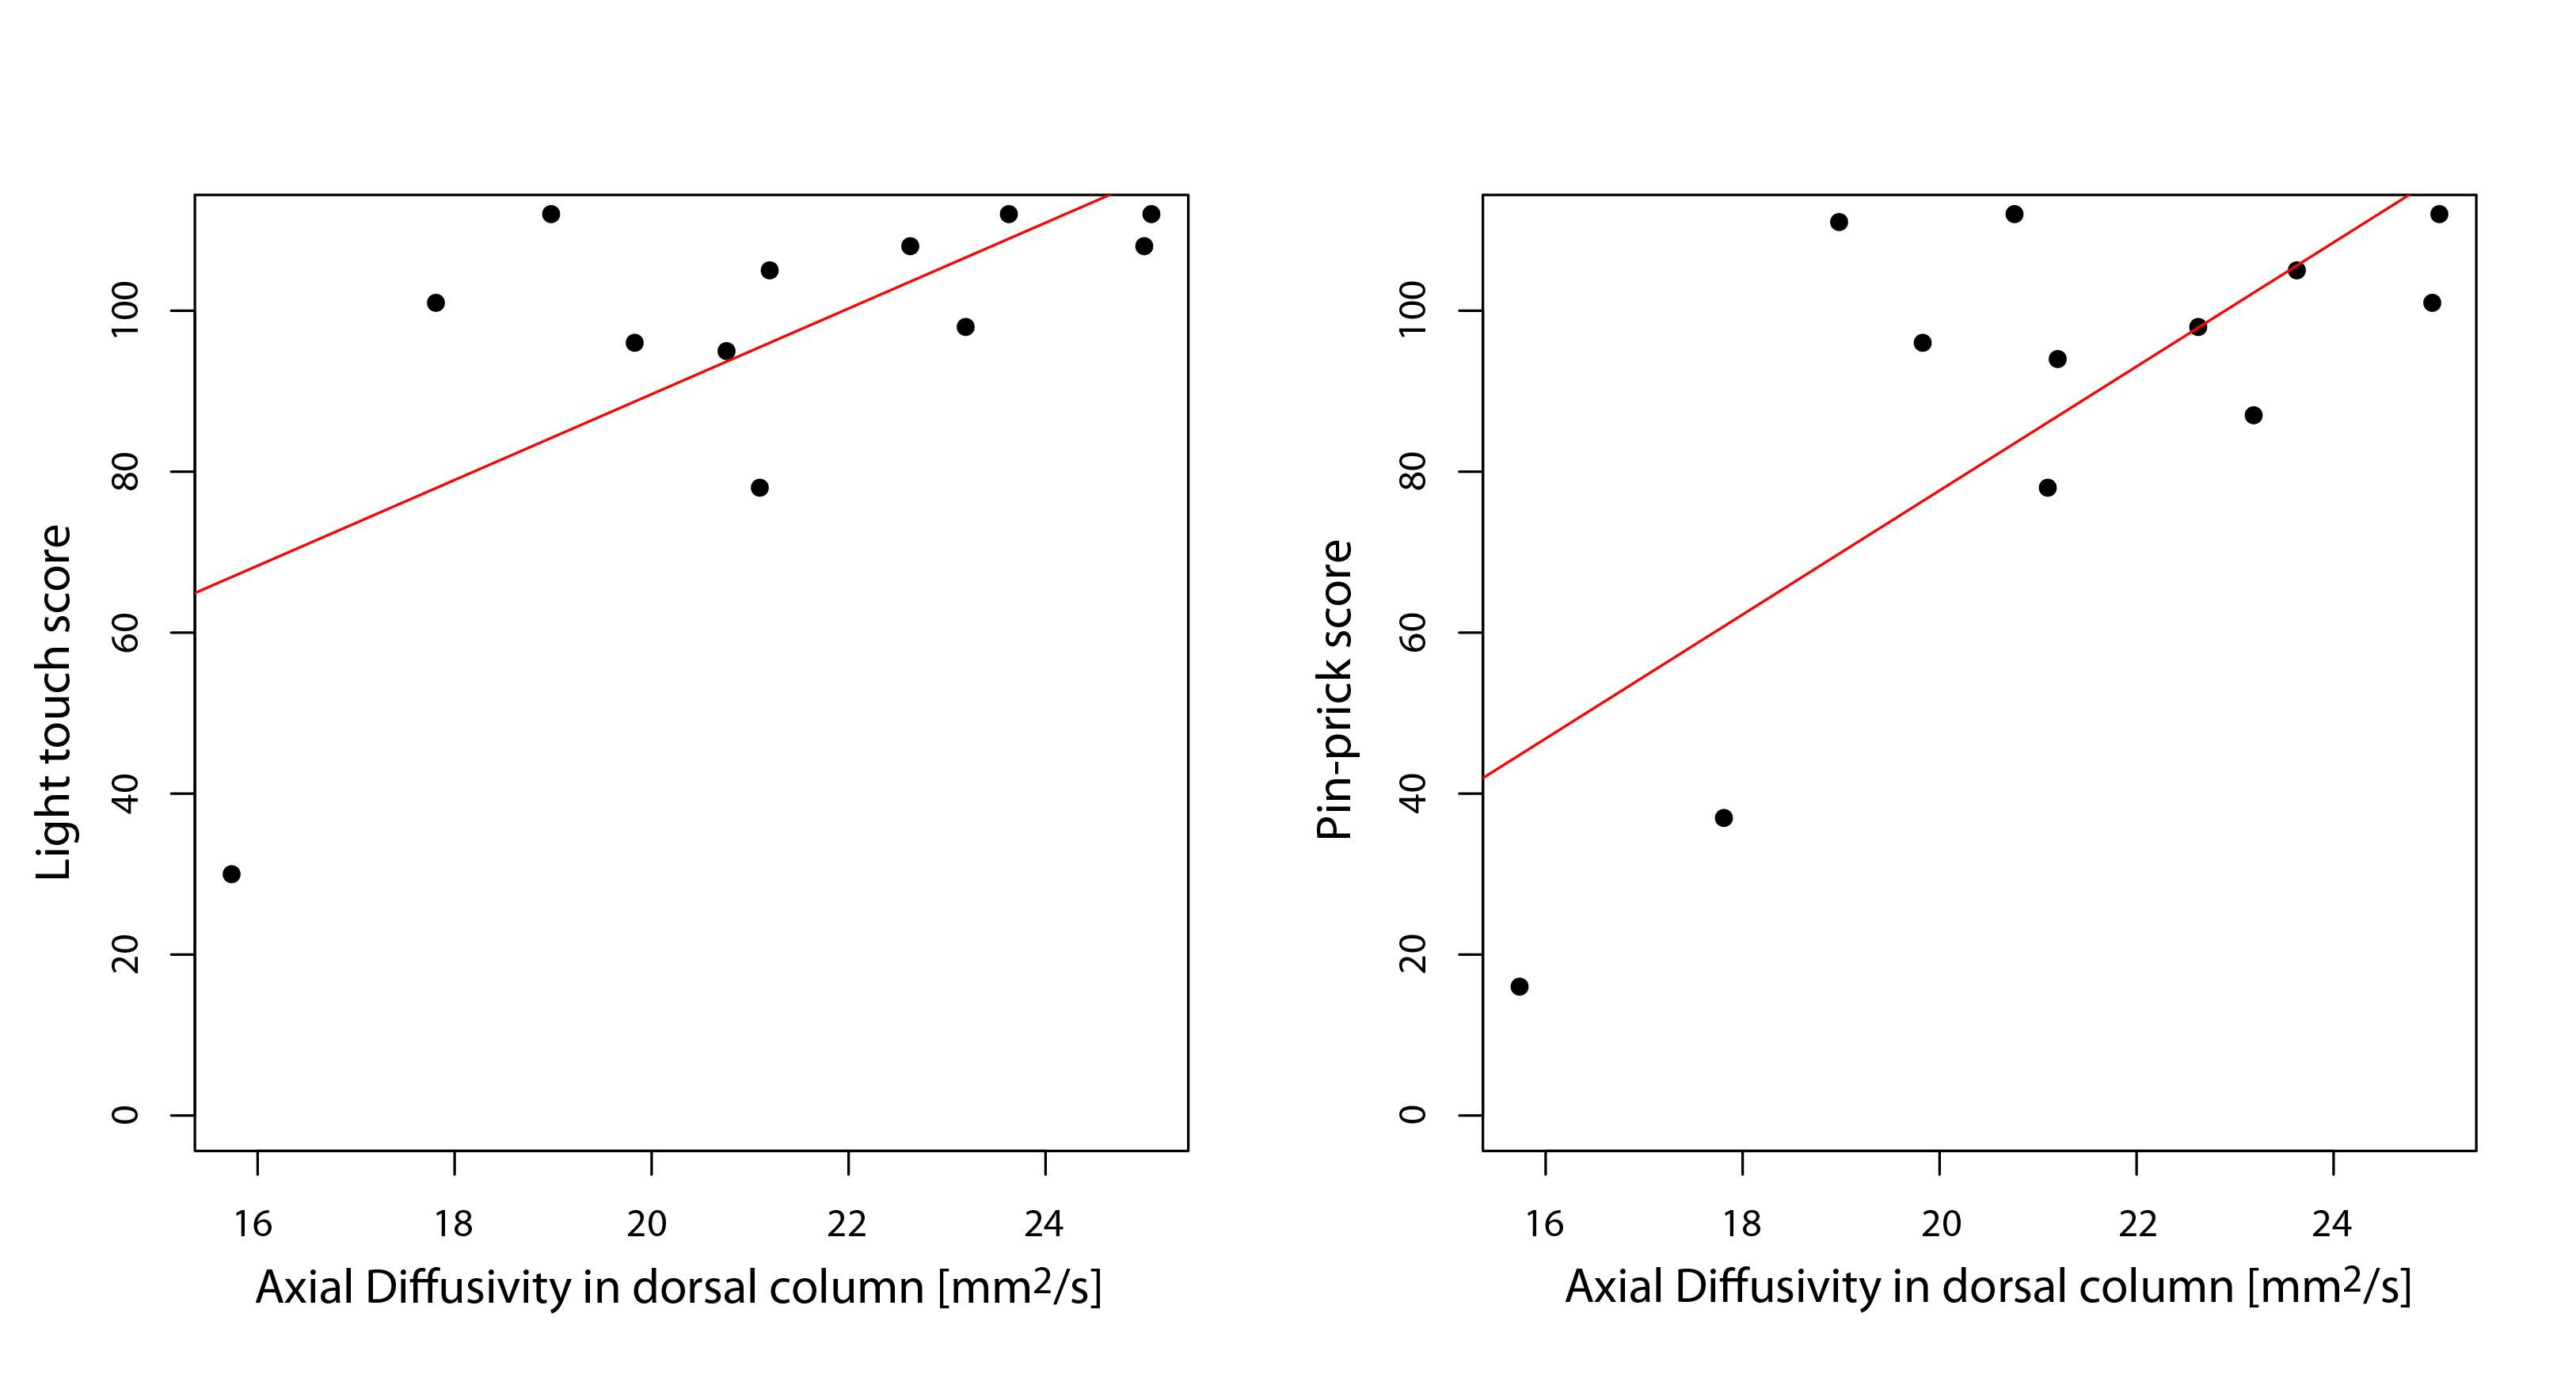
Compared to controls, SCI patients had a smaller SCA (p=0.039), WMA (p=0.025), and DCA (p=0.020) (Fig. 2). Atlas-based analysis revealed significantly lower FA in the left and right fasciculus gracilis of patients (p=0.011 and p<0.001, respectively), and in the whole dorsal column (p=0.024). RD was significantly lower in patients in the right fasciculus gracilis (p=0.005), while it showed a trend for lower values in the left fasciculus gracilis (p=0.059) and the whole dorsal column (p=0.098) (Fig. 3). Similarly, voxel-wise DTI analysis demonstrated spatially specific FA decrease and RD increase in the dorsal column of patients (Fig. 4). In terms of associations with function, AD in the dorsal column correlated with ISNSCI light touch (r=0.66, p=0.020) and pin-prick score (r=0.72, p=0.008) (Fig. 5).
Discussion
The study demonstrates that atlas- and voxel-based spinal cord DTI analyses are powerful tools to investigate neurodegeneration in subacute SCI patients in a spatially specific way. The dorsal columns in patients exhibited lower FA driven by higher RD, as well as smaller cross-sectional areas, without similar findings in motor tracts. These results suggest that anterograde degeneration of the sensory tracts is more prominent than retrograde degeneration of the motor tracts in the subacute stage. In addition, the fact that increased RD, rather than decreased AD was the driving force behind the diffusivity changes suggests that demyelination of the sensory tracts was the dominant degenerative process. In line with previous findings9, AD proved to be the best predictor of sensory outcome 1 year post-injury, suggesting that progressive degeneration with axonal loss is the more important factor affecting patient recovery.Acknowledgements
The study was supported by the International Foundation for Research in Paraplegia (IRP-158). MS was funded by Wings for Life Austria (WFL-CH-007/14), the EU project (Horizon2020 ‘NISCI’ grant agreement n_681094). PF and SM received funding from the ERANET NEURON (hMRIofSCI) and the BMBF (01EW1711A and B).References
(1) Ahuja CS, Wilson JR, Nori S, Kotter MRN, Druschel C, Curt A, Fehlings MG. Traumatic spinal cord injury. Nat Rev Dis Primers. 2017 Apr 27;3:17018.
(2) Koshinaga M, Whittemore SR. The temporal and spatial activation of microglia in fiber tracts undergoing anterograde and retrograde degeneration following spinal cord lesion. J Neurotrauma. 1995 Apr;12(2):209-22.
(3) Tae WS, Ham BJ, Pyun SB, Kang SH, Kim BJ. Current Clinical Applications ofDiffusion-Tensor Imaging in Neurological Disorders. J Clin Neurol. 2018Apr;14(2):129-140.
(4) Stroman PW, Wheeler-Kingshott C, Bacon M, Schwab JM, Bosma R, Brooks J, Cadotte D, Carlstedt T, Ciccarelli O, Cohen-Adad J, Curt A, Evangelou N, Fehlings MG, Filippi M, Kelley BJ, Kollias S, Mackay A, Porro CA, Smith S, Strittmatter SM, Summers P, Tracey I. The current state-of-the-art of spinal cord imaging: methods. Neuroimage. 2014 Jan 1;84:1070-81.
(5) Kirshblum SC, Burns SP, Biering-Sorensen F, et al. International standards for neurological classification of spinal cord injury (revised 2011). J Spinal Cord Med. 2011;34(6):535-46.
(6) Perone CS, Calabrese E, Cohen-Adad J. Spinal cord gray matter segmentation using deep dilated convolutions. Scientific Reports. 2018 Apr 13.
(7) Mohammadi S, Freund P, Feiweier T, Curt A, Weiskopf N. The impact of post-processing on spinal cord diffusion tensor imaging. Neuroimage. 2013 Apr 15;70:377-85.
(8) De Leener B, Fonov VS, Collins DL, Callot V, Stikov N, Cohen-Adad J. PAM50: Unbiased multimodal template of the brainstem and spinal cord aligned with the ICBM152 space. Neuroimage. 2018 Jan 15;165:170-179.
(9) Shanmuganathan K, Zhuo J, Chen HH, Aarabi B, Adams J, Miller C, Menakar J, Gullapalli RP, Mirvis SE. Diffusion Tensor Imaging Parameter Obtained during Acute Blunt Cervical Spinal Cord Injury in Predicting Long-Term Outcome. J Neurotrauma. 2017 Nov 1;34(21):2964-2971.
Figures