2867
DTI assessment of optic pathway function in patients with anterior visual pathway compression1Department of Electrical and Computer Engineering, Seoul National University, Seoul, Korea, Republic of, 2Department of Radiology, Seoul National University Hospital, Seoul, Korea, Republic of, 3Department of Neurosurgery, Seoul National University Hospital, Seoul, Korea, Republic of
Synopsis
We explored the diffusion tensor imaging features of the optic radiations in patients with anterior visual pathway compression. The measurements were correlated with the visual tract impairment score. Significant differences in fractional anisotropy (FA), mean diffusivity (MD) and radial diffusivity (RD) were measured in the bilateral optic radiations depending on the visual disturbance. In addition, FA, MD and RD were correlated with the severity of visual field defects in the visual disturbance group. The results demonstrate the anterior visual pathway compression influences visual field defect affecting optic radiations in the brain.
Introduction
Visual field impairment has been a matter of great concern in patients with sellar or parasellar brain tumors. Although decompression of the affected visual pathways can improve the visual impairment1-3, the recovery is limited or absent in many cases. Recently, a few studies have explored the effects of pituitary or parasellar tumors4-6 on the white matter integrity of the anterior visual pathways. However, there is no extensive study investigating the effects of anterior visual pathways compression on the optic radiation7 and exploring relationship between a visual field impairment and white matter change in the optic radiations. In this work, we explored DTI features in the optic radiation according to the presence or absence of visual disturbance in patients with sellar or suprasellar masses around the anterior visual pathways and investigated a correlation between the DTI features and visual tract impairment score (VTIS).Methods
This study included fifty-six patients with mass around the anterior visual pathways. Participants were divided into patients with visual disturbance (23 males and 21 females, aged 50.45±14.87 years) and patients without visual disturbance (4 males and 8 females, 36.50±15.80). The VTIS, a novel visual field defect index indicating the defected visual field in each visual cortex, was measured in all subjects before a surgery. A score range was zero to eight. If all part of unilateral optic tract became visual field defect, the score would be eight.
All participants were scanned on a 3T Skyra scanner (Siemens, Germany) with 64 channel head coil and patients imaging data were obtained before surgery. The multi-shell DTI was acquired using 2D echo planar imaging with TR/TE=3000/105 ms, FOV=240×240 mm2, voxel size=1.5×1.5 mm2, slice thickness=4 mm, b-values=300/700/2000 s/mm2 with 124 gradient directions each.
DTI processing was performed by FMRIB Software Library (FSL) version 5.0.8 (FMIRB analysis group, UK). The FA, MD, AD and RD maps were produced through the processing steps such as brain extraction, eddy current correction, susceptibility induced field correction and DTI fitting.
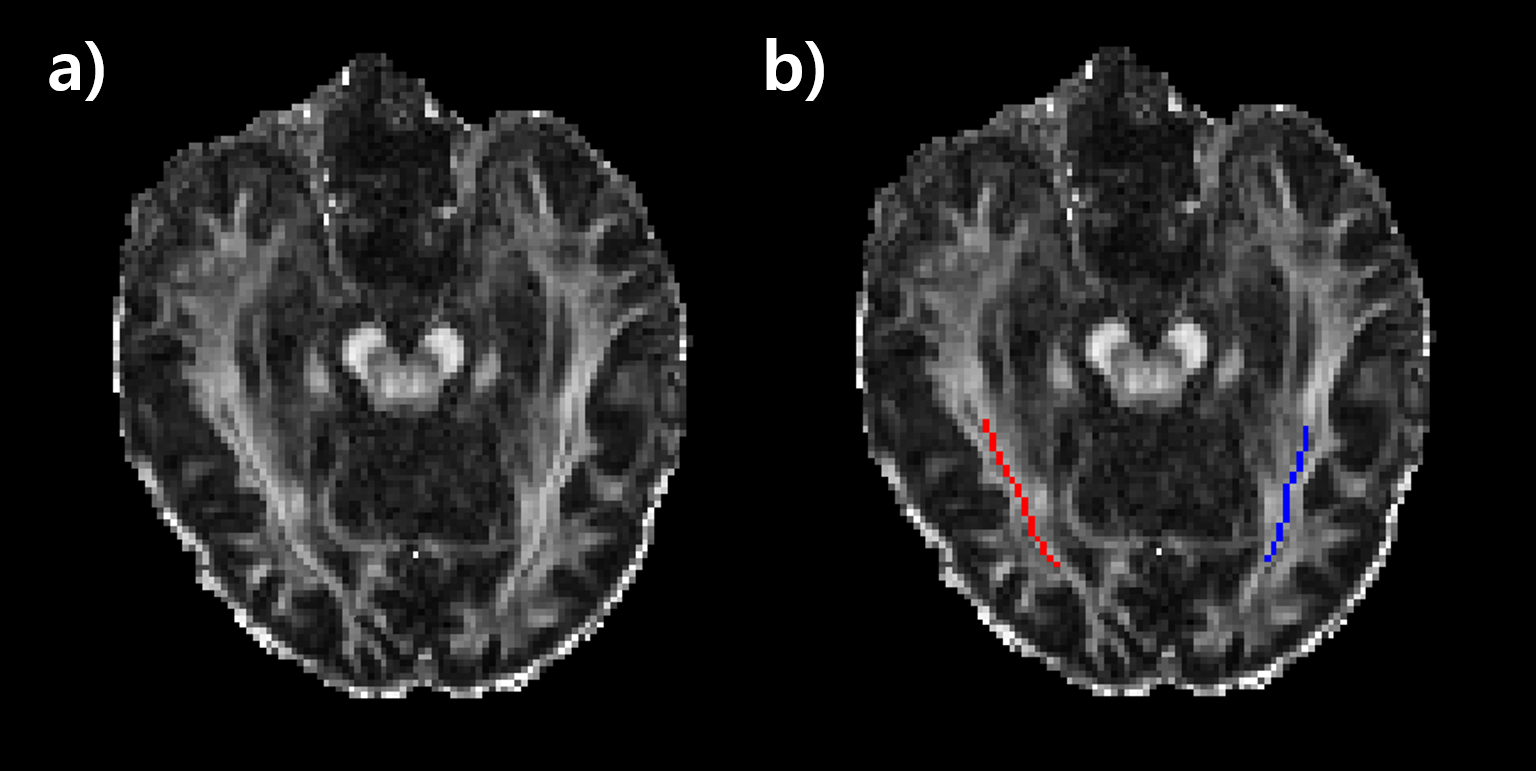
Regions of interest (ROIs) were manually drawn in each side of optic radiation using MITK workbench (German cancer research center, Germany). High intensity regions of optic radiations in an FA map were selected as ROIs (Figure 1). The ROI mask from the FA map was applied to MD, AD, RD maps for calculating image features.
All statistical analysis was performed with SPSS 25.0 (IBM Corp., USA). Analysis of covariance (ANCOVA) was used to compare the DTI features between presence and absence of visual disturbance in the enrolled patients. The partial correlation analysis was assessed the strength of association between VTIS and DTI features in patients with visual disturbance. In both analyses, the age was adjusted as a potential confounding factor. P-value of < 0.05 was considered as statistically significant.
Results
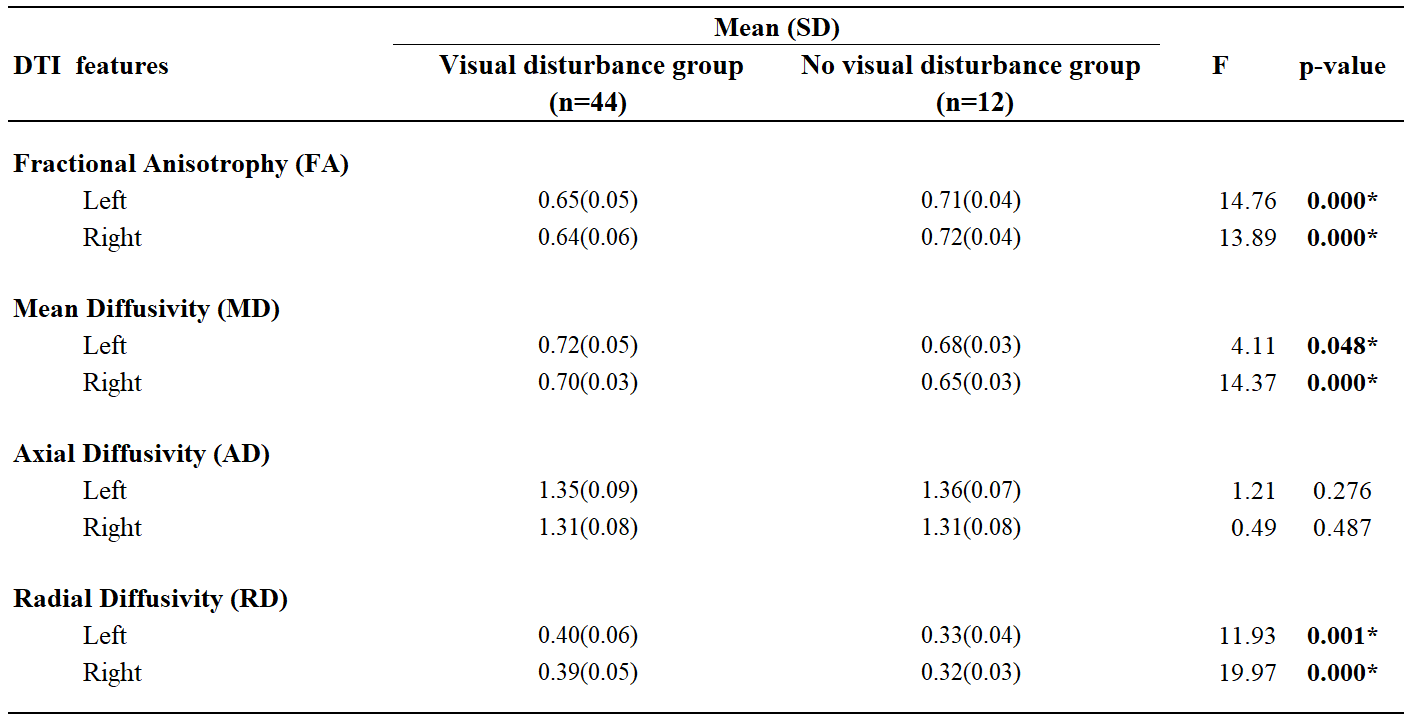
The group comparison results of DTI features in the bilateral optic radiations were shown in Table 1. The FA, MD, and RD in bilateral optic radiations were significantly different between patients with and without visual disturbance. The mean and standard deviation values of significant DTI features in left optic radiation were FA: 0.65±0.05, MD: 0.72±0.05 μm2/sec, RD: 0.40±0.06 μm2/sec in the visual disturbance patient group while FA: 0.71±0.04, MD: 0.68±0.03, RD: 0.33±0.04 in patients without visual disturbance. (right optic radiation, FA: 0.64±0.06, MD: 0.70±0.03, RD: 0.39±0.05 in the presence of visual defect patients and FA: 0.72±0.04, MD: 0.65±0.03, RD: 0.32±0.03 in the absence of visual disturbance group.)
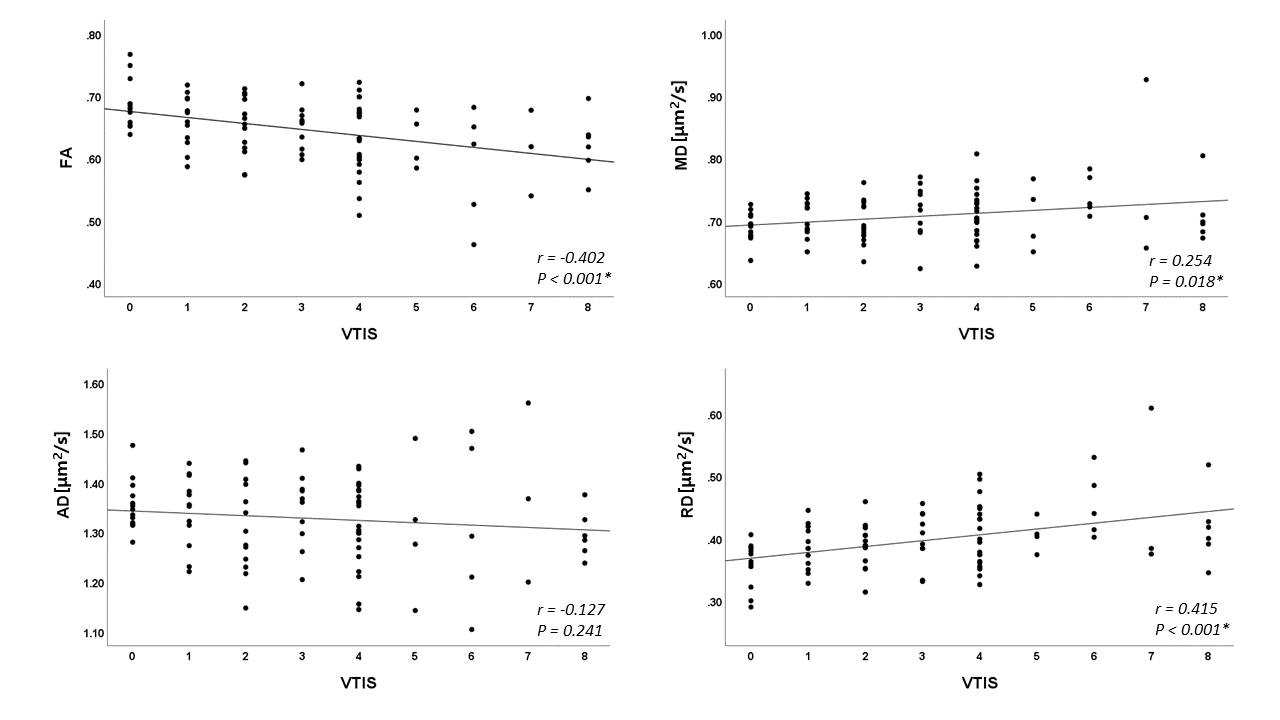
In the correlation analysis in patients with the visual disturbance (Figure 2), FA was negatively correlated with VTIS (p < 0.001). The MD and RD also showed a significant positive correlation with the visual tract impairment (MD: p < 0.018 and RD < 0.001).
Discussion and Conclusion
DTI features, FA, MD and RD, in the optic radiations showed the significant difference in the patients with compression of anterior visual pathways depending on the visual disturbance. In addition, VTIS was also significantly correlated with DTI features within the visual disturbance group. These results may be explained by an anterograde trans-synaptic degeneration which is the degeneration effect caused by an injury of axon and cells on the posterior visual pathways according to the preceding research7-8.
In summary, we demonstrated that white matter microstructural changes in the optic radiations could be influenced by the compression of anterior visual pathways. DTI might be useful to evaluate the effects of mass around the anterior visual pathway on the white matter microstructural changes in the posterior visual pathway.
Acknowledgements
This research was supported by Basic Science Research Program through the National Research Foundation of Korea (NRF) funded by the Ministry of Science, ICT & Future Planning (2017R1A2B2008412).References
1. Anik I, Anik Y, Koc K, et al. Evaluation of early visual recovery in pituitary macroadenomas after endoscopic endonasal transphenoidal surgery: Quantitative assessment with diffusion tensor imaging (DTI). Acta neurochirurgica. 2011;153(4):831-842.
2. Gnanalingham KK, Bhattacharjee S, Pennington R, et al. The time course of visual field recovery following transphenoidal surgery for pituitary adenomas: predictive factors for a good outcome. J Neurol Neurosurg Psychiatry. 2005;76(3):415-419.
3. Kerrison JB, Lynn MJ, Baer CA, et al. Stages of improvement in visual fields after pituitary tumor resection. Am J Ophthalmol. 2000;130(6):813-820.
4. Paul DA, Gaffin-Cahn E, Hintz EB, et al. White matter changes linked to visual recovery after nerve decompression. Sci Transl Med. 2014;6(266):266ra173-266ra173.
5. Metwali H, Giordano M, Kniese K, et al. Prognostic significance of intraoperative change in the fractional anisotropy and the volume of the optic chiasma during resection of suprasellar tumors. J Neurosurg. 2018;128(5):1479-1485.
6. Lilja Y, Gustafsson O, Ljungberg M, et al. Visual pathway impairment by pituitary adenomas: quantitative diagnostics by diffusion tensor imaging. J Neurosurg. 2017;127 (3):569-579.
7. Phal PM, Steward C, Nichols AD, et al. Assessment of optic pathway structure and function in patients with compression of the optic chiasm: a correlation with optical coherence tomography. IOVS. 2016;57(8):3884-3890.
8. Gabilondo I, Martinez-Lapiscina EH, Martinez-Heras E, et al. Trans-synaptic axonal degeneration in the visual pathway in multiple sclerosis. Ann Neurol. 2014;75: 98–107.
Figures