2866
MR Textural Analysis on Contrast Enhanced 3D-SPACE Images in Assessment of Consistency of Pituitary Macroadenoma1RADIOLOGY, HUASHAN HOSPITAL, SHANGHAI, China
Synopsis
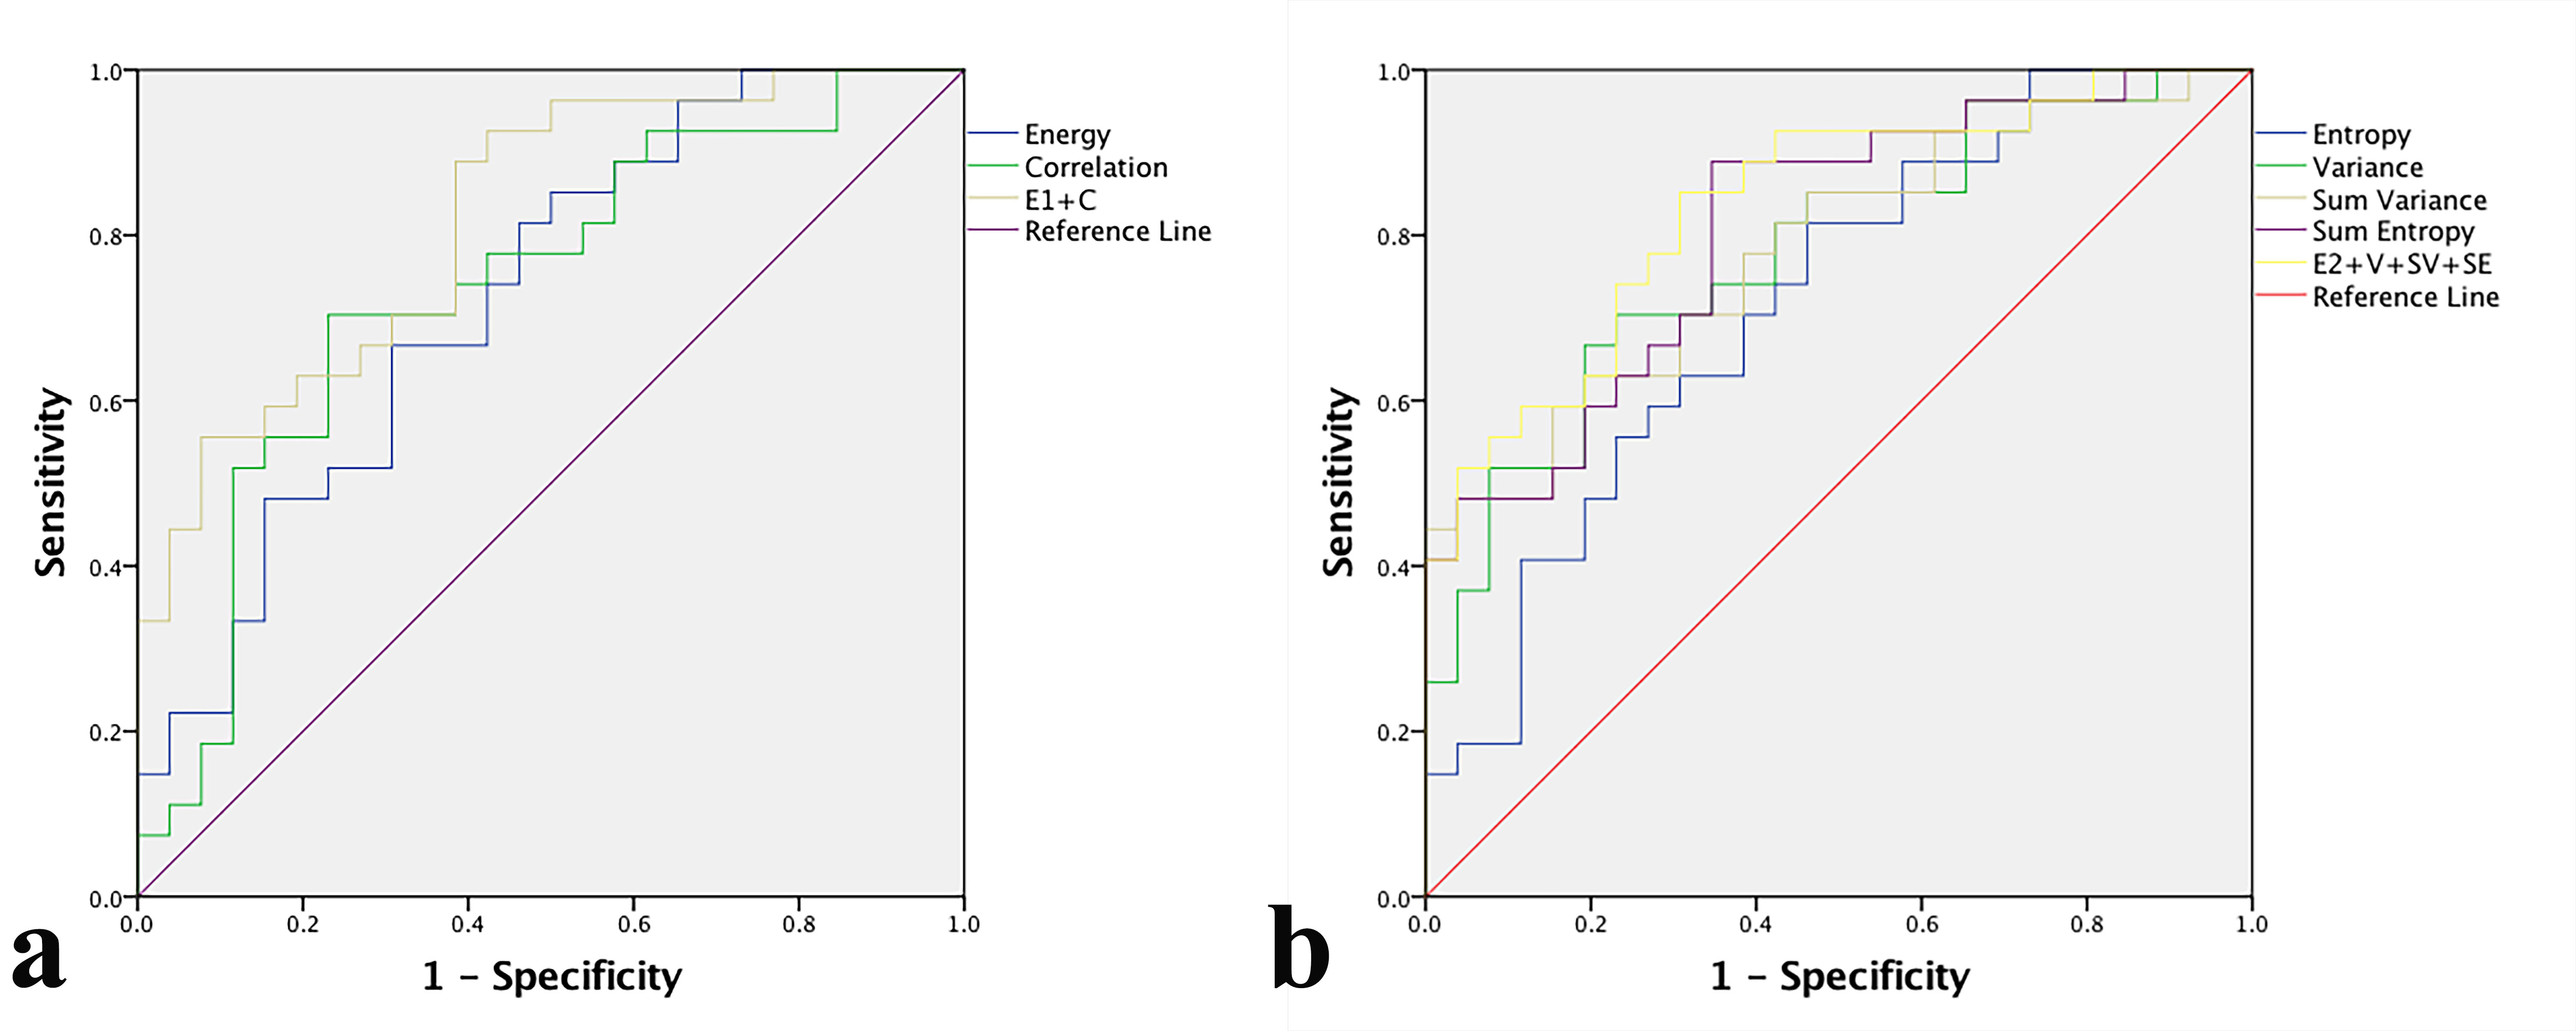
This study aimed to explore the value of MR textural analysis in assessing consistency of pituitary macroadenoma (PMA) based on contrast enhanced (CE) 3D-SPACE images. Fifty-three patients with PMAs that underwent CE 3D-SPACE scanning and endoscopic trans-sphenoidal surgery were included. First-order energy and second-order correlation negatively correlated with hard PMAs, while first-order entropy and second-order variance, sum variance, and sum entropy positively correlated with stiffness (P<0.05). Diagnostic accuracy of combined negative features could achieve an AUC of 0.819, and an AUC of 0.836 of positive features (P<0.001). MRTA using CE 3D-SPACE images is helpful for assessing PMA consistency preoperatively and noninvasively.
Introduction
The consistency of pituitary macroadenoma (PMA) determines surgery approach and resection rates. Preoperative knowledge of tumor consistency is necessary but unreliable by common MRI. Contrast enhanced (CE) three-dimensional sampling perfection with application-optimized contrasts by using different flip angle evolution (3D-SPACE) sequence is superior than routine T2WI and CE T1WI for diagnosis of pituitary adenoma, both micro- and macro-adenoma. Recent studies have shown great significance of magnetic resonance textural analysis (MRTA) in describing tumors’ biologic heterogeneity, prediction of therapeutic response, and even prognostic biomarkers. So our study aimed to explore the value of MRTA in assessing consistency of PMA based on CE 3D-SPACE images.Methods
Fifty-three patients with PMAs that underwent CE 3D-SPACE scanning by 3.0T MRI and endoscopic trans-sphenoidal surgery were included in the present study. Cases with heterogeneous consistency level of whole tumor by intraoperative observation or with complete cyst or hematoma in MRI were excluded. MR images were acquired with a 3.0 Tesla system using an 8-channel head coil. Each patient underwent MR scanning in the following order: sagittal, coronal T1-weighted SE imaging; coronal CE T1-weighted SE imaging, coronal CE 3D-T2 SPACE sequence. Enhanced imaging was performed immediately after administering a standard dose (0.1 mmol/kg) of gadopentetate dimeglumine. Consistency levels of PMAs were evaluated intraoperatively by two experienced neurosurgeons (one with over 15-years and the other with over 5-years experience in pituitary surgery). Soft tumors were easily removed by aspiration or curettage, while hard tumors couldn’t be removed by aspiration or curettage but needed piecemeal resection by a microdissector or tumor forceps. Each resection specimen was stained with H&E and anti-collagen IV by one neuropathologist with over 15-years experience in neuropathology. Before MRTA, an arbitrary shaped region of interest (ROI) was placed around the area of the mass in a coronal section that had the largest diameter of tumor, avoiding huge cystic areas and hematoma with reference to T1-SE, CE T1WI and CE 3D-T2 SPACE, then texture features were calculated by the Omni Kinetics software. ROI placement of all cases and calculation of texture features were performed twice by two radiologists with the same consistent criteria guided by an experienced neuroradiologist (with over 25-years experience in neuroradiology). Mean values of each feature were later compared to intraoperative evaluation of tumor consistency. Agreement of tumor consistency assessment by two neurosurgeons was measured by the kappa test. Correlation between tumor consistency and content of collagen IV was examined by Spearman’s correlation test. Normality tests of MRTA data for each group were analyzed by single-sample Kolmogorov-Smirnov test, which revealed P>0.05 representing normal distribution. Hence, an unpaired t-test was used to analyze the differences of texture features between soft and hard PMAs. Reproducibility and repeatability were assessed by measuring the inter- and intra-observer agreement using intraclass correlation coefficient. Receiver operating characteristic (ROC) curves by individual and combined features were used to calculate the diagnostic accuracy of MRTA in predicting PMA consistency. Combined ROC analysis was conducted with combined first- and second-order texture features by a binary logistic equation.Results
First-order energy and second-order correlation negatively correlated with hard PMAs, while first-order entropy and second-order variance, sum variance, and sum entropy positively correlated with stiffness. All showed significant differences between soft and hard PMAs (P<0.05). Diagnostic accuracy of combined negative features could achieve an AUC of 0.819, sensitivity of 88.9%, specificity of 61.5%, PPV of 70.6%, NPV of 84.2% and positive features could achieve an AUC of 0.836, sensitivity of 85.2%, specificity of 69.2%, PPV of 74.2%, NPV of 81.8% (P<0.001).Conclusion
MRTA using CE 3D-SPACE images is helpful for assessing PMA consistency preoperatively and noninvasively.Acknowledgements
None.References
[1] M. Losa, P. Mortini, R. Barzaghi, P. Ribotto, M.R. Terreni, S.B. Marzoli, S. Pieralli, M. Giovanelli, Early results of surgery in patients with nonfunctioning pituitary adenoma and analysis of the risk of tumor recurrence, Journal of neurosurgery 108 (2008) 525-32.
[2] J. Yamamoto, S. Kakeda, S. Shimajiri, M. Takahashi, K. Watanabe, Y. Kai, J. Moriya, Y. Korogi, S. Nishizawa, Tumor consistency of pituitary macroadenomas: predictive analysis on the basis of imaging features with contrast-enhanced 3D FIESTA at 3T, AJNR. American journal of neuroradiology 35 (2014) 297-303.
[3] Y. Wu, J. Wang, Z. Yao, Z. Yang, Z. Ma, Y. Wang, Effective performance of contrast enhanced SPACE imaging in clearly depicting the margin of pituitary adenoma, Pituitary 18 (2015) 480-6.
[4] S. Zhang, G. Song, Y. Zang, J. Jia, C. Wang, C. Li, J. Tian, D. Dong, Y. Zhang, Non-invasive radiomics approach potentially predicts non-functioning pituitary adenomas subtypes before surgery, European radiology, 23 Mar (2018), https://doi.org/10.1007/s00330-017-5180-6 [Epub ahead of print].
Figures