2865
Amide proton transfer in high grade glioma: Correlation with apparent diffusion coefficient, relative cerebral blood volume and pharmacokinetic imaging parameters1Kagoshima University Graduate School of Medical and Dental Sciences, Kagoshima, Japan, 2Kagoshima University Hospital, Kagoshima, Japan, 3Philips Japan, Tokyo, Japan, 4Philips Research, Hamburg, Germany
Synopsis
Our purpose was to investigate potential correlations amide proton transfer signal intensity (APTSI) with apparent diffusion coefficient, relative cerebral blood volume and pharmacokinetic imaging parameters in high grade glioma (HGG). APTSI showed significant positive correlations with ADC (ρ = 0.582, p < 0.001) and with Ve (ρ = 0.300, p = 0.002), and a significant negative correlation with Kep (ρ = -0.337, p = 0.002). These results suggested that high APTSI in HGG may reflect proteins and peptides in large extracellular space, in addition to those in the intracellular space.
INTRODUCTION
Amide proton transfer (APT) imaging is an emerging molecular MRI technique to detect endogenous mobile proteins and peptides. Many encouraging results have been reported regarding APT signal as a promising biomarker for brain tumors, especially for gliomas. However, the underlying pathologies for the high APT signal in malignant gliomas have not been clarified. To gain insight into the origin of the APT signal, we directly compared APT signal intensity (APTSI) with apparent diffusion coefficient (ADC), relative cerebral blood volume (rCBV) and pharmacokinetic imaging parameters in high grade glioma (HGG).METHODS
This retrospective study included 24consecutive patients with HGG (22 glioblastomas, 2 anaplastic oligodendrogliomas) who underwent pretreatment MR examination including APT, diffusion-weighted, dynamic susceptibility contrast (DSC) perfusion and dynamic contrast-enhanced (DCE) scans. APT imaging was performed using a saturation pulse duration of 2 s and strength of 2 μT. APTSI was defined as magnetization transfer ratio asymmetry at ±3.5 ppm. ADC maps were generated with b values of 0 and 1000 s/mm2. DSC and DCE MRI were acquired after the bolus injection of gadolinium contrast agent using a power injector (4.0 and 2.0 mL/s). rCBV maps were obtained with leakage correction and normalization using normal appearing white matter. DCE MRI-derived parameters included Ktrans, Kep, Ve, Vp and iAUC. Round ROIs with a fixed diameter (10 mm) were drawn on post-contrast T1-weighted images to fill the enhancing solid parts within each tumor avoiding necrotic and cystic areas, and copied onto exactly the same locations in each parametric map (Figure 1). A total of 86 ROIs were included in the analysis. Correlations between APTSI and the others imaging parameters were assessed using Spearman’s rank correlation coefficient.RESULTS
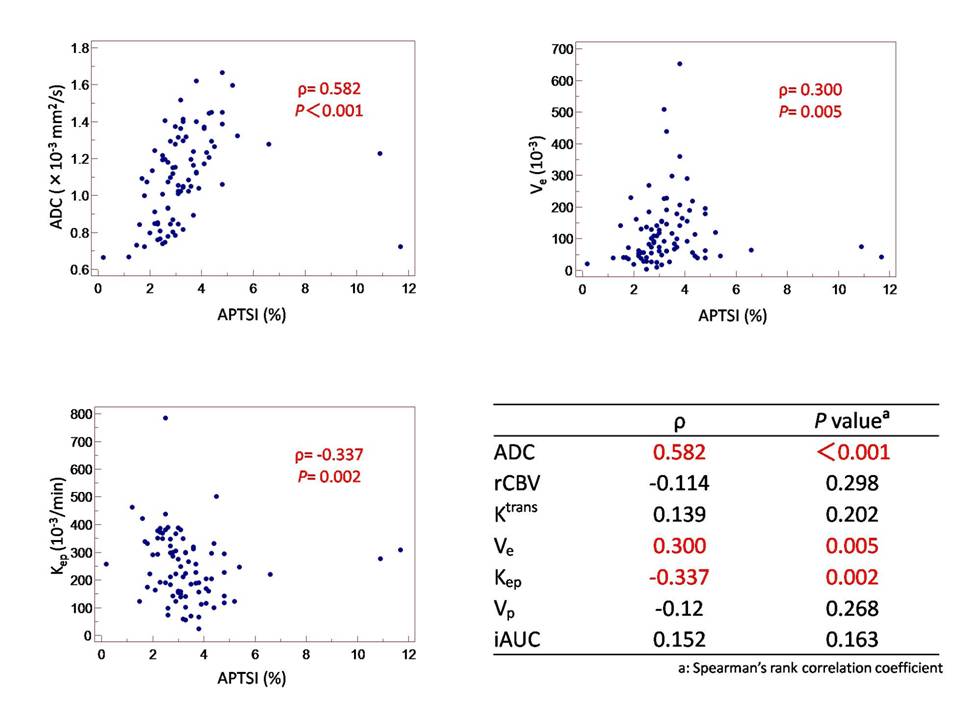
APTSI showed a significant positive correlation with ADC (ρ = 0.582, p < 0.001), a significant positive correlation with Ve (ρ = 0.300, p = 0.002), and a significant negative correlation with Kep (ρ = -0.337, p = 0.002). (Figure 2). No other imaging parameters showed significant correlation with APTSI (Figure 2).DISCUSSION
In this study, there was a moderate positive correlation between APTSI and ADC values. High ADC values in enhancing regions of HGG were previously reported to represent microcystic degeneration, necrotic foci, and the overproduction of extracellular matrix proteins of glioblastoma cells1). Therefore, the positive correlation between APTSI and ADC values suggests contribution of extracellular proteins and peptides in such pathologies, in addition to intracellular proteins of HGG2). There was a significant positive correlation between APTSI and Ve values. Ve denotes the extravascular extracellular space fractional volume of tissue3). A significant positive correlation between APTSI and Ve values is in accordance with the hypothetical contribution of proteins and peptides in the extravascular extracellular space to APTSI. There was a significant negative correlation between APTSI and Kep values. In HGG, increased Kep and Ktrans have been considered to reflect the destruction of the blood brain barrier due to tumor. Kep is calculated by dividing Ktrans by Ve. Since there was no significant correlation between APTSI and Ktrans, the significant negative correlation between APTSI and Kep values may be attributable to the positive correlation between APTSI and Ve.CONCLUSION
High APTSI in HGG may reflect proteins and peptides in large extracellular space, in addition to those in the intracellular space.Acknowledgements
No acknowledgement foundReferences
1. Caravan I et al. Diagnostic value of apparent diffusion coefficient in differentiating between high-grade gliomas and brain metastases. ActaRadiol. 2018;59:599-605.
2. Togao O, et al. Amide proton transfer imaging of adult diffuse gliomas: correlation with histopathological grades. Neuro-Oncology 2014.;16:441–448.
3. Tofts PS et al. Estimating Kinetic Parameters From Dynamic Contrast-Enhanced T1-Weighted MRI of a Diffusable Tracer: Standardized Quantities and SymbolsJ Magn Reson Imaging. 1999;10:223-32.
Figures