2862
An optimised protocol for dynamic oxygen enhanced imaging of brain tumours1University of Manchester, Manchester, United Kingdom, 2Salford Royal NHS Foundation Trust, Manchester Centre for Clinical Neurosciences, Manchester, United Kingdom, 3Bioxydyn Limited, Manchester, United Kingdom
Synopsis
Hypoxia is an important factor in tumour resistance and regression. The use of oxygen as an MR contrast agent is gaining interest but the technique has been hampered by relatively low contrast, noisy data. Here we present an optimised protocol for dynamic oxygen-enhanced MRI (dOE-MRI) of brain tumours. We present data from healthy normal volunteers that demonstrate the method’s capability of producing reliable oxygen-induced signal change and data from glioblastoma (GBM) patients demonstrating tumour sub-division specific changes, showing the potential of this method for mapping tumour hypoxia.
Introduction
The use of oxygen as a contrast agent in T1-weighted MRI is gaining interest, with recent work characterising normal and pathological tissue in the abdomen, brain, thorax and preclinical cancer models1. While results have shown promise in correlations between hypoxia related imaging biomarkers and histological measurement, the technique has been hampered by relatively low contrast, noisy data. Here we present a protocol with significantly higher contrast-to-noise and signal-to-noise ratios than existing methods. We optimise this protocol for dynamic oxygen-enhanced MRI (dOE-MRI) of the brain, presenting data from healthy normal volunteers that demonstrate the method’s capability of producing reliable oxygen-induced signal change. Further, in a cohort of glioblastoma (GBM) patients, we find region-specific changes, showing the potential of this method for mapping tumour hypoxia.Method
dOE-MRI and high resolution T1-weighted data was acquired for three healthy normal volunteers (male, 31-45 years). Four patients (3 female, 28-73 years) presenting with suspected GBM who volunteered for the study underwent an additional dOE-MRI scan as part of a standard pre-surgical planning protocol that included T2w, and pre-and post-contrast T1w images.
The dOE-MRI method uses an inversion prepared centric-ordered TFE sequence, previously described for use in the lung2, which we optimise here for use in the brain. Both the inversion time (TI) and flip angle (θ) are optimized to maximize signal contrast for the tissue of interest whilst minimizing signal decay during readout and maintaining T1 weighting. For all data presented, TI was set at 950 ms and θ adjusted accordingly as an estimation of the optimum for generating grey matter contrast at 1.5 T. A non-selective inversion pulse was used to suppress inflow. K-space line TR (3.4 ms) was minimised to ensure rapid acquisition, and TE (0.81 ms) was minimised in order to minimise T2* effects.
Data were acquired on a Philips Achieva 1.5 T MRI scanner using an 8-channel head coil. Dynamic OE-MRI dynamic data were acquired for approximately 8 minutes. For the first 2.5 minutes of the dynamic series the participant breathed medical air (21% O2). This was then switched to 100% O2 for the remainder of each scan. Air/oxygen was delivered via a non-rebreathing face mask at 15 l/min and the participant was asked to breathe normally throughout the session.
Data were pre-processed using tools developed in-house and supplied within the FSL software library (FSL v5.0, https://fsl.fmrib.ox.ac.uk/fsl/fslwiki/). The dynamic data processing included brain extraction, motion correction, and 4D median filtering. Grey matter (GM), white matter (WM) and cerebrospinal fluid (CSF) masks were created from automatic segmentation of the high resolution T1w scan. These masks were eroded to reduce mislabelling and partial volume effects, and transformed to the space of each dynamic sequence. For patients, further masks were defined by a clinician to delineate components for contrast-enhancing, necrotic core, and peripheral oedematous tissue.
Mean signal was extracted and percent signal change calculated from each tissue mask. In patients, the GM/WM/CSF mean signal and percent signal change were derived from the hemisphere contralateral to the tumour.
Results
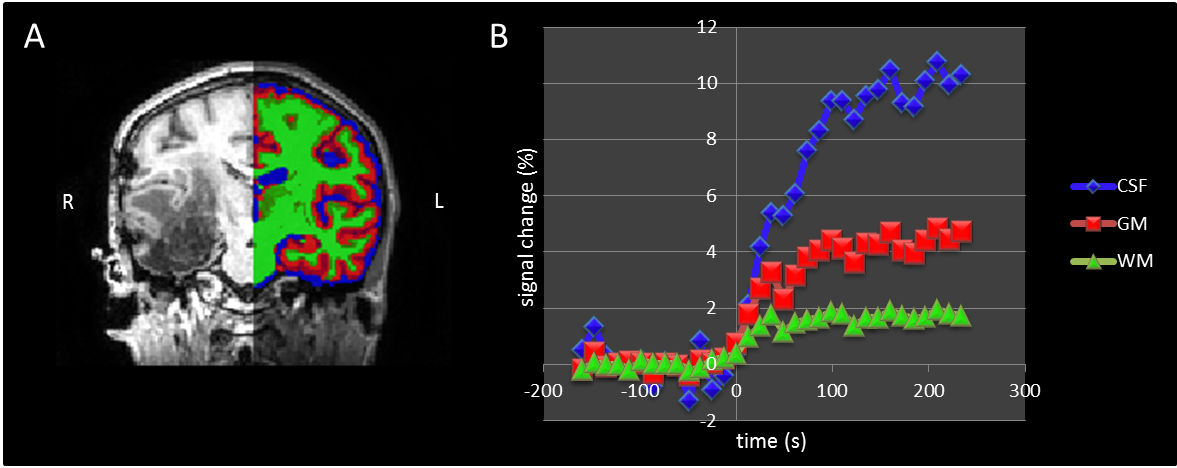
Figure 1 shows an image of oxygen induced signal change in an example healthy volunteer and the percent signal change over time in each tissue type. All tissues demonstrate a detectable change due to oxygen delivery and a similar pattern was observed for all healthy subjects: higher percentage signal increase in CSF, and a lower rate of increase in GM and WM. The magnitude of change is higher in GM than WM but with a similar rate. Figure 2 shows percent signal change in a patient with a GBM in the right temporal lobe, thresholded at 5% change to highlight tumour-related changes. Signal change in the tissues of the contralateral hemisphere follows the pattern seen in healthy volunteers (Figure 3). Regions of enhancing tumour and peripheral odematous tissue show a substantial signal change, of similar magnitude and rate of increase as seen in CSF (Fig. 1), and a lack of change in the necrotic core. Similar relative patterns were seen for all four patients.Conclusions
Dynamic OE-MRI demonstrates a clear ability to image oxygen induced signal changes in the healthy brain and in brain tumours. Our optimisation maximises sensitivity to T1 changes and supresses the potential impact of T2* changes on the oxygen-enhanced signal. Signal change is robustly detectable in healthy brain tissue and gives clear differentiation across different regions of GBM tumours and associated odematous tissue. Strong signal change seen in contrast-enhanced regions reflects the ample well-oxygenated blood supply in this region, while the lack of signal change in necrotic area reflects the lack of oxygen delivery.Acknowledgements
This work was supported by CRUK [C8742/A18097]. This is a contribution from the Cancer Imaging Centre in Cambridge & Manchester, which is funded by the EPSRC and Cancer Research UK. We thank David Higgins of Philips Healthcare for assistance in protocol development and for access to research protocols.References
1. Little et al. Radiology. 2018 Sep;288(3):739-747
2. Martini et al. (2018). European Radiology, 28(10), 4037–4047
Figures