2858
Quantitative cerebral perfusion with Scale-PWI demonstrates WHO II/III grading in glioma patients1Department of Radiology, Institute of Surgery Research, Daping Hospital, Army Medical University, Chongqing, China, 2Chongqing Clinical Research Centre of Imaging and Nuclear Medicine, Chongqing, China, 3MR Collaboration, Siemens Healthcare, Ltd., Shanghai, China
Synopsis
This study aimed to demonstrate that the Scale-PWI sequence with absolute quantification for cerebral perfusion in the solid region of the tumors was a meaningful diagnostic factor in grade-II and grade-III gliomas. Total 8 glioma patients (4 grade II , 4 grade III) were subjected Scale-PWI scanning. ROC analysis confirmed that has great accuracy in grading World Health Organization (WHO) II and III gliomas.
Introduction
Perfusion MR imaging with dynamic susceptibility contrast is clinically important in assessing brain perfusion during the diagnosis of glioma (1). However, it is difficult to discriminate between grade-II and grade-III gliomas by relative Cerebral Blood Volume (CBV)/ Cerebral Blood Volume (CBF) derived from dynamic susceptibility contrast MRI (DSC-MRI) (2). Recently, a new pulse sequence called self-calibrated EPI perfusion-weighted imaging (Scale-PWI) has allowed for the quantification of the CBV/CBF (qCBV/qCBF) and provides accurate hemodynamic information from the brain (3). In this study, we aimed to confirm that the Scale-PWI sequence has great accuracy in grading World Health Organization (WHO) II and III gliomas.Methods
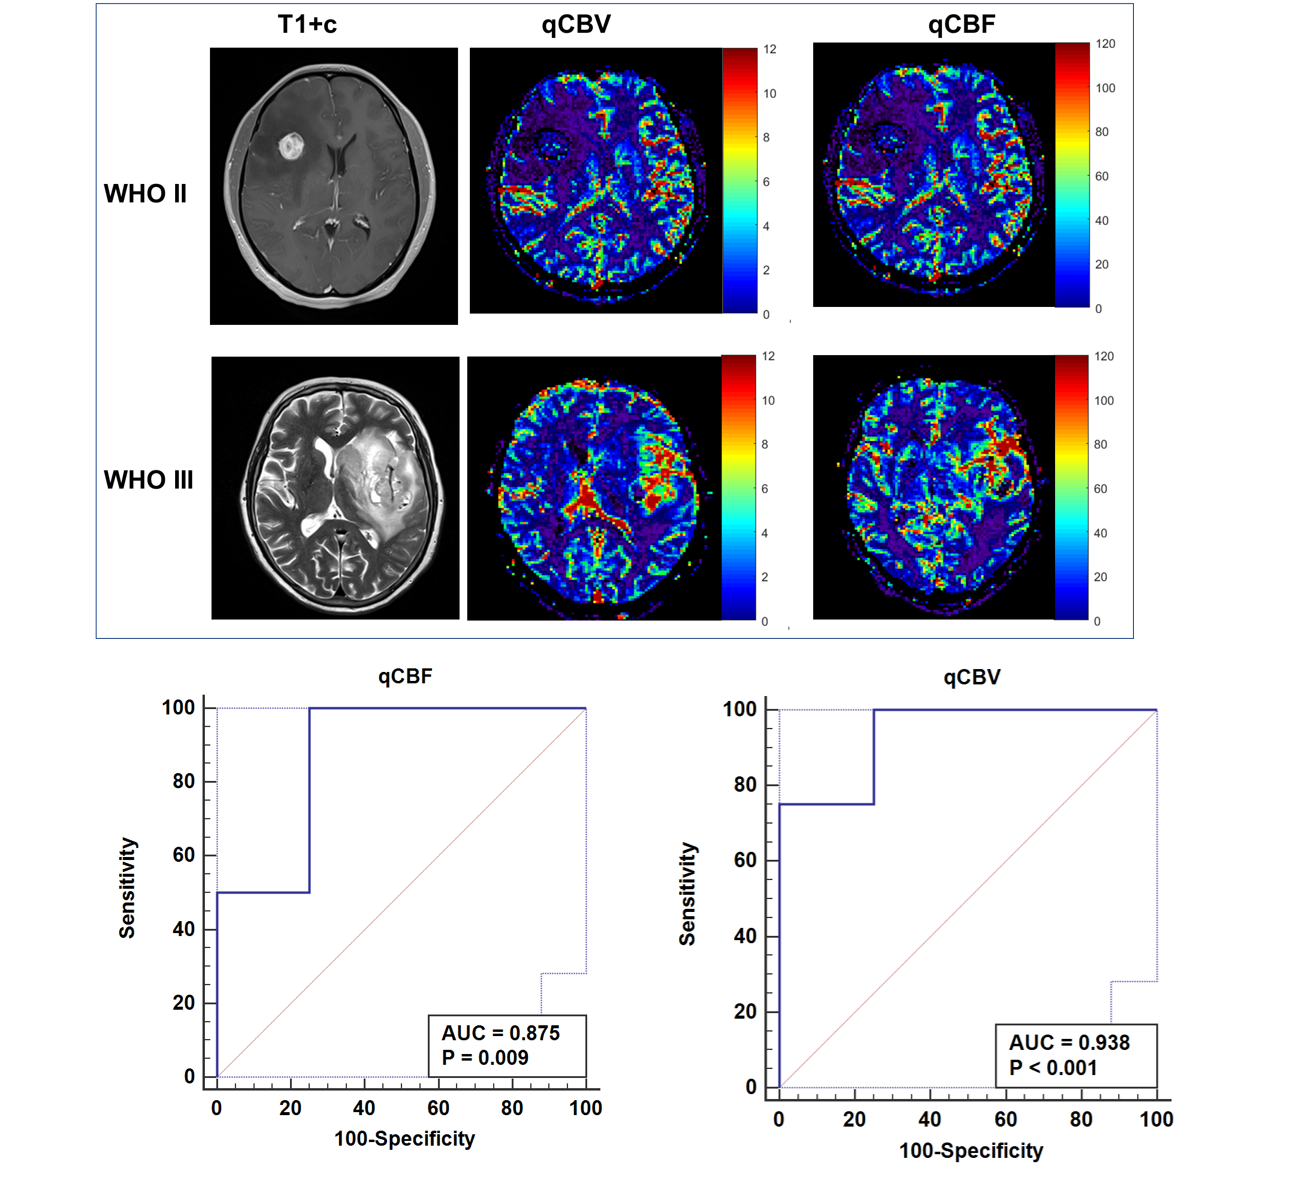
Patients: Adult patients with neuroradiologically suspected gliomas were prospectively recruited from October 2017 to June 2018. Patients with histologically proven grade-II or grade-III glioma were further analyzed (n = 8). Imaging protocol: All the MRI scans were performed on a MAGNETOM Aera 1.5T MR scanner (Siemens Healthcare, Erlangen, Germany) with a 16-channel head coil. A prototypic Scale-PWI sequence was applied with the following parameters: TE/TR = 34/1090 ms, flip angle = 20o, FOV= 220 mm × 220 mm2, matrx = 128 × 128, GRAPPA with acceleration factor = 2, 13 slices in the brain with slice thickness = 5 mm, and a total of 50 measurements. Regions of interests (ROIs) were delineated on gadolinium-based contrast agent (GBCA)–enhanced T1-weighted (GBCA-T1c) images. The discriminating potential for qCBV and qCBF in assessing the glioma grade was assessed with receiver operating characteristics (ROC) curves. The qCBV and qCBF data between glioma grades were compared (Student's t-test for independent samples).Results
The quantification DSC metrics were significantly different among grades II and III (qCBF: 42.3 ± 16.3 ml/100g/min for grade II, 74.8 ± 16.1 ml/100g/min for grade III, p < 0.05; qCBV: 2.3 ± 0.3 ml/100g for grade II, and 5.7 ± 1.1 ml/100g for grade III, p < 0.05). The area under the curve (AUC), optimal cut-off value, and corresponding sensitivity and specificity for all the metrics used to differentiate between grade-II and grade-III gliomas are reported in Table 1, whereas the corresponding ROC curves are shown in Figure 1.Discussion
Our results showed that WHO grade-II and grade-III gliomas can be predicted with a high degree of likelihood based on the accurate quantification of CBV and CBF. Grade-II gliomas represented low-grade tumors with longer patient survival, whereas grade-III gliomas were associated with shorter patient survival and a more dismal prognosis. The differentiation between glioma grades II and III is important to evaluate prognosis and make treatment decisions. However, the small sample size is the primary limitation in this study. In addition, there was a lack of the comparison between qCBV/qCBF and rCBV/CBF.Conclusions
An absolute quantification for cerebral perfusion in the solid region of the tumors was a meaningful diagnostic factor in grade-II and grade-III gliomas. Further work focused on the molecular classification of gliomas will be performed in the future.Acknowledgements
Supported by the Natural Science Foundation of China and Ministry of Science and Technology of China.References
1. Law M, Young R, Babb J, Pollack E, Johnson G. Histogram analysis versus region of interest analysis of dynamic susceptibility contrast perfusion MR imaging data in the grading of cerebral gliomas. AJNR Am J Neuroradiol 2007;28(4):761-766.
2. Caulo M, Panara V, Tortora D, Mattei PA, Briganti C, Pravata E, Salice S, Cotroneo AR, Tartaro A. Data-driven grading of brain gliomas: a multiparametric MR imaging study. Radiology 2014;272(2):494-503.
3. Srour JM, Shin W, Shah S, Sen A, Carroll TJ. SCALE-PWI: A pulse sequence for absolute quantitative cerebral perfusion imaging. J Cereb Blood Flow Metab 2011;31(5):1272-1282.
Figures