2856
The study of relationship between amide proton transfer(APT) imaging and IDH mutation status in patients with high-grade gliomas1Department of Radiology, Guangdong General Hospital, Guangdong Academy Of Medical Sicences, Guangzhou, China, 2Department of Radiology, The Third Affiliated Hospital of Guangzhou Medical University, Guangzhou, China, 3Philips Healthcare, Guangzhou, China
Synopsis
We want to investigate the association of amide proton transfer weighted imaging (APTw) with isocitrate dehydrogenase (IDH) wild-type and IDH mutant of high-grade gliomas.All patients underwent MR scan, including APT san to getting the APT values of the whole tumor. The APT value of the IDH wild type group was significantly higher than that of the IDH mutant group. We conclude that APTw can be used to predict the gene type of IDH in high-grade gliomas before surgery.
Introduction
Gliomas are the most common primary brain tumors, and about half of them are high-grade1. An important molecular biomarker-isocitrate dehydrogenase 1 (IDH1) is induced to define glioma entities in the 2016 World Health Organization (WHO) classification of central nervous system tumor2.Mutations in IDH genes are prevalent in high-grade gliomas, indicating a favorable prognosis3. Therefore, non-invasive prediction of IDH genotype plays an important role in the diagnosis and prognosis of glioma. Amide proton transfer weighted (APTw) imaging is a novel molecular imaging technique, which can non-invasively detect the exchange rate between amide protons and water-hydrogen ions4. We intend to study the relationship between APTw imaging signal changes and IDH genotypes in high-grade gliomas, and except to provide high-grade glioma IDH gene information before surgery.Methods
Twenty-five patients with pathologically confirmed high-grade gliomas were enrolled, dividing into two groups, the IDH-wild type group and the IDH-mutant group. Routine sequences ,T1W enhancement and APTw scan were carried out on a 3.0-T clinical scanner (Ingenia,3.0T, Philips, Netherlands). APT imaging was performed with three dimensional TSE-DIXON sequence. Two RF transmission sources were used alternatively for saturation which enabled long saturation duration (2 seconds, 2µT) and saturation homogeneity. APT frequency series (±3.5, ±3.42, ±3.58, -1540ppm) were acquired via multi-acquisition TSE-Dixon scanning. B0 map for correction was obtained by three acquisitions at +3.5ppm with different echo shifts (ΔTE = 0.4ms). B0 corrected ATP images were reconstructed automatically online by the software. Other main parameters were as follows: TR/TE: 5775/6ms; FOV: 212×182×40mm3; voxel size: 1.8×1.8×4.4mm3; scan time: 6min and 15sec.Based on the FLAIR images of all tumor layers, the solid components of the tumor were selected as the regions of interest(ROIs) on APTw images, and the APT values of each layer were obtained to get the mean value. Differences between the groups were analyzed using an independent sample t test.Receiver operating characteristic curve (ROC) analysis was performed to determine the optimal cutoff values.Results and Discussion
Among the 25 patients with high-grade gliomas, 9 cases were IDH mutant type and 16 cases were IDH wild type. The APT value of the IDH wild type group was significantly higher than that of the IDH mutant group (Table 1,Fig 1, Fig 2), which were 3.21%±0.82% and 2.23%±0.72%, respectively.The area under the curve (AUC) was 0.84, with a sensitivity of 93.8% and a specificity of 66.7%(Fig 3). The 95% confidence interval (CI) of APT value was 2.48%-3.23%, and the optimal threshold of APT value was 2.12%. When the tumor APT value was higher than 2.12%, the patient was likely to be IDH wild type.Conclusion
The APTw may serve as a potential biomarker for predicting IDH genotype in high-grade gliomas before surgery, and might be helpful for clinical management .Acknowledgements
No acknowledgement found.References
[1] Hilario A, Sepulveda JM; Perez-Nuez A, et al. A prognostic model based on preoperative MRI predicts overall survival in patients with diffuse gliomas. AJNR Am J Neuroradiol.2014,35(6):1096-1102.
[2] Louis DN, Perry A, Reifenberger G, et al. The 2016 world health organization classification of tumors of the central nervous system: a summary. Acta Neuropathol,2016,131(6):803-820.
[3] Zeng A, Hu Q,Liu Y, et al. IDH1/2 mutation status combined with Ki-67 labeling index defines distinct prognostic groups in glioma. Oncotarget,2015,6(30):30232-30238.
[4] Sakata A, Okada T, Yamamoto A, et al. Grading glial tumors with amide proton transfer MR imaging: different analytical approaches.J Neurooncol.2015,122(2):339-348
Figures
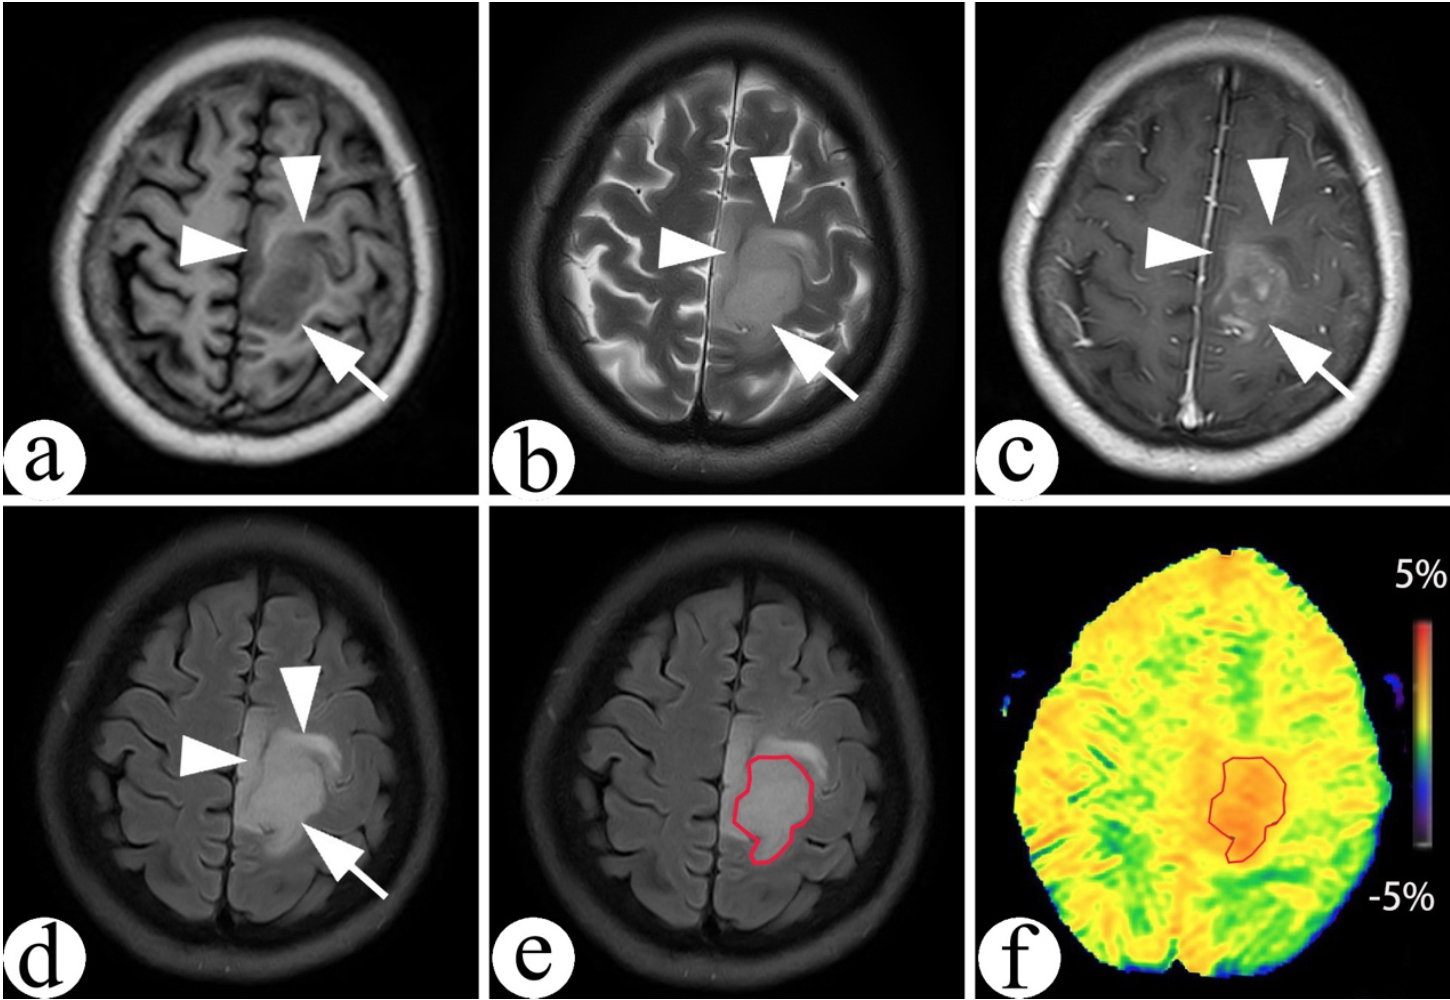
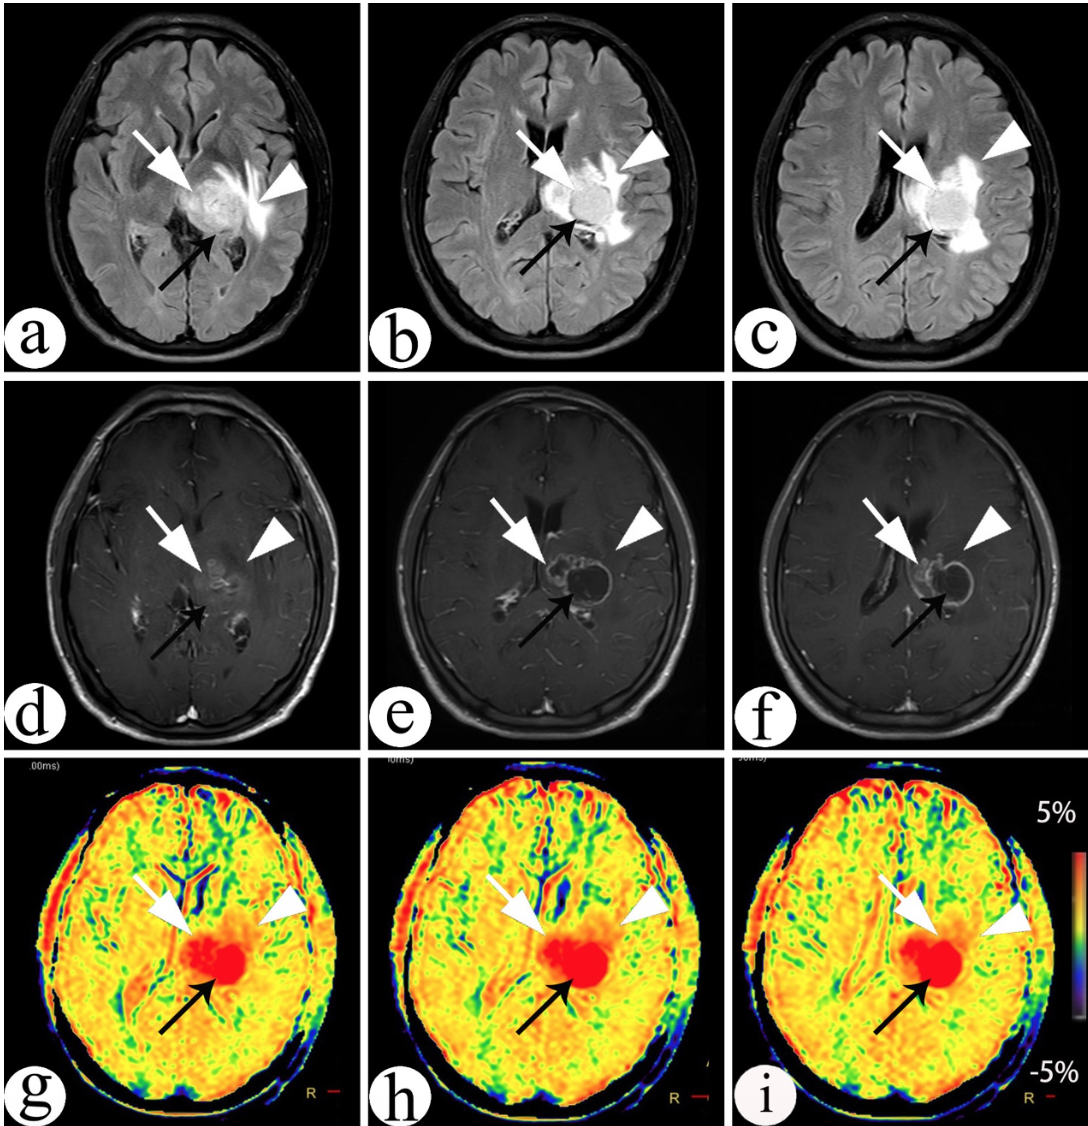
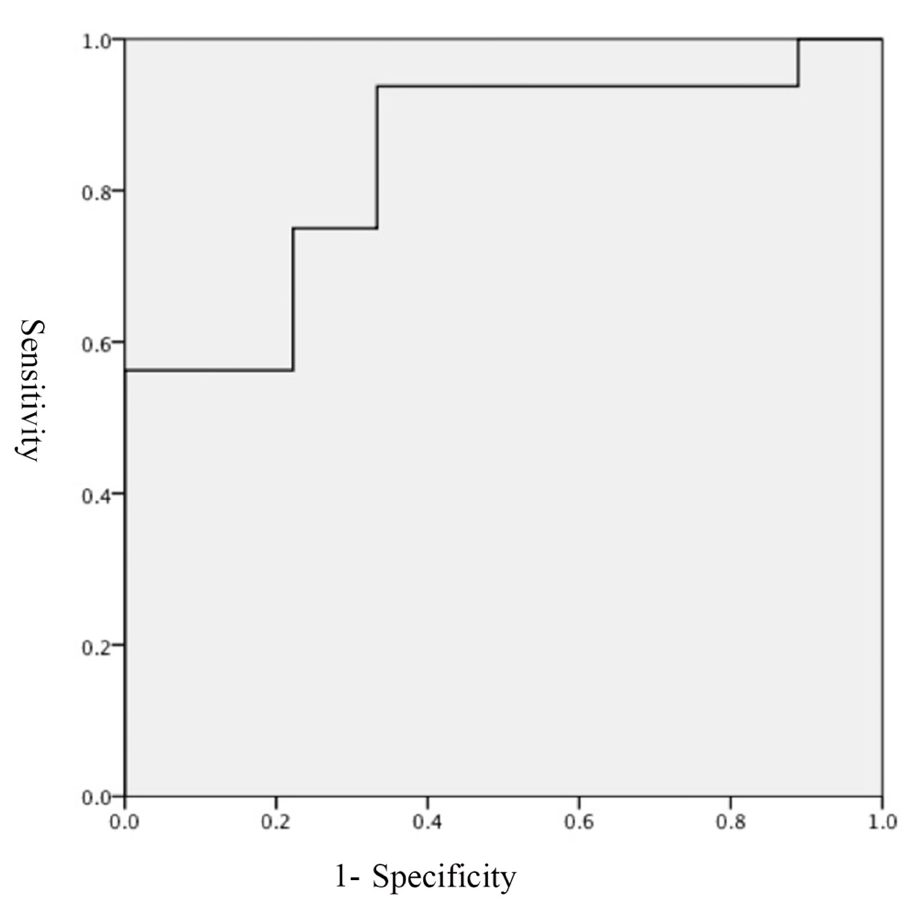
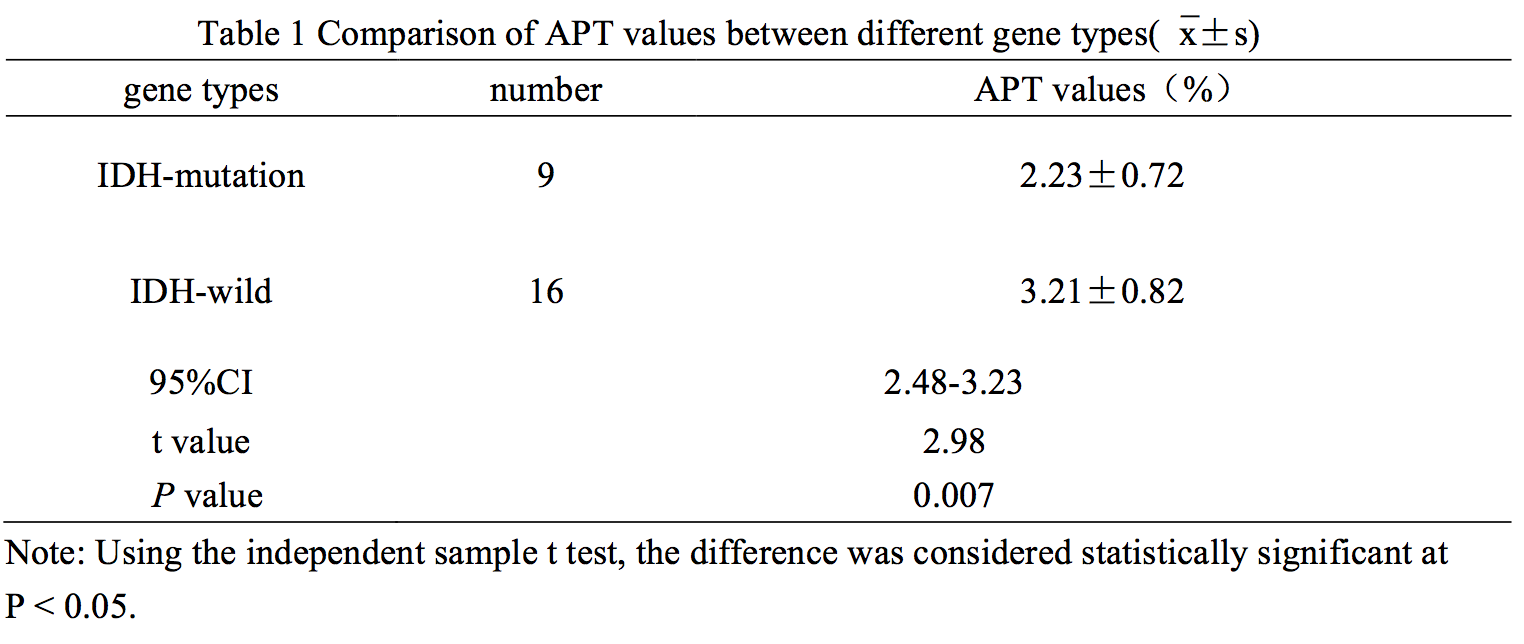
Table 1 Comparison of APT values between different gene types(`x±s)