2855
T1 relaxation time in the rotating frame MR imaging of gliomas:efficacy in preoperative grading1Department of Medical Center, Nanfang hospital, Southern Medical University, Guangzhou, China, 2Philips Healthcare, Guangzhou, China, 3Philips Healthcare, Hongkong, China
Synopsis
Accurate glioma grading is crucial for therapeutic strategy and prognosis. T1ρ MRI could probe the interactions between motion-restricted water and macromolecules in tissues. Our study aimed to determine the diagnostic efficiency of T1ρ MRI in glioma grading. Significant differences were found by rT1ρ between low- and high-grade, WHO grade Ⅱ and Ⅲ, WHO grade Ⅱ and Ⅳ gliomas when we placed the ROIs in the solid portion and the peritumoral portion respectively. rT1ρ demonstrated a high diagnostic performance in the solid portion and a moderate diagnostic performance in the peritumoral portion in grading. T1ρ MRI has potential to be a noninvasive quantitative method for preoperatively grading gliomas.
Introduction
Accurate glioma grading is crucial for therapeutic strategy and prognosis. To our knowledge, histopathologic assessment is an invasive procedure that leads to inherent sampling error without regarding for tumor heterogeneity depended on sterotactic biopsy or surgery resection1.T1 relaxation time in the rotating frame (T1ρ) MRI, which occurs at a range of frequencies during the application of the spin-lock pulse, is sensitive to low-frequency motion that it could be applied to probe the interactions between motion-restricted water and macromolecules in tissues2. Up to now, T1ρ MRI has only been implemented in cerebral gliomas based on the animal model3,4. Therefore, the present study aimed to determine the diagnostic efficiency of T1ρ MRI in glioma grading at 3.0T.Methods
38 patients (Mean age 39.1 yrs; 14F/24M) with histopathologic confirmed glioma who underwent T1ρ MRI at 3T were enrolled, including 22 low-grade gliomas (WHO grade Ⅱ) and 16 high-grade gliomas (7 WHO grade Ⅲ and 9 WHO grade Ⅳ). MRI sequences were acquired with a Phillips Achieva TX 3.0 Tesla scanner using an 8-channel phased-array head coil. T1ρ-weighted images were collected by 3D turbo spin echo (TSE) technique with the following parameters: TR/TE = 4800/229 ms; matrix = 240 × 240; FOV = 250 mm × 250 mm; slice thickness = 1.8 mm; number of slices =100; spin lock frequency = 500 Hz; spin lock time (TSL) = 0, 20, 40, 60, 80, 100 ms. In T1ρ relaxation map, three ROIs were positioned in the solid portion and the peritumoral portion of tumor respectively. The averaged value of three ROIs were calculated and standardized as a ratio of T1ρ value (rT1ρ) by placing three same size ROIs in normal white/gray matter of the contralateral hemisphere. Comparisons between different grades gliomas were performed. Receiver operating characteristic (ROC) analyses were conducted to determine the diagnostic performance for grading.Results
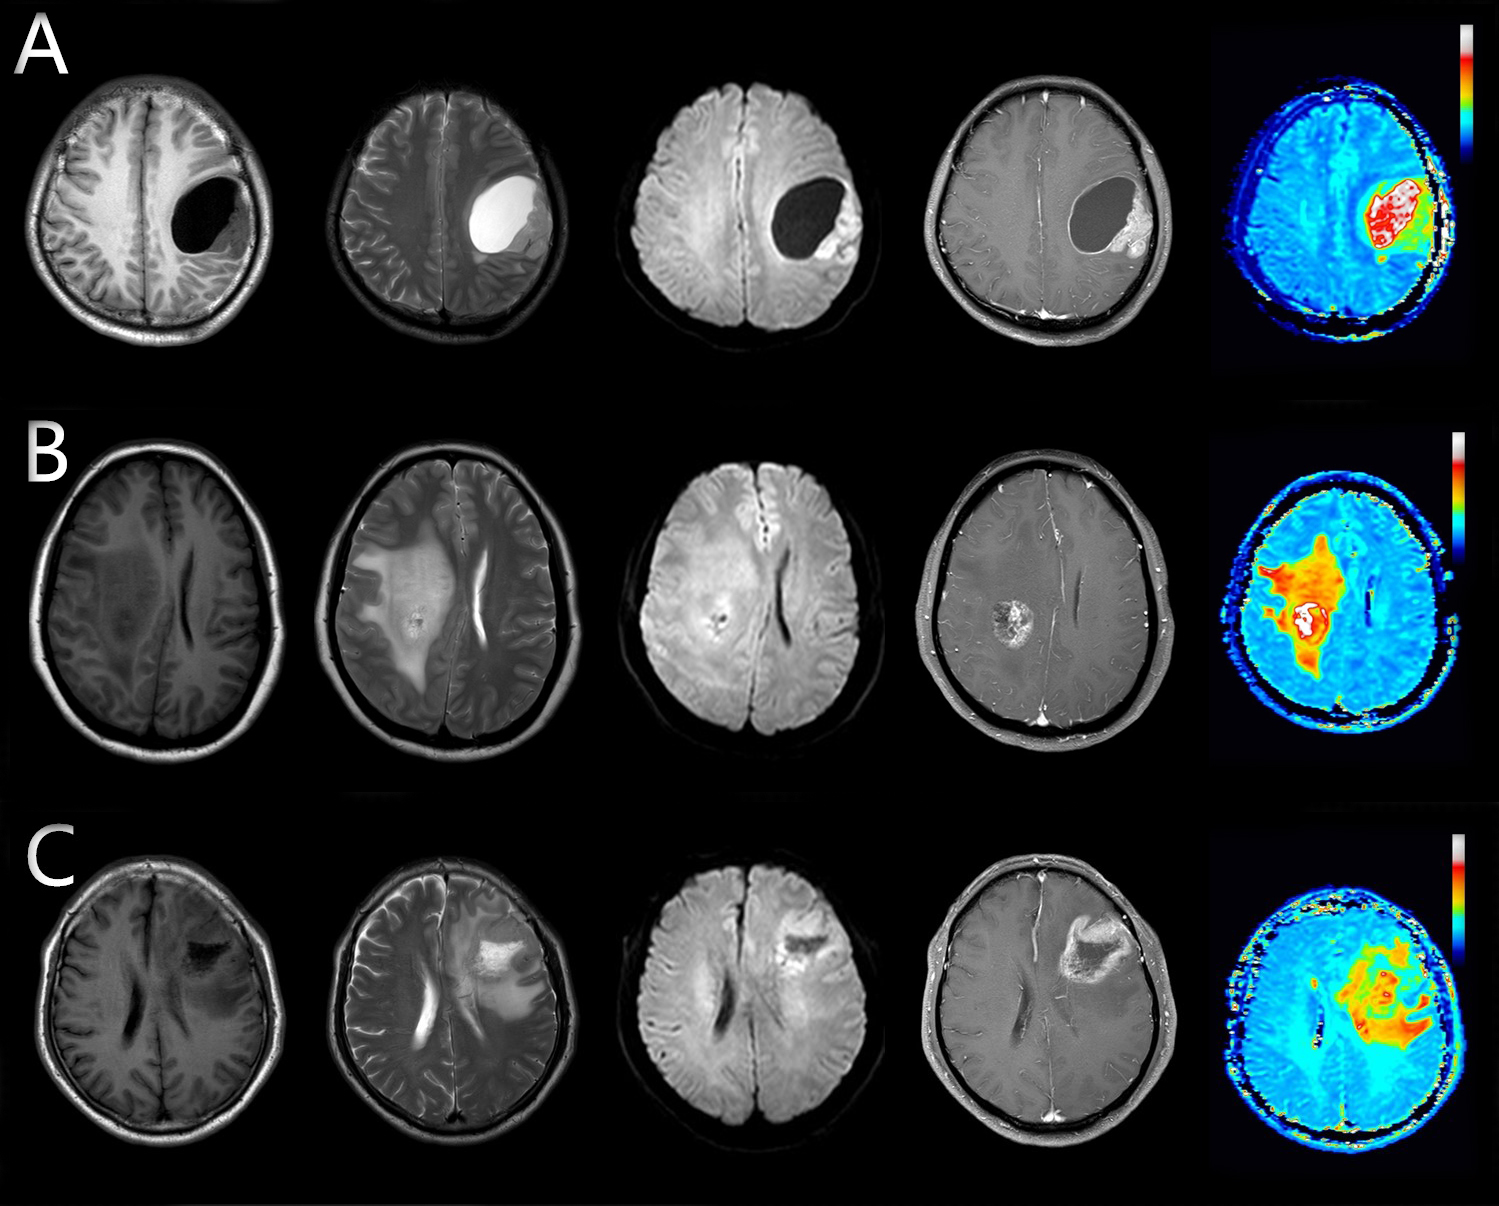
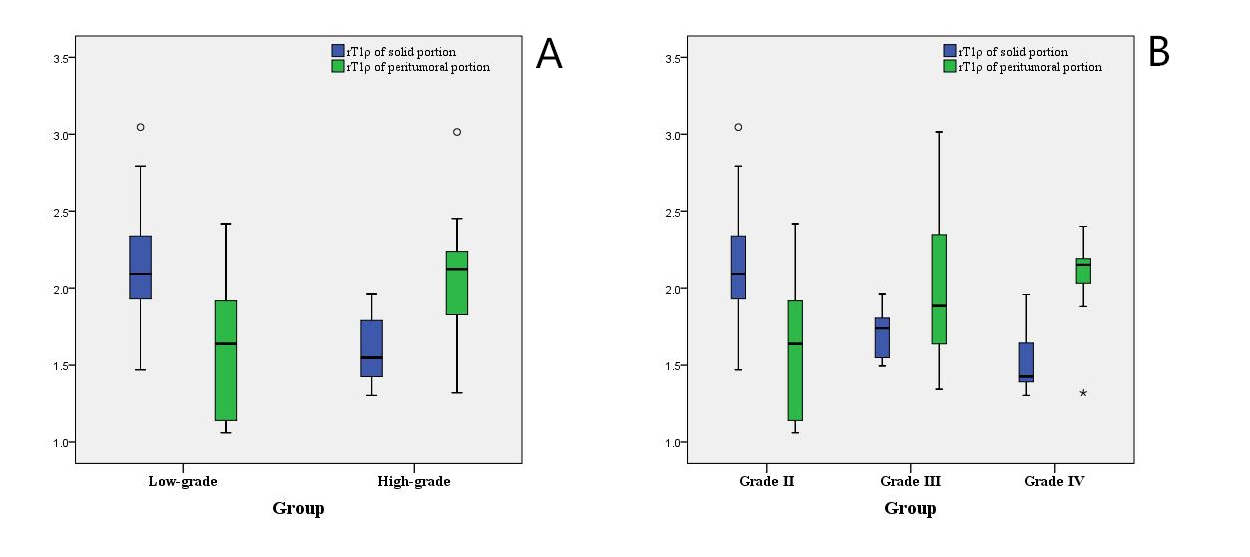
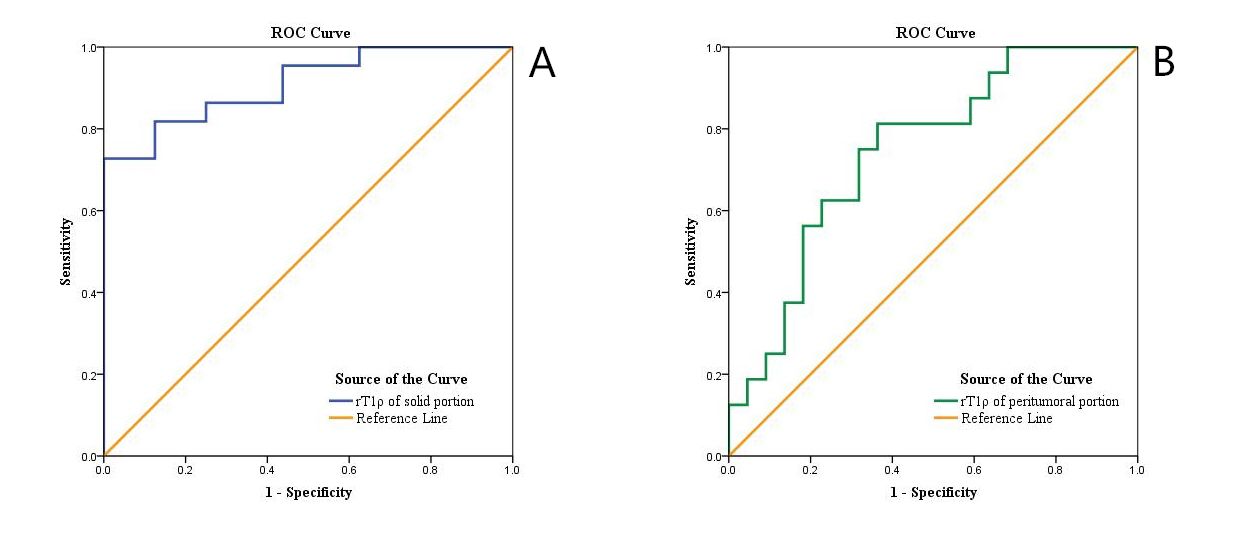
Figure 1 shows representative images of 3 cases of different grades gliomas. In the solid portion, rT1ρ of high-grade group was significantly lower than that of low-grade group (P<0.001). To the contrary, higher rT1ρ was found in high-grade group than in low-grade group in the peritumoral portion (P<0.01) (Table1 and Figure 2A). When classified according to WHO grades, WHO grade Ⅱ group had higher rT1ρ of solid portion compared with WHO grade Ⅲ (P<0.01) and Ⅳ group (P<0.001) separately. WHO grade Ⅱ group had lower rT1ρ of peritumoral portion compared with WHO grade Ⅲ (P<0.05) and Ⅳ group (P<0.05) separately. No significant differences were found between WHO grade Ⅲ and Ⅳ group in rT1ρ, of solid portion or peritumoral portion (both P >0.05) (Table 2, Figure 2B). rT1ρ of solid portion achieved an AUC value of 0.909, and the cut-off value of 1.964 exhibited a sensitivity of 73% and a specificity of 100% for identifying low-grade group. With AUC value of 0.744, rT1ρ of peritumoral portion show 81.3% sensitivity and 63.6% specificity for identifying high-grade group at the cut-off value of 1.750 (Table 3, Figure 3).
Discussion
In the solid portion, rT1ρ of high-grade gliomas was significantly lower than that of low-grade gliomas. The dominant factor influencing difference of rT1ρ values between different grades of gliomas is cell density. Theoretically, dense tumor cells in advanced gliomas may compress extracellular space and impede free water movement which is accompanied by the increase of water associated with macromolecules4,5, and thus leads to a decreased rT1ρ value. In the peritumoral portion, higher rT1ρ value was demonstrated in high-grade gliomas than in low-grade gliomas. We consider that peritumoral edema associated with gliomas was not only caused by extensive infiltration of glioma cells, but malignant cell infiltration is more likely to destruct the extracellular matrix ultrastructure and consequently aggravate free water movement in high-grade gliomas6. In this present study, we demonstrated a high diagnostic performance by rT1ρ of solid portion for differentiating low- from high-grade gliomas with excellent sensitivity of 100%. Moreover, rT1ρ of peritumoral portion also performed a moderate diagnostic performance for differentiating high- from low-grade gliomas.Conclusion
The results of our clinical study suggest that T1ρ MRI is potential to be a noninvasive quantitative method for preoperatively grading gliomas.Acknowledgements
No acknowledgement found.References
1. Law M, Yang S, Wang H, et al. Glioma grading: sensitivity, specificity, and predictive values of perfusion MR imaging and proton MR spectroscopic imaging compared with conventional MR imaging. AJNR Am J Neuroradiol. 2003; 24:1989-1998.
2. Li X, Benjamin Ma C, Link TM, et al. In vivo T1ρ and T2 mapping of articular cartilage in osteoarthritis of the knee using 3T MRI. Osteoarthr Cartilage. 2007; 15:789-797.
3. Sierra A, Michaeli S, Niskanen JP, et al. Water spin dynamics during apoptotic cell death in glioma gene therapy probed by T1rho and T2rho. Magn Reson Med. 2008; 59:1311-1319.
4. Kettunen MI, Sierra A, Narvainen MJ, et al. Low spin-lock field T1 relaxation in the rotating frame as a sensitive MR imaging marker for gene therapy treatment response in rat glioma. Radiology. 2007; 243:796-803.
5. Virta A, Komu M, Kormano M. T1rho of protein solutions at very low fields: dependence on molecular weight, concentration, and structure. Magn Reson Med. 1997; 37:53-57.
6. Morita K, Matsuzawa H, Fujii Y, Tanaka R, Kwee IL, Nakada T. Diffusion tensor analysis of peritumoral edema using lambda chart analysis indicative of the heterogeneity of the microstructure within edema. J Neurosurg. 2005; 102:336-341.
Figures
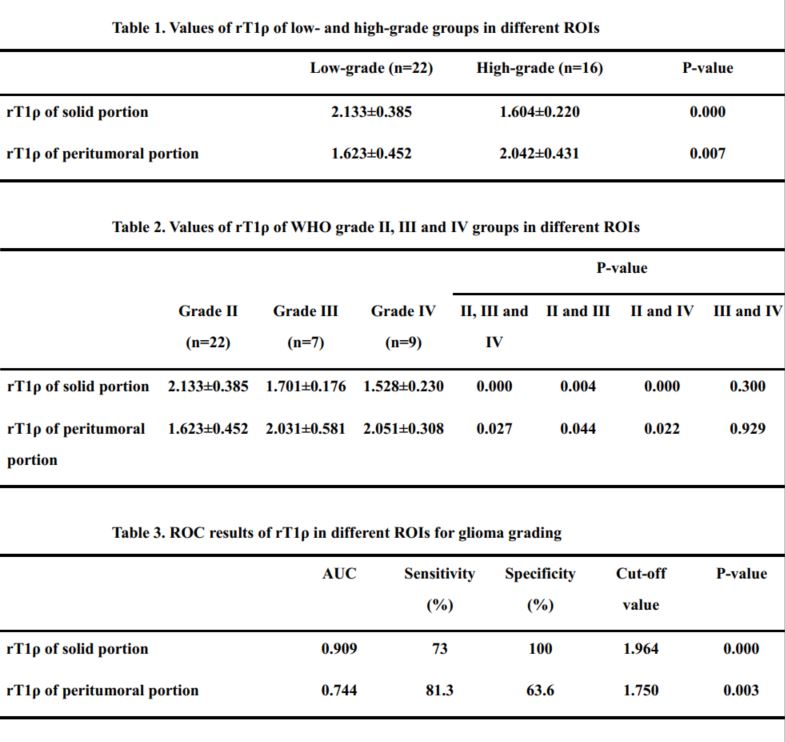
Table 1. Values of rT1ρ of low- and high-grade groups in different ROIs
Table 2. Values of rT1ρ of WHO grade Ⅱ, Ⅲ and Ⅳ groups in different ROIs
Table 3. ROC results of rT1ρ in different ROIs for glioma grading