2853
Diagnostic accuracy of T1-weighted Dynamic Contrast-enhanced-MRI and Dynamic Susceptibility MRI for Differentiation of Glioblastoma and Primary CNS Lymphoma1Future Diagnostic Radiology, Osaka University, Suita, Osaka, Japan, 2Radiology, Osaka University, Suita, Japan, 3Neurosurgery, Osaka University, Suita, Japan
Synopsis
We retrospectively studied 33 consecutive patients with a diagnosis of GBM or PCNSL performed both DCE and DSC imaging. The rCBV of GBM are significantly larger, and Ktrans of GBM was significantly lower than that of PCNSL in CE ROIs. There was no significant difference between two tumors in CE ROI about other DCE parameters, Ve, Vp Kep and surrounding ROIS. The ROC analysis performed with respect to the GBM and PCNSL groups revealed that 90% tile rCBV and 50% tile of Ktrans showed the largest area under the curve (AUC) of 0.949 and 0.815, respectively. PCNSL can be differentiated from GBM with rCBV value and Ktrans. rCBV was superior to Ktrans in differentiating two tumors and Ktrans had no additional value in differentiating these tumors.
Background and Purpose
MRI features of primary central nervous system lymphoma (PCNSL) and glioblastoma (GBM) are highly variable and sometimes similar complicating differentiation solely by conventional MRI[1, 2]. In order to provide surgical plans and optimal treatments for GBM and PCNSL, preoperative differential diagnosis is quite important. Many previous studies have aimed to differentiate GBM from PCNSL using advanced imaging, such as diffusion-weighted imaging (DWI), perfusion MRI and texture analysis, etc. Two perfusion parameters, dynamic susceptibility contrast (DSC) and dynamic contrast-enhanced (DCE) –MRI, were reported separately, so there were few reports to compare DSC and DCE with one examination. The purpose of this study was to explore the potential use of the DSC and DCE -PWI to differentiate PCNSL and GBM.Methods
We retrospectively studied 33 consecutive patients with a diagnosis of GBM or PCNSL performed both DSC and DCE imaging between 2014 and 2018. All patients had an untreated enhanced tumor and undergone routine brain MRI, DCE and DSC PWI before surgical resection. Patients consisted of 20 Glioblastoma (male 16, female 4, mean age= 57 yr.: 24-83yr) and 13 PCNSL (male 9, female 4, average age=69 yr.: 44-83yr). Two GBM cases and one PCNSL case were excluded due to massive hemorrhage or artifact from oral metals. MR was performed 3T scanner as following sequences; Precontrast sequence: T1WI, T2WI, DWI, and FLAIR, DCE imaging: 0.1ml/Kg Gd-DOTA 3ml/s with saline flash, 3D-SPGR: TR/TE=3.3/1.5ms, FA=14°,Matrix 192X192, FOV 256mm, slice thickness 7mm X 20 slice , DSC imaging: 0.1 ml/kg Gd-DOTA 3ml/s, GRE-EPI: TR/TE = 2000/21 ms, FA = 60°, matrix 96×128, FOV 220 mm, slice thickness = 5 mm, 20 slices 1 mm gap and post contrast 3D-T1WI. Image analysis was performed by Olea Sphere 3.0 (Olea Medical), DCE analysis by extended Toft model, and DSC analysis: by Bayesian model. Slice fusion for FLAIR, CE-T1WI, DCE image, DSC image was performed and two ROI was set in contrast enhanced (CE) area and surrounding T2 prolonged area. Histogram analysis of each two ROIs was performed and calculated the Mean, SD, 50%, 90%, 100% tile values. An unpaired t-test was used to compare the difference in each histogram parameter between GBM and PCNSL. The receiver operating characteristic (ROC) curve analyses were performed to determine optimum thresholds and diagnostic accuracy.Results
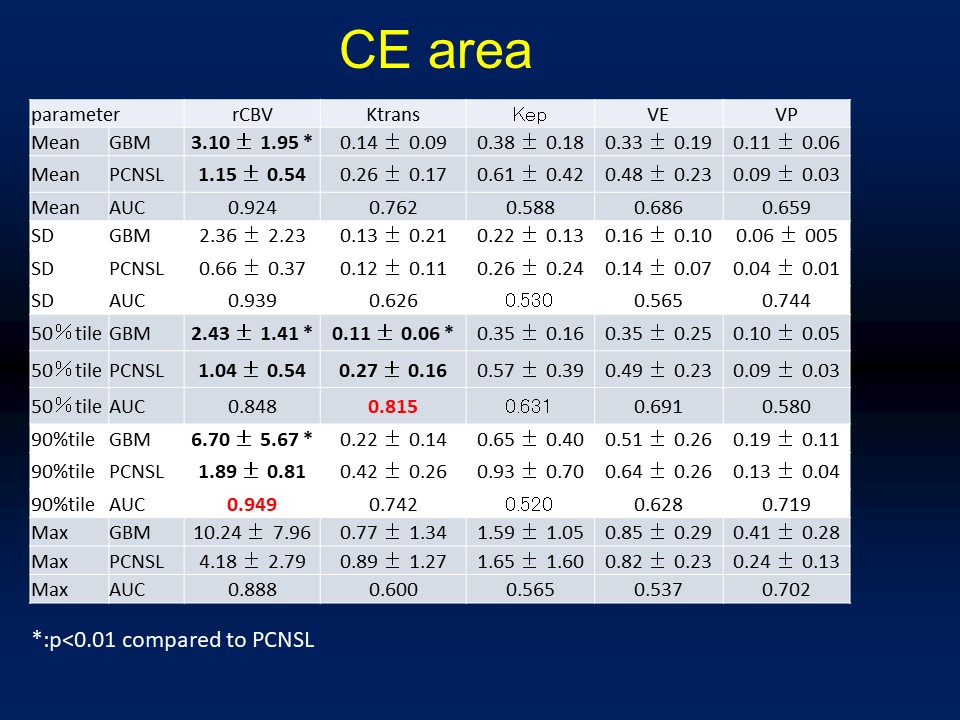
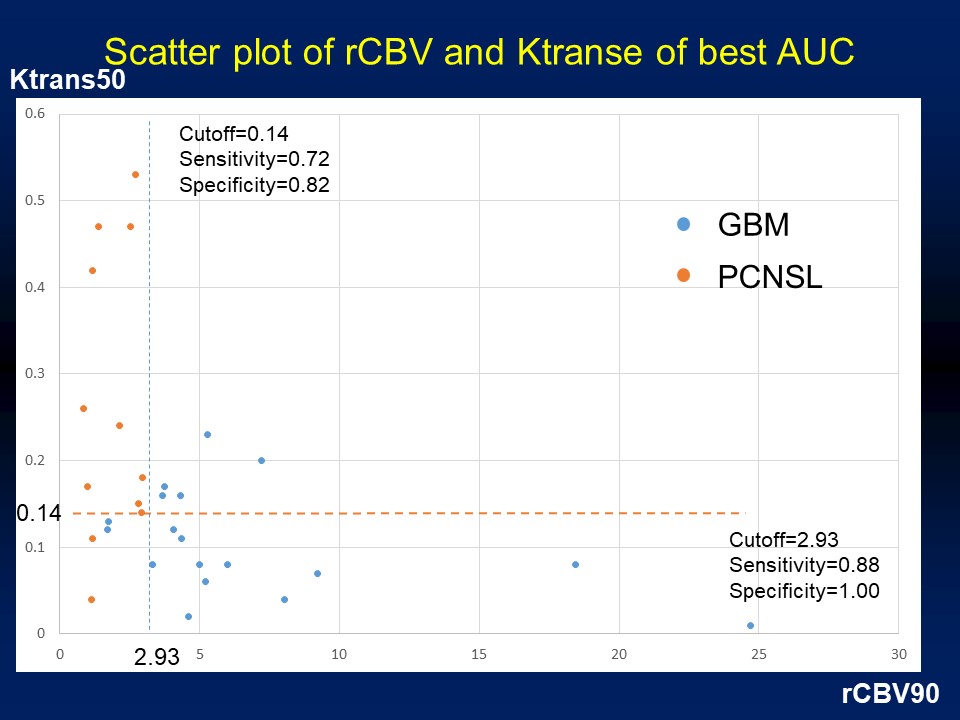
The rCBV of GBM are significantly larger, and Ktrans of GBM was significantly lower than that of PCNSL in CE ROIs (Table). There was no significant difference between two tumors in CE ROI about the other DCE parameters, Ve, Vp Kep and surrounding ROISs. The ROC analysis performed with respect to the GBM and PCNSL groups revealed that the 90% tile rCBV and 50% tile of Ktrans showed the largest area under the curve (AUC) of 0.949 and 0.815, respectively. Figure shows the scatter plots of the 90% tile rCBV and 50% tile Ktrans. rCBV showed good performance in differentiating GBM and ML, and Ktrans had no additional information to distinguish the two tumors.Discussion
There are many previous reports about rCBV or DCE parameters differentiating GBM from PCNSL [3-8], and rCBV has a propensity to show large AUC values. However, there were only few reports about combining these two methods. DSC and DCE are different parameters of tumor perfusion and permeability. In terms of malignant tumor differentiation between GBM and ML, DCE was of low importance.Conclusions
PCNSL can be differentiated from GBM with rCBV value and Ktrans. rCBV was superior to Ktrans in differentiation two tumors and Ktrans had no additive value to differentiate these tumors.Acknowledgements
NoneReferences
1. Koeller, K.K., J.G. Smirniotopoulos, and R.V. Jones, Primary central nervous system lymphoma: radiologic-pathologic correlation. Radiographics, 1997. 17(6): p. 1497-526.
2. Rees, J.H., et al., Glioblastoma multiforme: radiologic-pathologic correlation. Radiographics, 1996. 16(6): p. 1413-38; quiz 1462-3.
3. Lu, S., et al., Utility of dynamic contrast-enhanced magnetic resonance imaging for differentiating glioblastoma, primary central nervous system lymphoma and brain metastatic tumor. Eur J Radiol, 2016. 85(10): p. 1722-1727.
4. Kickingereder, P., et al., Evaluation of microvascular permeability with dynamic contrast-enhanced MRI for the differentiation of primary CNS lymphoma and glioblastoma: radiologic-pathologic correlation. AJNR Am J Neuroradiol, 2014. 35(8): p. 1503-8.
5. Murayama, K., et al., Differentiating between Central Nervous System Lymphoma and High-grade Glioma Using Dynamic Susceptibility Contrast and Dynamic Contrast-enhanced MR Imaging with Histogram Analysis. Magn Reson Med Sci, 2017.
6. Nakajima, S., et al., Differentiation between primary central nervous system lymphoma and glioblastoma: a comparative study of parameters derived from dynamic susceptibility contrast-enhanced perfusion-weighted MRI. Clin Radiol, 2015. 70(12): p. 1393-9.
7. Toh, C.H., et al., Differentiation of primary central nervous system lymphomas and glioblastomas: comparisons of diagnostic performance of dynamic susceptibility contrast-enhanced perfusion MR imaging without and with contrast-leakage correction. AJNR Am J Neuroradiol, 2013. 34(6): p. 1145-9.
8. Ma, J.H., et al., Differentiation among glioblastoma multiforme, solitary metastatic tumor, and lymphoma using whole-tumor histogram analysis of the normalized cerebral blood volume in enhancing and perienhancing lesions. AJNR Am J Neuroradiol, 2010. 31(9): p. 1699-706.
Figures