2852
Initial Condition Assessment from Patient MRI Data for Reaction-Diffusion Glioma Growth Models1Hôpital Erasme (ULB), Bruxelles, Belgium, 2Laboratories of Image, Signal processing and Acoustics (ULB), Bruxelles, Belgium
Synopsis
Reaction-diffusion tumour growth models have been proposed to assess glioma invasion beyond the MR visible margins as well as for patient follow-up and radiotherapy planning. However, initial tumour cell density assessment from patient imaging data remains an open problem, limiting the clinical application of the model. In this work, three initialisation methods are proposed and simulations from actual glioblastoma patient imaging data are compared. This work demonstrates the strong dependence of the model in its initial condition and highlights the need to integrate additional MR sequences and modalities for the assessment of a patient-specific tumour cell density profile.
Introduction
Gliomas are the most common primary brain tumours and are associated with poor prognosis. Their diagnosis and follow-up usually rely on magnetic resonance imaging. However, due to its limited sensitivity, this technique does not allow to assess tumour invasion for low cell densities. Tumour growth models have been proposed to address this problem as it defines a tumour cell density function over the whole brain.
During the last decade, considerable efforts have been made to improve reaction-diffusion growth models for their simplicity and in clinical applicability1-4. Those models propose a partial differential equation for the spatial-temporal evolution of the tumour cell density:
$$\frac{\partial c\left(\bar{r},t\right)}{\partial t}=\bar{\triangledown}\cdot\left(\bar{\bar{D}}\left(\bar{r}\right)\bar{\triangledown}c\left(\bar{r},t\right)\right)+\rho\left(\bar{r}\right) c\left(\bar{r},t\right)\left(1-c\left(\bar{r},t\right)\right)$$
where $$$c\left(\bar{r},t\right)$$$ is the normalized cell density (with values between 0 and 1, 1 corresponding to the maximum cell density that can be hold) at position $$$\bar{r}$$$ and time $$$t$$$ and $$$\bar{\bar{D}}\left(\bar{r}\right)$$$ and $$$\rho\left(\bar{r}\right)$$$ are respectively the tumour cell diffusion tensor and proliferation rate at position $$$\bar{r}$$$.
However, for the model to be clinically applicable one major limitation remains unsolved, that is the model initial condition assessment from patient imaging data. In this work, we explore and compare three methods to assess the initial tumour cell density from actual glioblastoma patient imaging data at 3T.
Methods
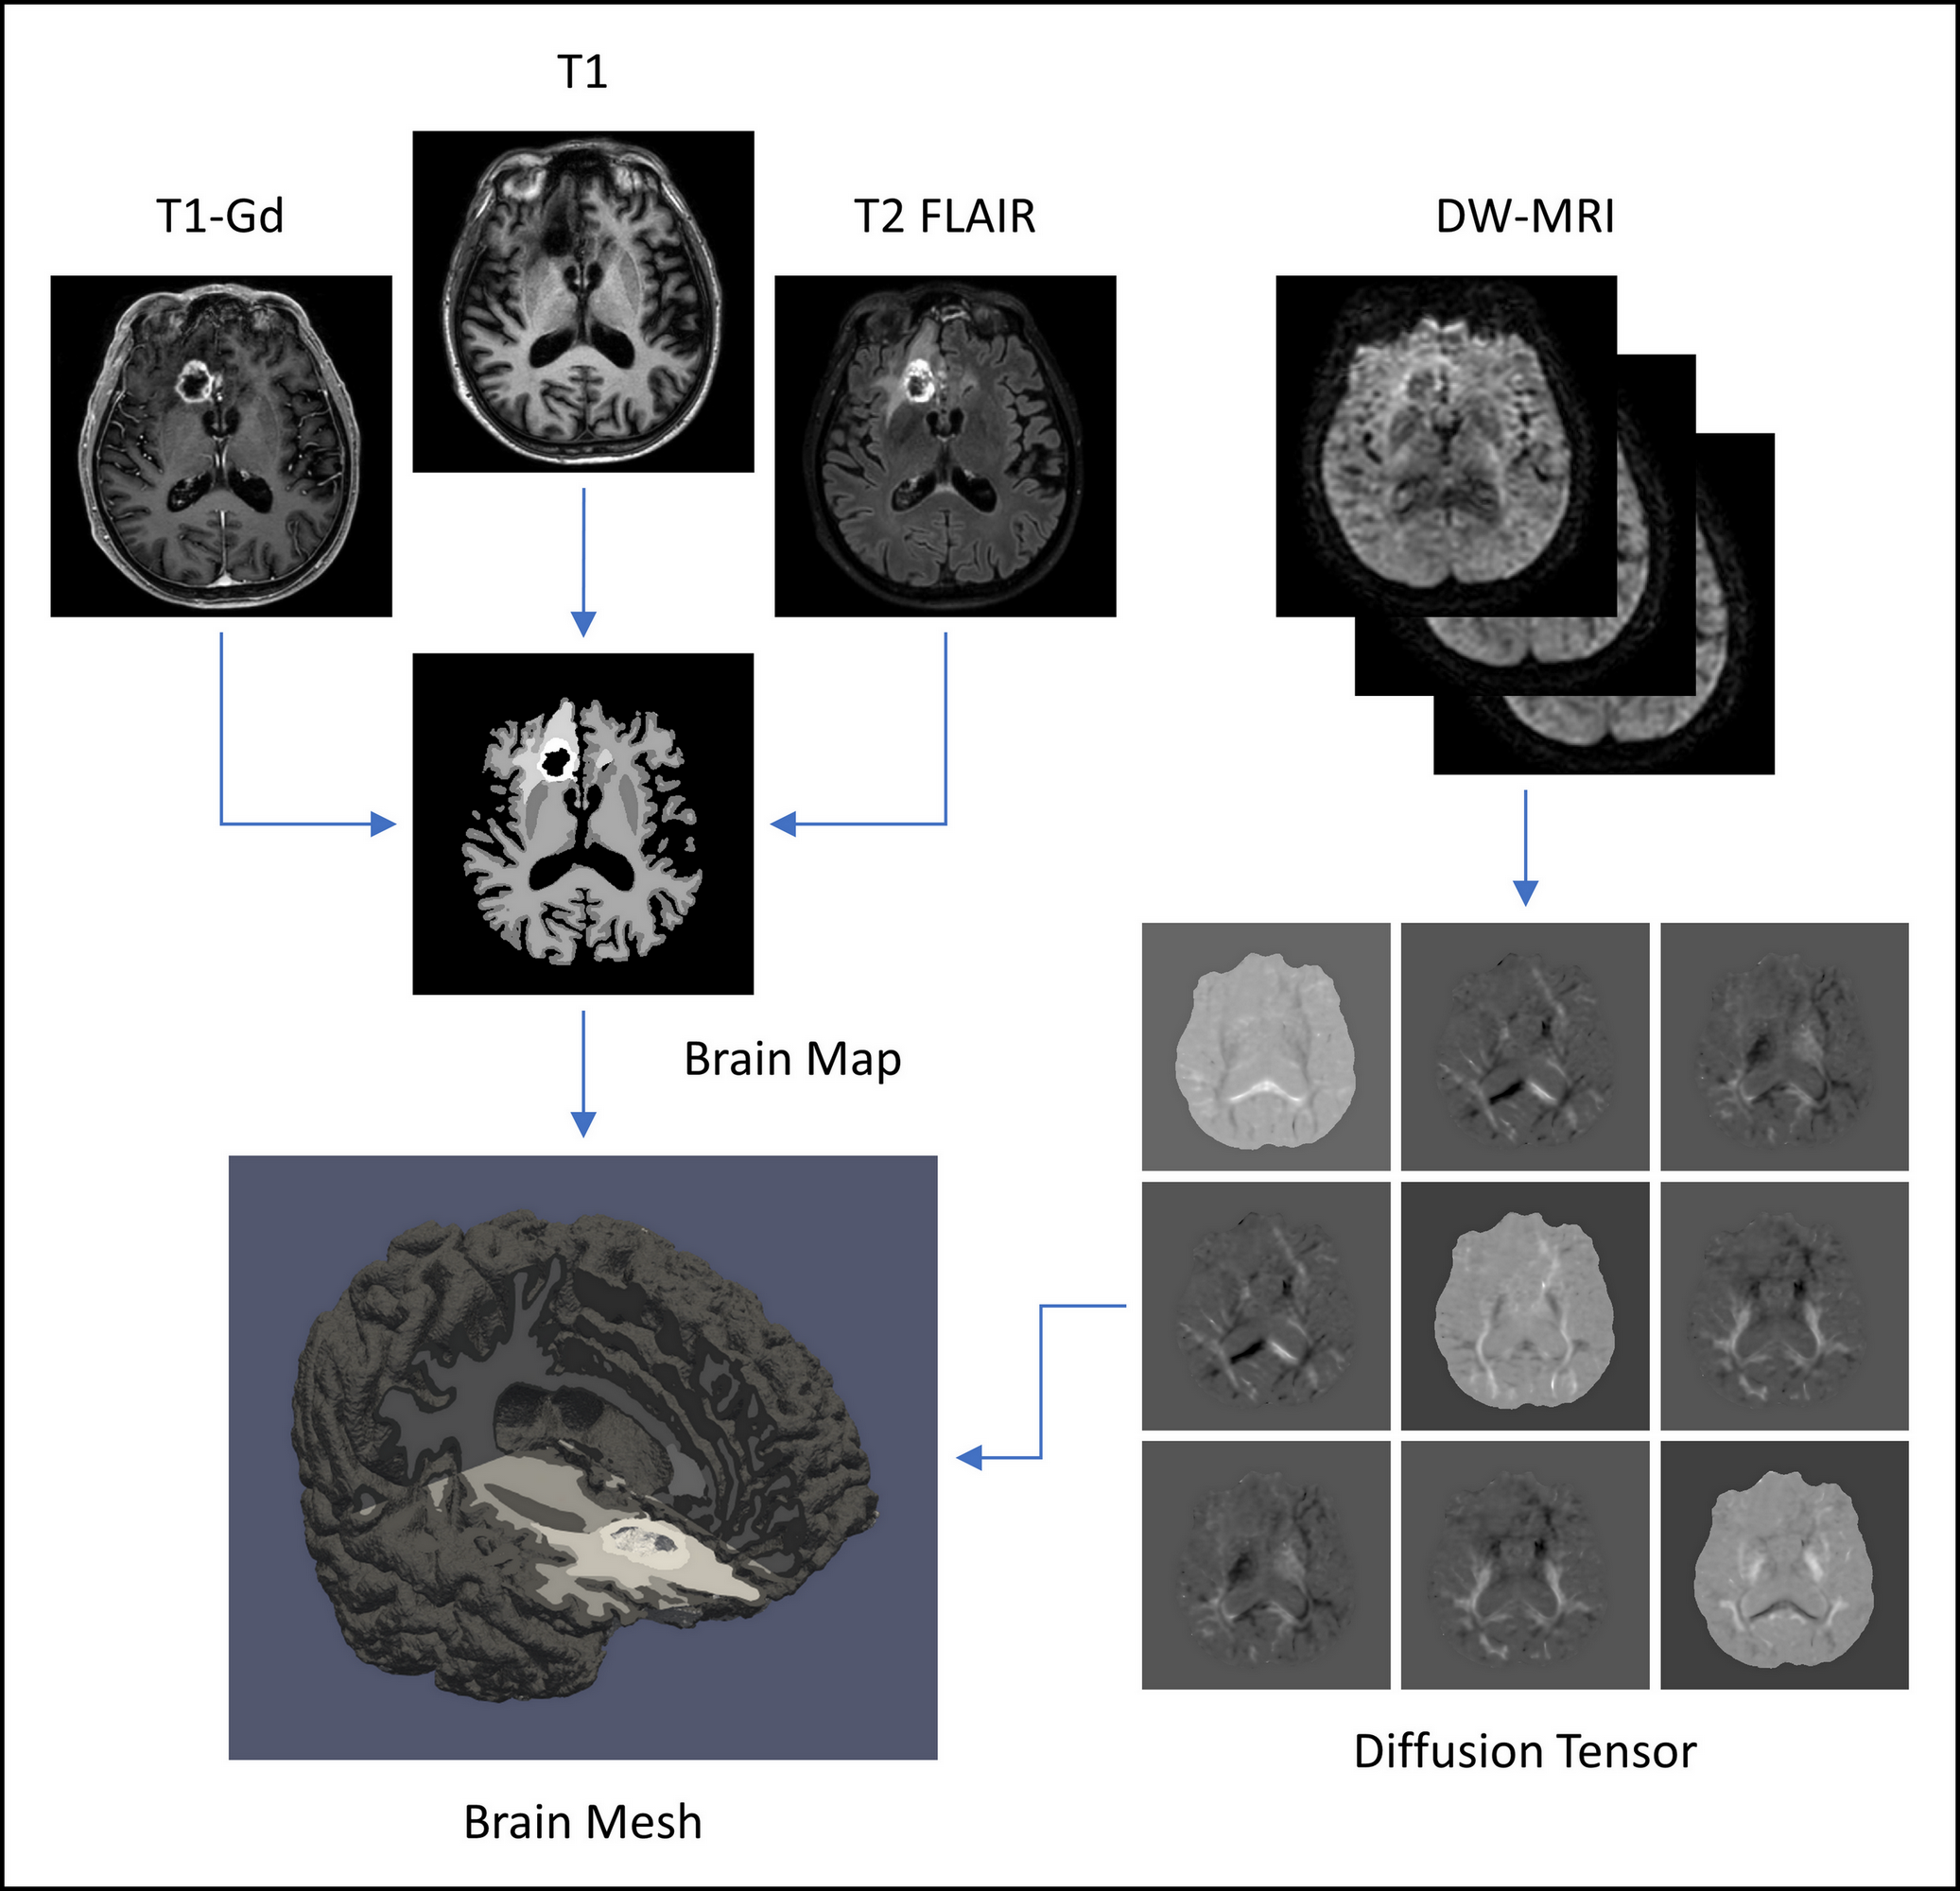
Brain Mesh Generation: A patient-specific tissue-compatible tetrahedral mesh was first generated as depicted in Figure 1.
Tumour Cell Diffusion Tensor: Since tumour cells are known to migrate along brain fibres5, a tumour cell diffusion tensor was derived from diffusion tensor imaging (DTI) acquistions. The FSL dtifit tool6 was used after correction for susceptibility field7 and eddy currents8. Tensor anisotropy increase and diffusion rate scaling were applied for more realistic simulations5.
Proliferation Rate: To take into account the aggressiveness inhomogeneity of brain tumours, different proliferation rate values were considered for the tumour T1-Gd enhancing core and the brain parenchyma.
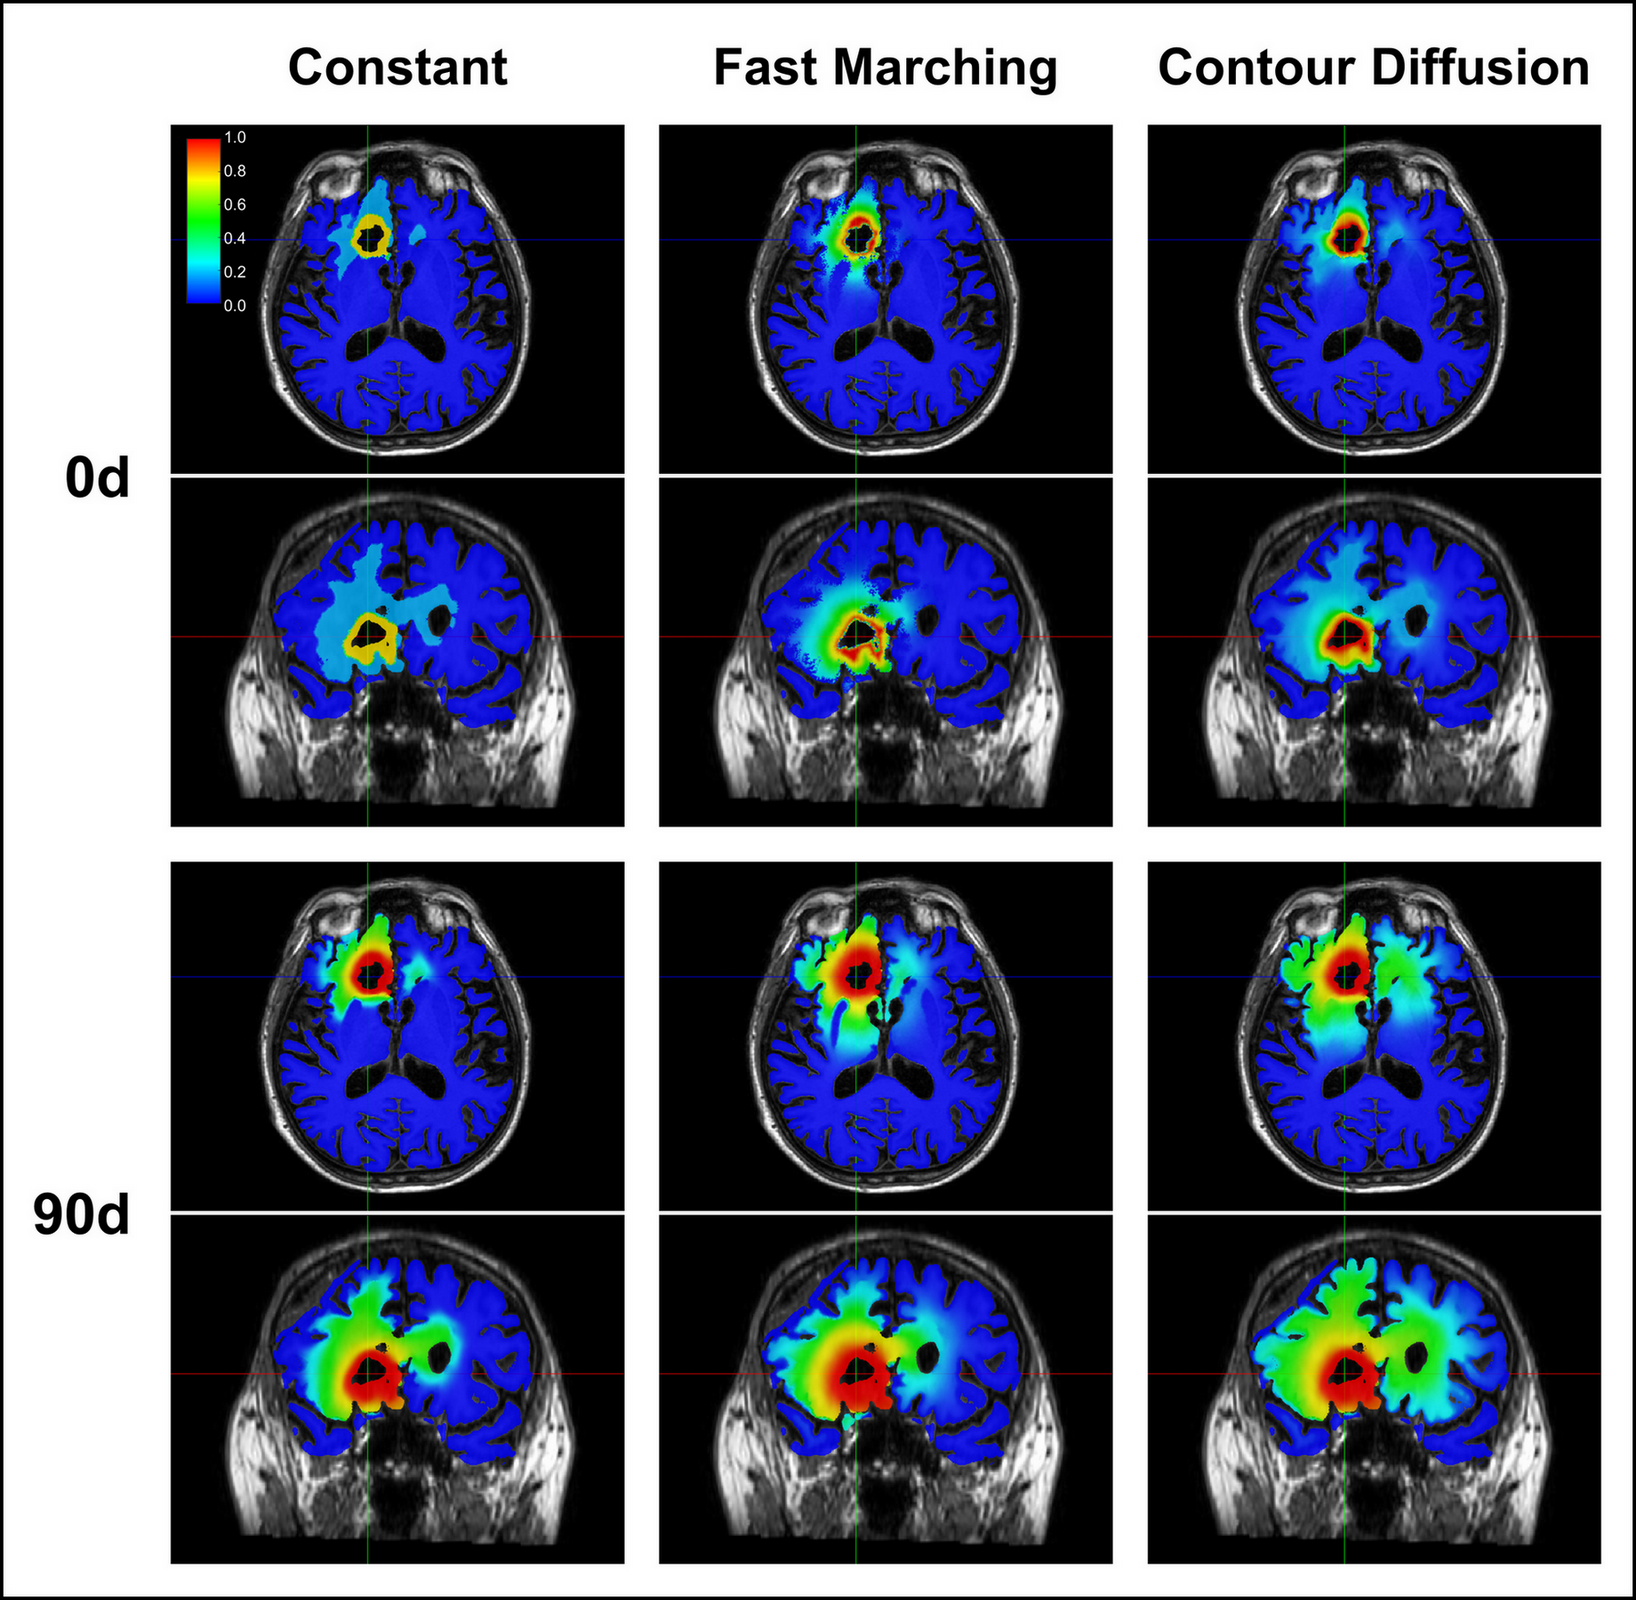
Initial Density: Three methods were investigated for the initial tumour cell density assessment. The first one assigns a constant cell density value of 0.8, 0.16 and 0.02 to the enhancing core, the oedema and the brain parenchyma respectively.
The second one generates a distance map from the enhancing core outer boundary computed using the isotropic fast-marching algorithm, taking into account the relative diffusion rate between white and grey matter. Assuming an exponentially decreasing density profile, the tumour infiltration depth is computed by:
$$\lambda=-\frac{d_{mean}}{\ln\left(\frac{iso_{oedema}}{iso_{core}}\right)}$$
where $$$d_{mean}$$$ is the mean tumour extension – average distance value over the oedema outer boundary – and $$$iso_{oedema}$$$ and $$$iso_{core}$$$ are respectively the cell density isovalues on the enhancing core and oedema outer boundaries, set to 0.8 and 0.16 for the simulations2.
The initial cell density in every voxel brain voxel is finally given by:
$$c\left(\bar{r}\right)=iso_{core}\exp\left(-\frac{d\left(\bar{r}\right)}{\lambda}\right)$$
where $$$d\left(\bar{r}\right)$$$ is the distance map value of the voxel located at position $$$\bar{r}$$$.
The third method defines the initial cell density by solving:$$\begin{cases}\bar{\triangledown}\cdot\left(\bar{\bar{D}}\left(\bar{r}\right)\bar{\triangledown}c\left(\bar{r}\right)\right) = 0\\c\left(\Gamma_i\right) = iso_i& i=1,...,4\end{cases}$$
where $$$\Gamma_{i=1,...,4}$$$ are respectively the necrosis/enhancing core, enhancing core/oedema, oedema/parenchyma, parenchyma/non-brain boundaries and $$$iso_{i=1,...,4}$$$ their respective cell density isovalues, which were set to 1.0, 0.8, 0.16 and 0.0 for the simulations2.
Simulations: The tumour growth process was simulated using a hybrid finite-elements / IMEX Euler finite-differences scheme for the spatial and temporal evolution9.
Results
Simulation results obtained for a 69-year-old male glioblastoma patient who gave his written informed consent are depicted in Figure 2.Discussion
As depicted in Figure 2, the initial condition of the model has a dramatic impact on the simulation results. This highlights the necessity of further investigating the shape of the cell density profile within gliomas and relating it to the patient imaging data. Integration of advanced MRI sequences and positron emission tomography as well as histological data could provide complementary useful information to initialise the model.
Up to now, two methods have been proposed in the literature to assess the tumour cell density within the reaction-diffusion framework. The first one simulates the tumour growth from its emergence at the centre of mass of the enhancing core4. However, there is no guarantee that the tumour indeed emerged from that specific point. The second one uses an analytical approximation of the travelling wave solution of the model equation, however this approximation is only valid for low cell densities beyond the visible margins3.
In this work we investigated three additional methods to assess the initial density. Our future work will compare the simulation results obtained for those methods to actual longitudinal patient follow-up data.
Conclusion
We proposed three different methods to initialise a reaction-diffusion glioma growth model and highlighted the dramatic impact of the initial condition on the simulation results.Acknowledgements
C. Martens is funded by a FRIA grant (F.R.S.-FNRS). This work was supported by the Fonds Erasme and Association Vinçotte Nuclear (AVN).References
- Clatz O, et al. Realistic Simulation of the 3-D Growth of Brain Tumors in MR Images Coupling Diffusion with Biomechanical Deformation. IEEE Trans Med Imaging. 2005;24(10):1334-1346.
- Swanson KR, et al. A Mathematical Modelling Tool for Predicting Survival of Individual Patients Following Resection of Glioblastoma: A Proof of Principle. Br J Cancer. 2008;98(1):113-119.
- Konukoglu E, et al. Image Guided Personalization of Reaction-Diffusion Type Tumor Growth Models Using Modified Anisotropic Eikonal Equations. IEEE Trans Med Imaging. 2010;29(1):77-95.
- Rockne RC, et al. A Patient-Specific Computational Model of Hypoxia-Modulated Radiation Resistance in Glioblastoma Using 18F-FMISO-PET. J R Soc Interface. 2015;12(103):20141174.
- Jbabdi S, et al. Simulation of Anisotropic Growth of Low-Grade Gliomas Using Diffusion Tensor Imaging. Magn Reson Med. 2005;54(3):616-624.
- Jenkinson M, et al. FSL. Neuroimage. 2012;62:782-790.
- Andersson JLR, et al. How to Correct Susceptibility Distortions in Spin-Echo Echo-Planar Images: Application to Diffusion Tensor Imaging. Neuroimage. 2003;20(2):870-888.
- Andersson JLR, et al. An Integrated Approach to Correction for Off-Resonance Effects and Subject Movement in Diffusion MR Imaging. Neuroimage. 2016;125:1063-1078.
- Fritelli M, et al. Lumped Finite Element Method for Reaction-Diffusion Systems on Compact Surfaces. Comput Math Appl. 2017;74(12):3008-3023.
- Li C, et al. Multiplicative Intrinsic Component Optimization (MICO) for MRI Bias Field Estimation and Tissue Segmentation. Magn Reson Imaging. 2014;32(7):913-923.
- The CGAL Project. CGAL User and Reference Manual. CGAL Editorial Board, 4.18 edition, 2018.
Figures