2850
MRI features of the third ventricle subventricular zone suggest differing optic pathway glioma pathology for neurofibromatosis type-1 and sporadic paediatric cases1Developmental Imaging and Biophysics Section, UCL Great Ormond Street Institute of Child Health, London, United Kingdom, 2Radiology Department, Great Ormond Street Children's Hospital, London, United Kingdom, 3Ophthalmology Department, Great Ormond Street Children's Hospital, London, United Kingdom, 4Great Ormond Street Hospital for Children NHS Foundation Trust, Great Ormond Street Children's Hospital, London, United Kingdom, 5Haematology and Oncology Department, Great Ormond Street Children's Hospital, London, United Kingdom
Synopsis
Paediatric optic pathway glioma (OPG) is a low-grade glioma whose cells likely originate from the subventricular zone of the third ventricle (TVZ). Neurofibromatosis type-1 (NF1) OPG is less clinically aggressive than sporadic OPG, being less likely to cause visual function deficit. Using measures of migrating tumour activity, this study analysed the imaging profiles at the TVZ. Apparent diffusion coefficient (ADC) and cerebral blood flow (CBF) profiles associated with migrative tumour cell activity were detected at the TVZ and correlated with poor visual function in sporadic, but not NF1-associated, cases. These results suggest that MRI can identify imaging characteristics that differentiate sporadic and NF1-associated OPG.
Introduction
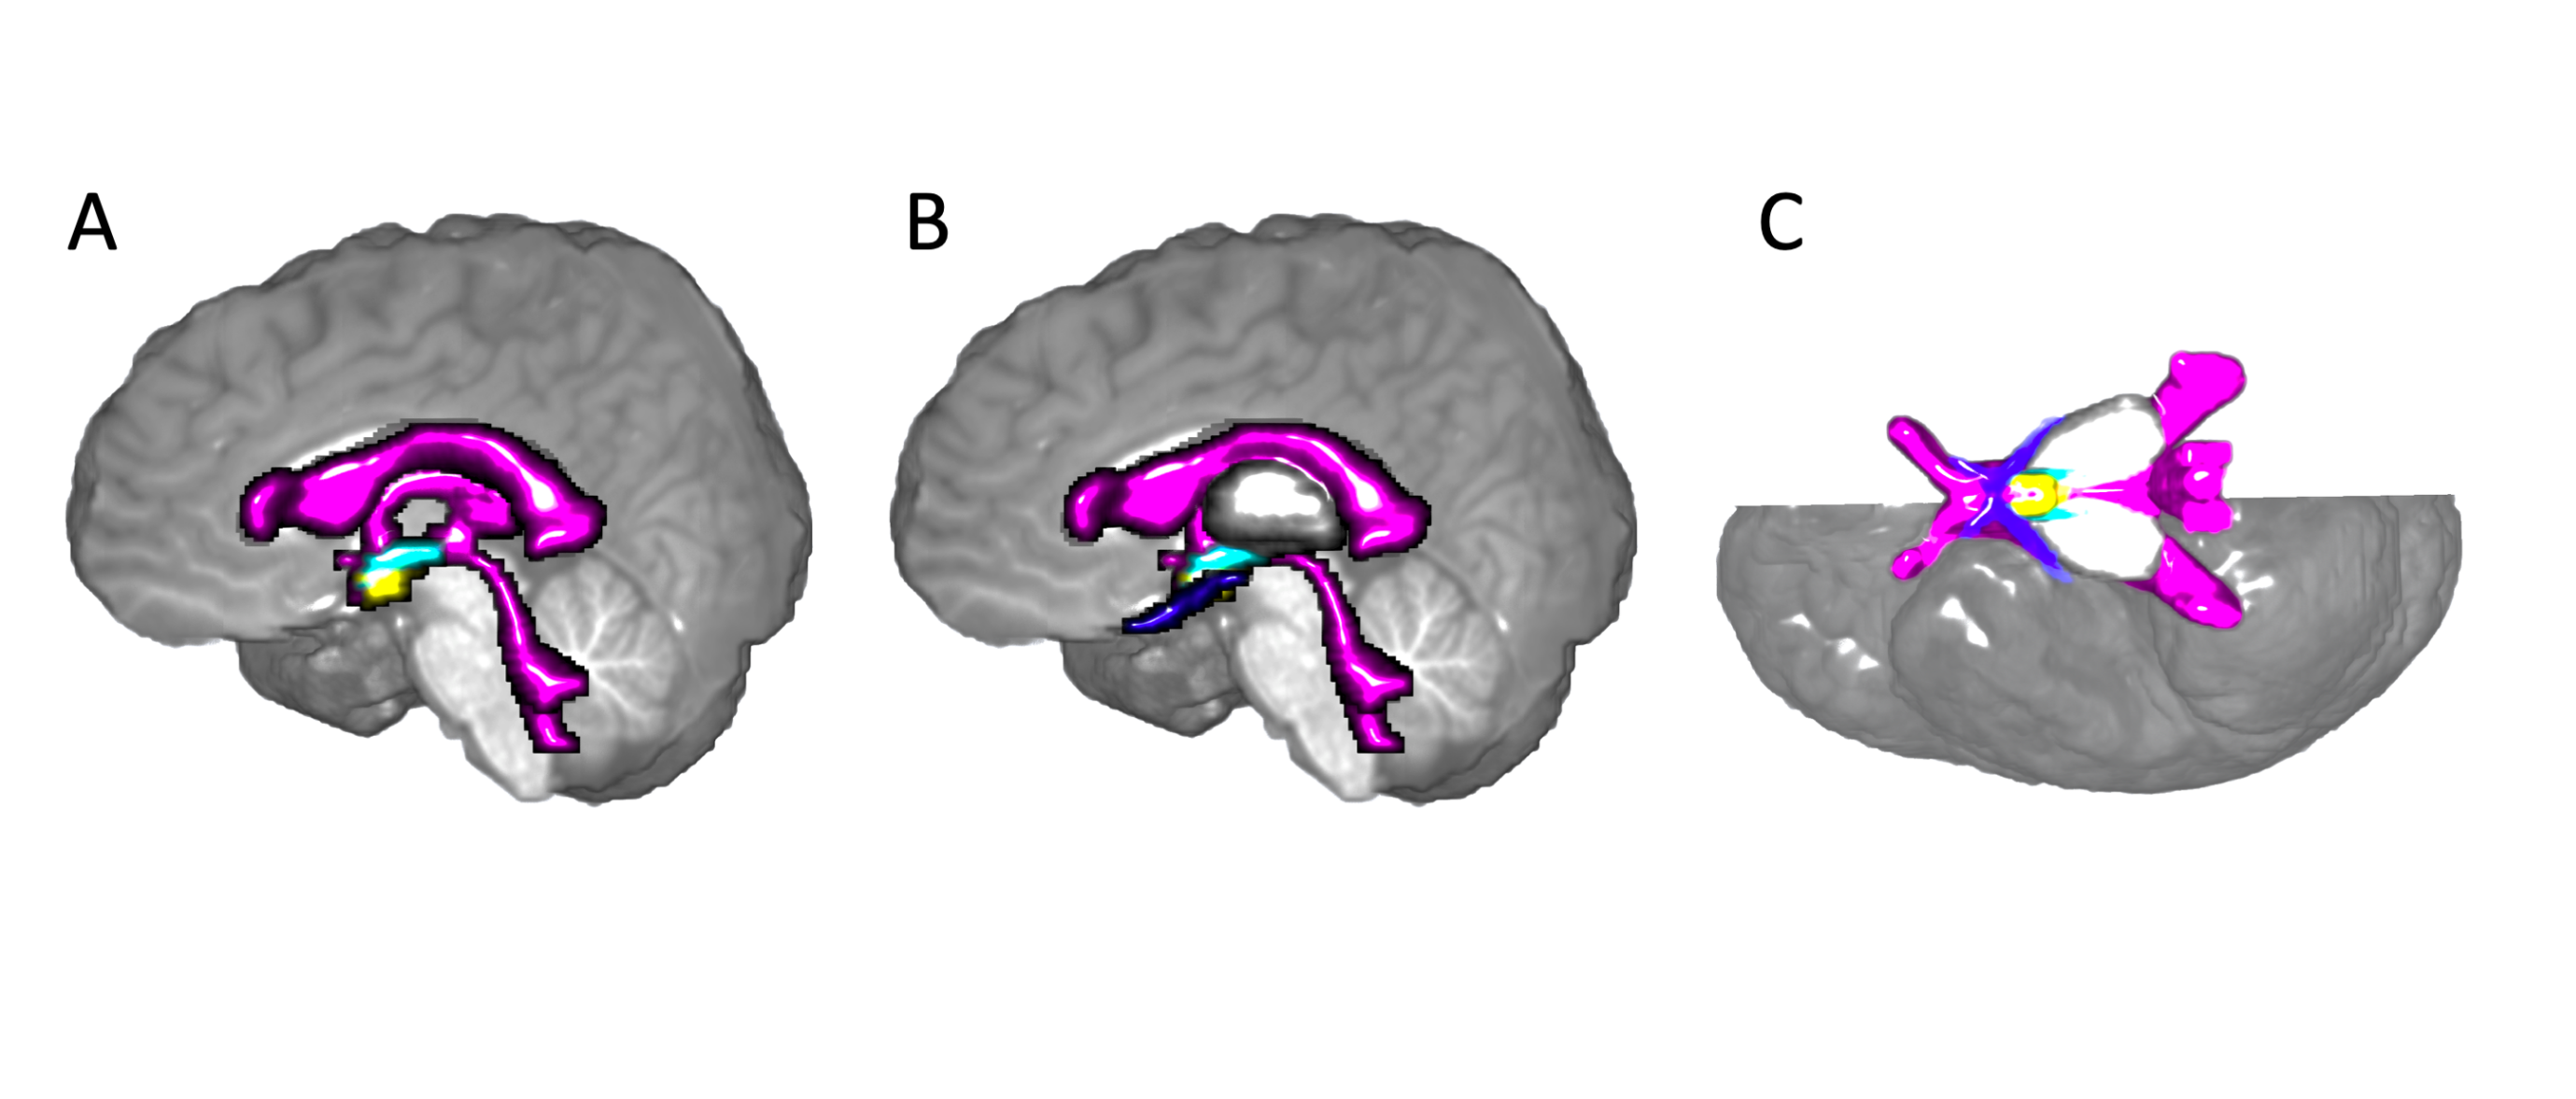
Paediatric optic pathway gliomas (OPG) are predominantly diagnosed as low-grade pilocytic astrocytomas, which are either sporadic or associated with the tumour predisposition syndrome, neurofibromatosis type-1 (NF1). Though histologically similar, sporadic OPG is genetically, and often clinically, different to NF1-associated OPG. Sporadic OPGs generally result in poorer visual acuity (VA) outcome. The subventricular zone of the third ventricle (TVZ) is a germinal stem cell niche and has been identified as the location of OPG cell origin in children 1,2 (Figure 1).
Previous MRI studies have assessed the subventricular zone of the lateral ventricles and their associations with high-grade glioma behaviour.3 These methods have not yet been applied to the TVZ and its associations with OPG outcome. Infiltrative tumour cell activity, not to be mistaken with proliferative tumour activity, is associated with increased apparent diffusion coefficient (ADC) and cerebral blood flow (CBF), which are observed as a consequence of infiltrative oedema and vessel recruitment during migration.
This study aimed to determine whether TVZ imaging features differed between sporadic and NF1-associated OPG, and whether infiltrative profiles at the TVZ correlated with the primary VA clinical outcome. Given that increased ADC and CBF surrounding a tumour indicates infiltration into the parenchyma, our hypothesis was that ADC and CBF at the TVZ would positively correlate with the poor primary outcome of visual acuity.
Methods
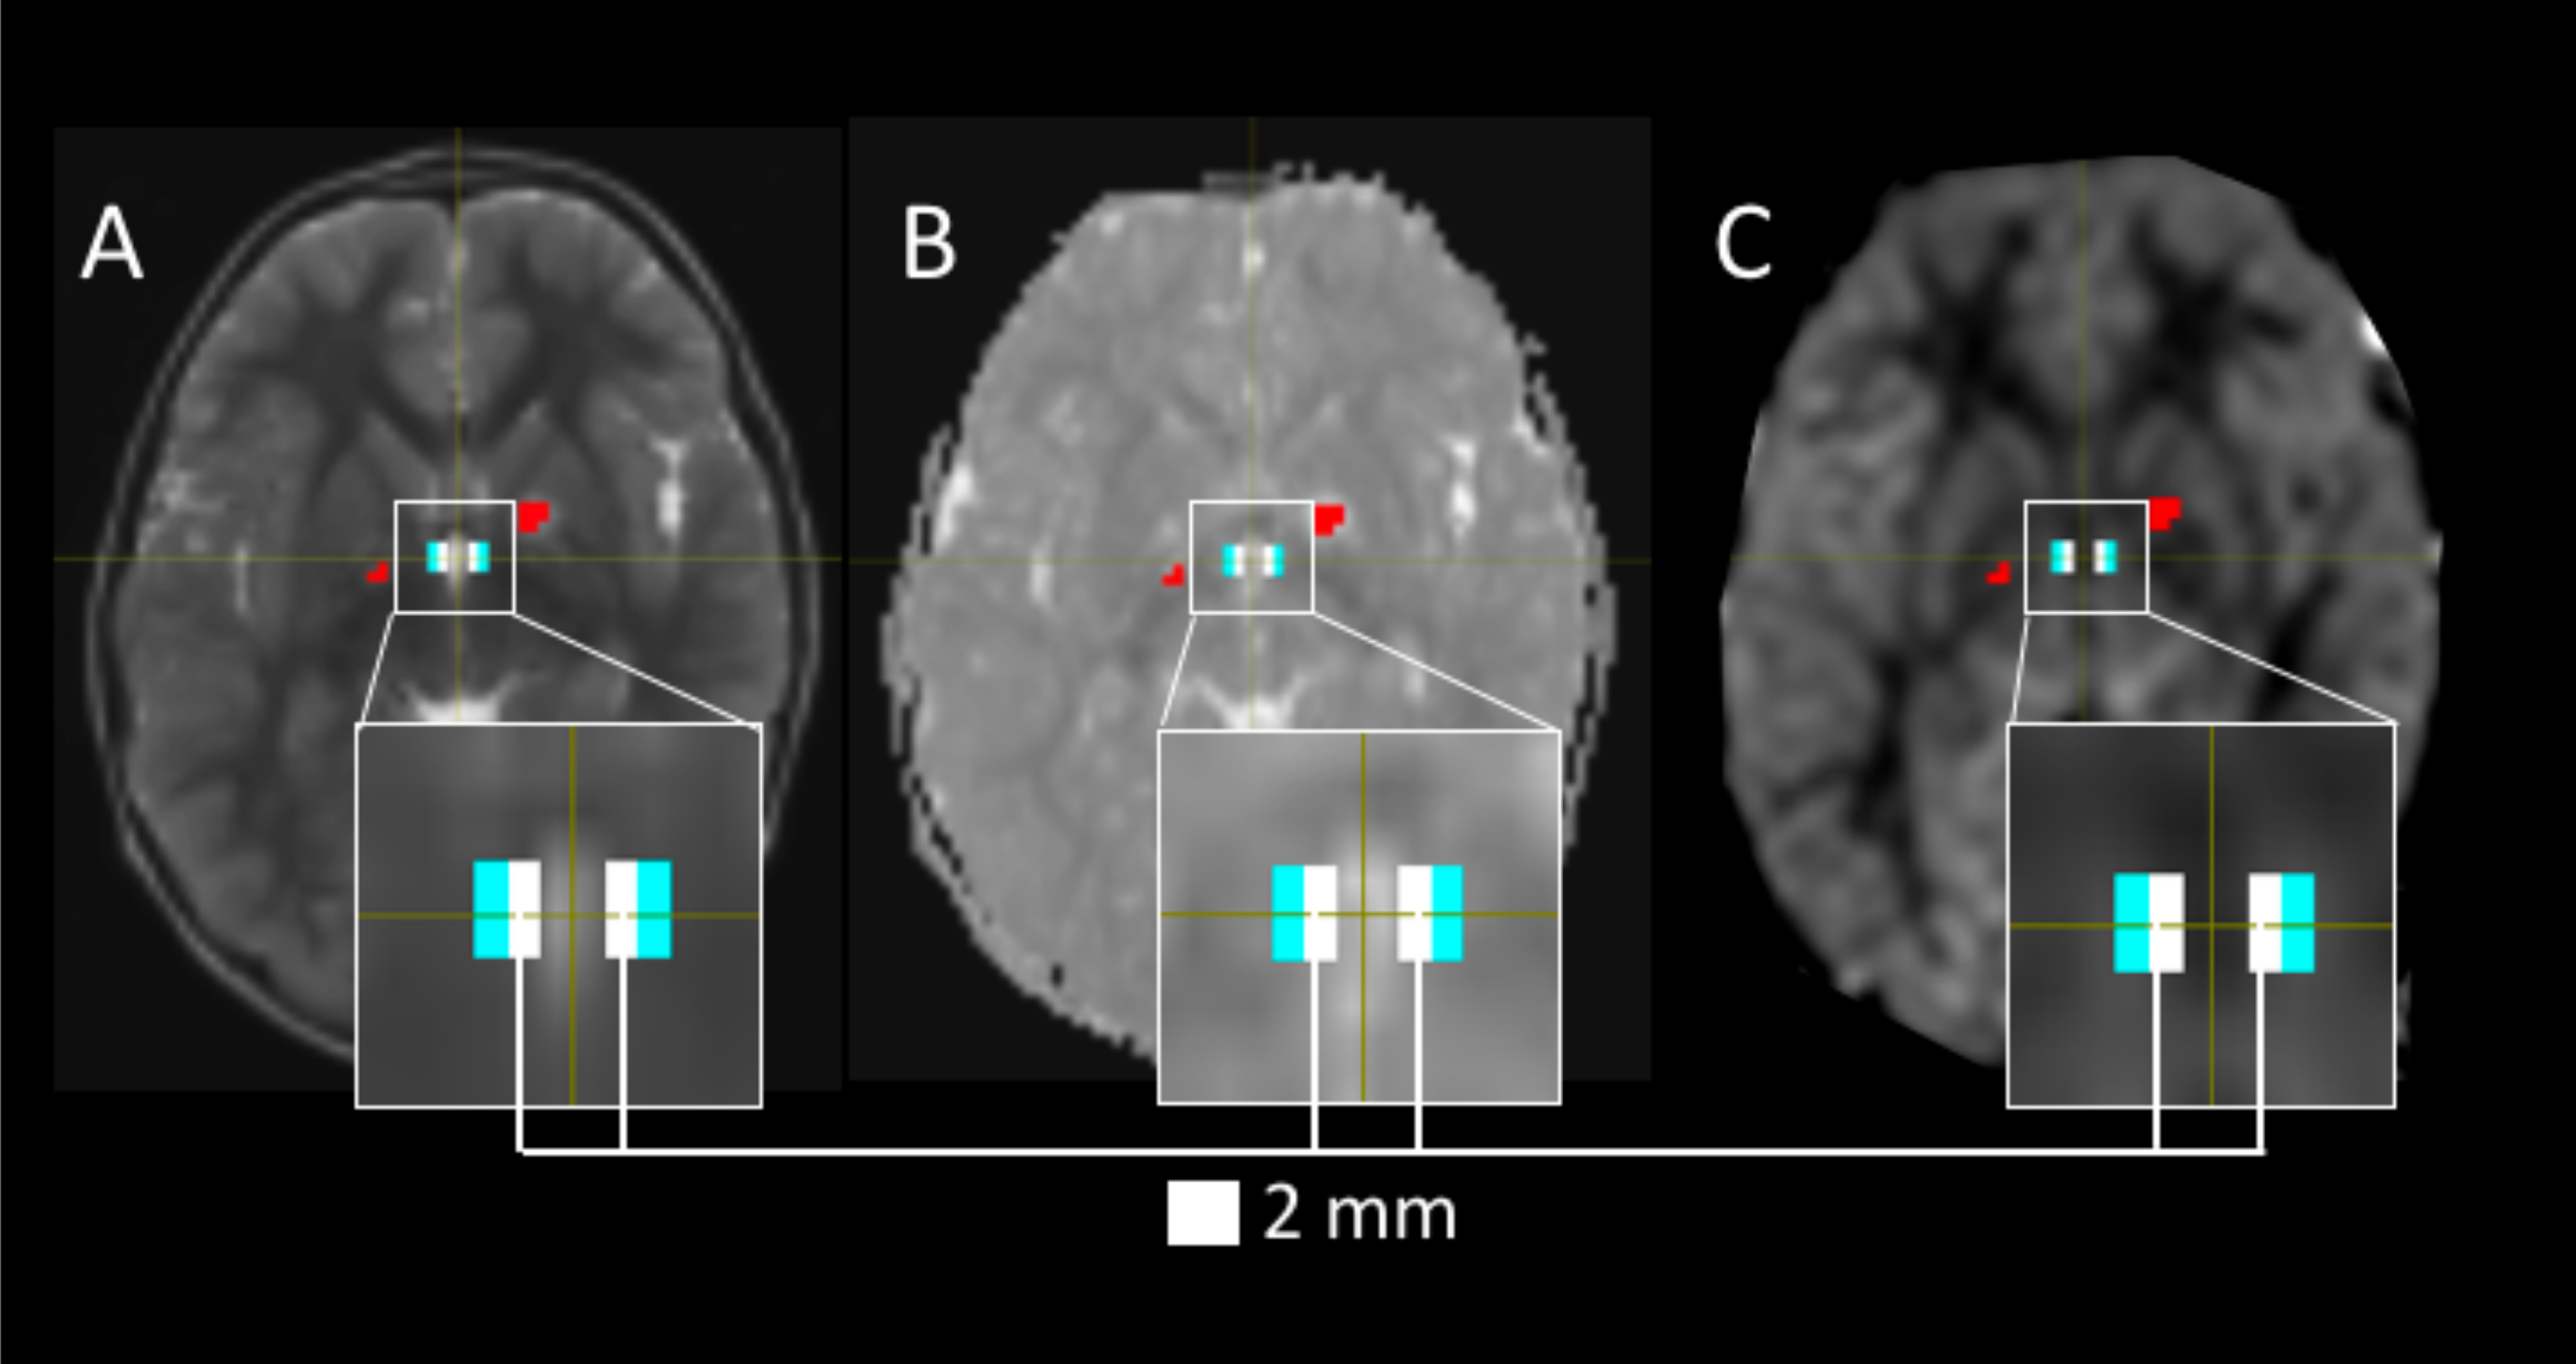
ADC and arterial spin labelling CBF MRI data were acquired from 30 OPG patients, along with VA measurements. The TVZ ROI was identified as the voxels surrounding the inferior-lateral walls and floor of the third ventricle. The voxels directly lining the third ventricle were excluded to avoid partial volume effects from cerebral spinal fluid (Figure 2). Tumour and unidentified bright object4 voxels that intersected with TVZ ROIs were excluded. Values for ADC and CBF were measured in the TVZ ROIs. As NF1 is associated with elevated diffusion 5,6 and lowered CBF 7 in the brain, all tests were run for NF1 and sporadic groups separately. TVZ ADC and CBF were correlated with VA measures from each patient’s poorest performing eye using multivariate linear regression, accounting for patient age, tumour location (relative to the chiasm), treatment status and optic radiation fractional anisotropy values (FA).Results
Fifteen (50%) OPG patients were NF1-positive, and the median age of all OPG patients was 71 months (range 8–205). Fifteen (50%; 6 NF1, 9 sporadic) patients were on active treatment at the time of imaging and 15 (9 NF1, 6 sporadic) were not. All patients had logMAR scores >0.00 in the worst-performing eye (median logMAR 1.10, range 0.04–2.24).
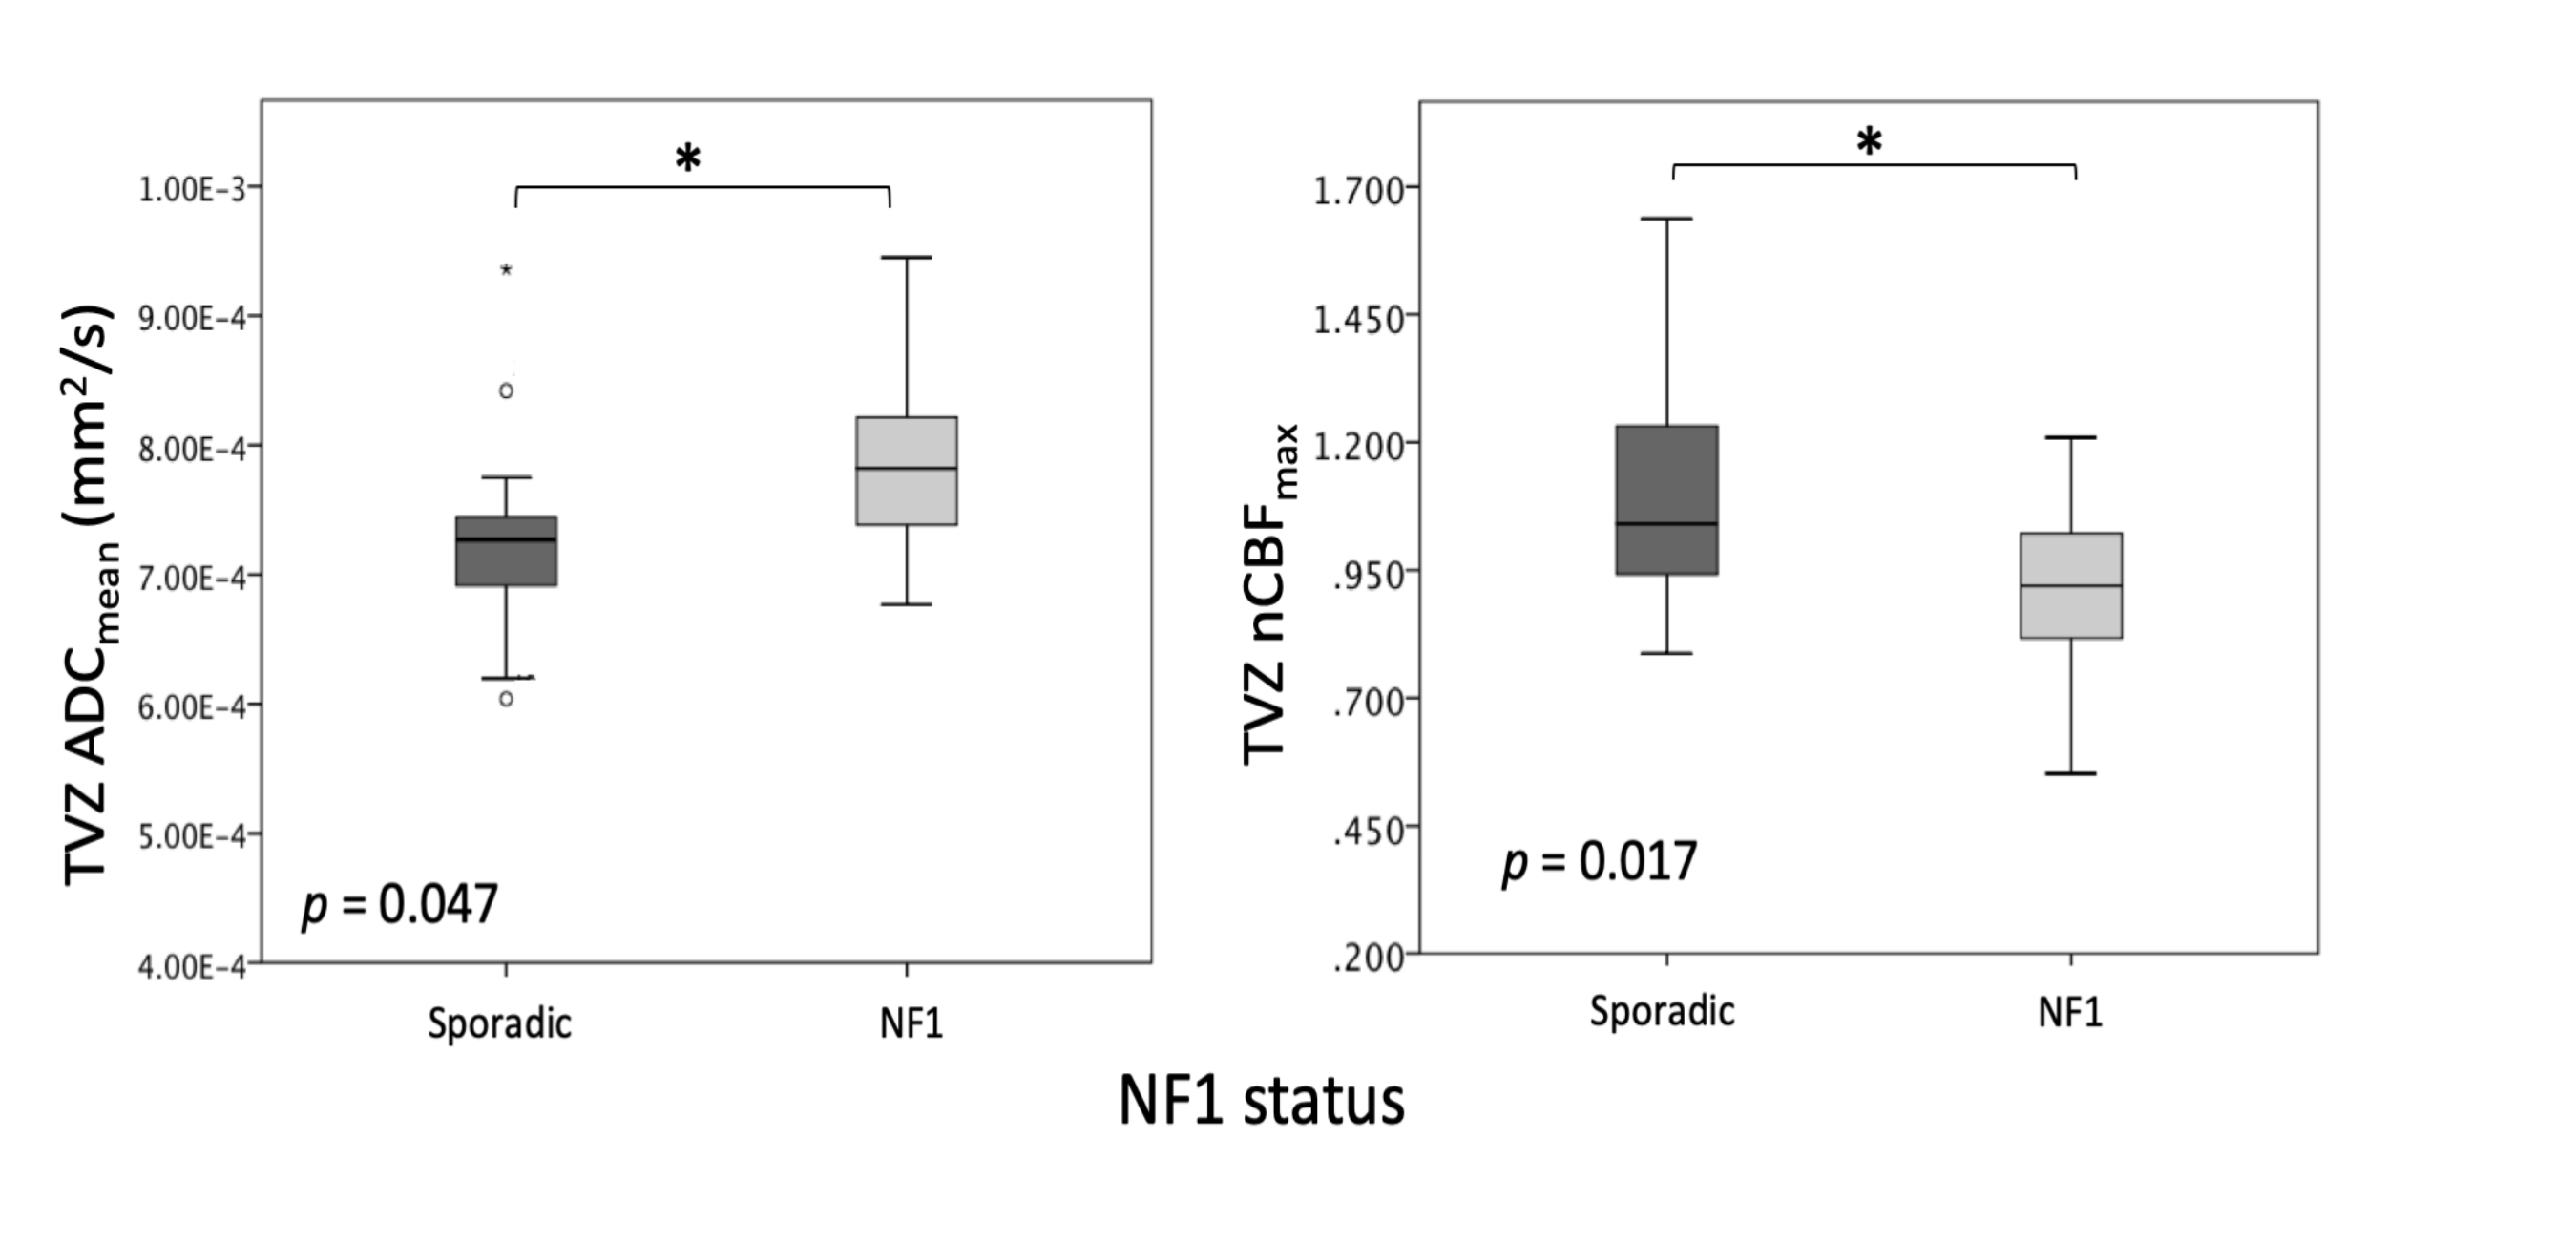
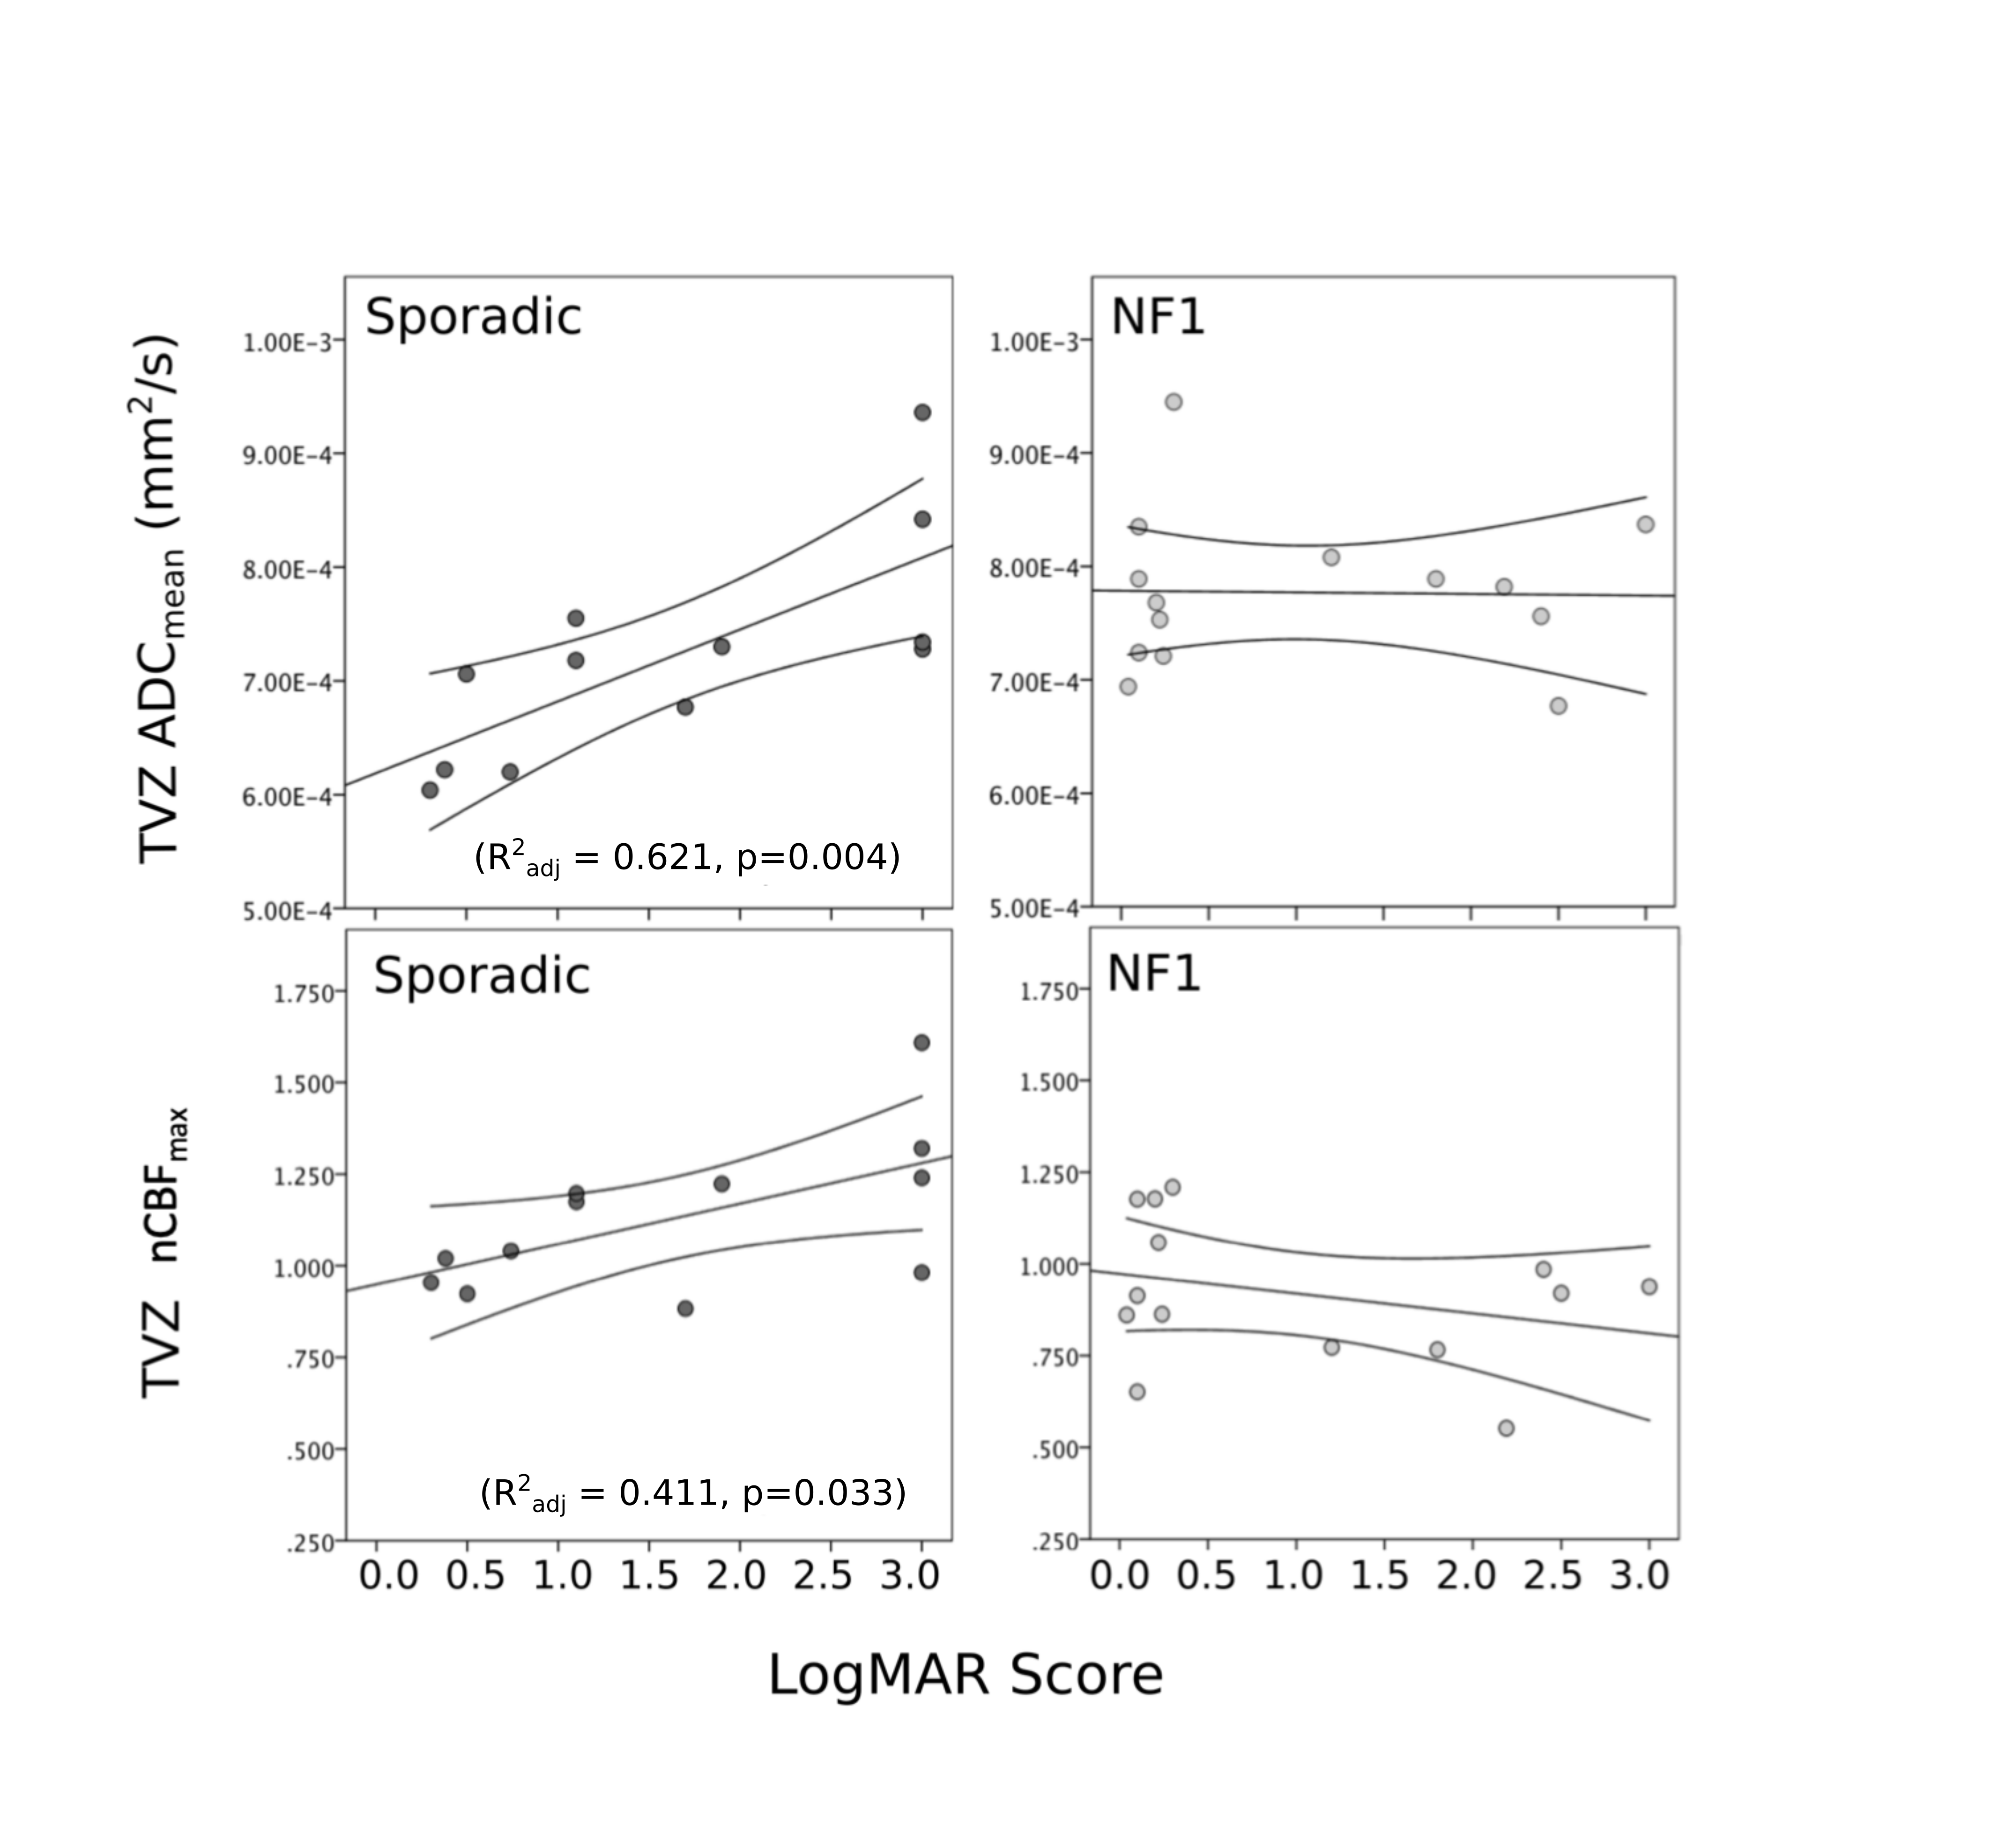
In sporadic OPG, TVZ ADC was lower (p = 0.047), and CBF higher (p = 0.017) than NF1-associated OPG (Figure 3). Sporadic ADCmean (R2adj = 0.621, p = 0.004) and CBFmax (R2adj = 0.411, p = 0.033) TVZ measures were significantly correlated with VA in the multivariate linear regression model (Figure 4). For NF1, no significant TVZ correlations were found with vision, leaving optic radiation FA (R2adj = 0.840, p < 0.001) as the only significant negative correlate of poor VA in the NF1 model.
Discussion
These results suggest that there may be differences in early infiltrative strategies between sporadic and NF1-associated OPG, and the mechanisms leading to tumour formations may differ between the two groups.
In the sporadic setting, the significantly positive correlations of TVZ ADC and CBF with poor vision can be attributed to strategies adopted by glioma cells to infiltrate the extracellular matrix. Infiltrative oedema and loss of vascular tone control result from invasive strategies that include recruitment of stromal cells and vasculature, and displacement of astrocytic end-feet at the blood vessels, which are visualised as abnormal ADC and CBF.
In the NF1 setting, the higher ADC and lower CBF in comparison to sporadic OPG, as well as their relatively stable values when correlated with visual function, may be an indication of the NF1 condition and not reflective of glioma cell infiltration from the TVZ. This suggests that early-staged NF1-associated OPG cells may not behave in an infiltrative manner that is detectable via MRI. Sporadic OPG cells, however, display infiltrative MRI profiles at the TVZ.
Conclusion
MRI can identify features at the TVZ that differentiate NF1-associated and sporadic OPG. The data suggest that MRI features of tumour cell invasion are visible at the TVZ in sporadic, but not NF1-associated OPG. Additionally, ADC and CBF measures of the TVZ may be appropriate imaging biomarkers for VA outcome in sporadic, but not NF1- associated OPG. This supports the concept of visualising NF1-associated and sporadic OPG as separate diseases with differing pathological mechanisms.Acknowledgements
The authors would like to thank the patients who have participated in this study, and the staff at Great Ormond Street Hospital for assistance in acquiring the data. We also thank the University of Minnesota Center for Magnetic Resonance Research for providing the multiband-EPI sequence (http://www.cmrr.umn.edu/multiband). This work was supported by Great Ormond Street Hospital Children’s Charity.References
1. Tchoghandjian A, Fernandez C, Colin C, et al. Pilocytic astrocytoma of the optic pathway: a tumour deriving from radial glia cells with a specific gene signature. Brain. 2009;132(6):1523-1535.
2. Dahiya S, Lee DY, Gutmann DH. Comparative Characterization of the Human and Mouse Third Ventricle Germinal Zones. J Neuropathol Exp Neurol. 2011;70(7):622-633.
3. Mistry AM, Dewan MC, White-Dzuro GA, et al. Decreased survival in glioblastomas is specific to contact with the ventricular-subventricular zone, not subgranular zone or corpus callosum. J Neurooncol. 2017;132(2):341-349.
4. Billiet T, Mädler B, D’Arco F, et al. Characterizing the microstructural basis of “unidentified bright objects” in neurofibromatosis type 1: A combined in vivo multicomponent T2 relaxation and multi-shell diffusion MRI analysis. NeuroImage Clin. 2014;4:649-658.
5. van Engelen SJPM, Krab LC, Moll HA, et al. Quantitative differentiation between healthy and disordered brain matter in patients with neurofibromatosis type I using diffusion tensor imaging. AJNR Am J Neuroradiol. 2008;29(4):816-822.
6. Eastwood JD, Fiorella DJ, MacFall JF, Delong DM, Provenzale JM, Greenwood RS. Increased brain apparent diffusion coefficient in children with neurofibromatosis type 1.Radiology. 2001;219(2):354-358.
7. Yeom KW, Lober RM, Barnes PD, Campen CJ. Reduced cerebral arterial spin-labeled perfusion in children with neurofibromatosis type 1. AJNR Am J Neuroradiol. 2013;34(9):1823-1828.
Figures