2849
Visualization of Brain Shift Corrected fMRI data for Intraoperative Brain Mapping1Physical Sciences, Sunnybrook Research Institute, Toronto, ON, Canada, 2Keenan Research Centre, St. Michael's Hospital, Toronto, ON, Canada, 3Division of Neurosurgery, St. Michael's Hospital, Toronto, ON, Canada, 4Institute of Biomaterials & Biomedical Engineering, University of Toronto, Toronto, ON, Canada, 5Depart of Medical Biophysics, University of Toronto, Toronto, ON, Canada
Synopsis
Functional Magnetic Resonance Imaging (fMRI) facilitates the presurgical planning of awake craniotomies, but its use during the procedures remains limited. During intraoperative brain mapping by direct cortical electrical stimulation (DCS), fMRI is typically displayed separately or mentally recalled. The use of fMRI data in this manner is difficult and is further complicated by brain deformation or "shift". An image registration pipeline is presented that addresses this issue by providing covisualization of fMRI and DCS with acceptable accuracy for intraoperative use. This visualization method has the potential to improve the workflow of intraoperative brain mapping.
Introduction
Brain tumor surgery requires careful balance between maximizing tumor excision and preserving eloquent cortex. In some cases, the surgeon may opt to perform an awake craniotomy including intraoperative mapping of brain function by direct cortical stimulation (DCS) to assist in decision-making. Preoperatively, functional magnetic resonance imaging (fMRI) facilitates planning by identification of eloquent brain areas, helping to guide DCS and other aspects of the surgical plan1. However, brain deformation (shift)2 limits the usefulness of preoperative fMRI during surgery. To address this, an improved methodology for intraoperative visualization of fMRI and DCS results is developed.Methods
An image registration pipeline has been developed that displays preoperative fMRI data corrected for brain shift overlaid on images of the exposed cortical surface at the beginning (preDCS) and completion (postDCS) of DCS mapping. The pipeline was prototyped in MATLAB (The Mathworks, Inc, Natick, MA). The affine spatial transform $$$T$$$ was estimated in a 3-level multiresolution framework (‘imregtform’) using the best performing optimizer (“one plus one evolutionary”) parameters (across all patients), and subsequently applied (“imwarp”) to yield the registered output. Prior to registration, a region-of-interest corresponding to the craniotomy window was selected. For pipeline validation, testing was performed using imaging data from four brain tumor patients who underwent awake craniotomy. Preoperative fMRI and intraoperative cortical surface images were registered, starting from a range of misalignments (displacement, r between 5mm and 25mm and rotation, α between 0º and 20º). The mean registration error (RE) in the recovered transformation was quantified by computing the mean Euclidean distance $$$dist()$$$ between $$$N$$$(=15) corresponding landmark points $$$p_i$$$ of the ground truth and the transformed misaligned image, as in Eq. 1.
$$RE=\frac{1}{N}\sum_{i_=1}^Ndist(T(p_i)-p_i)$$
Results
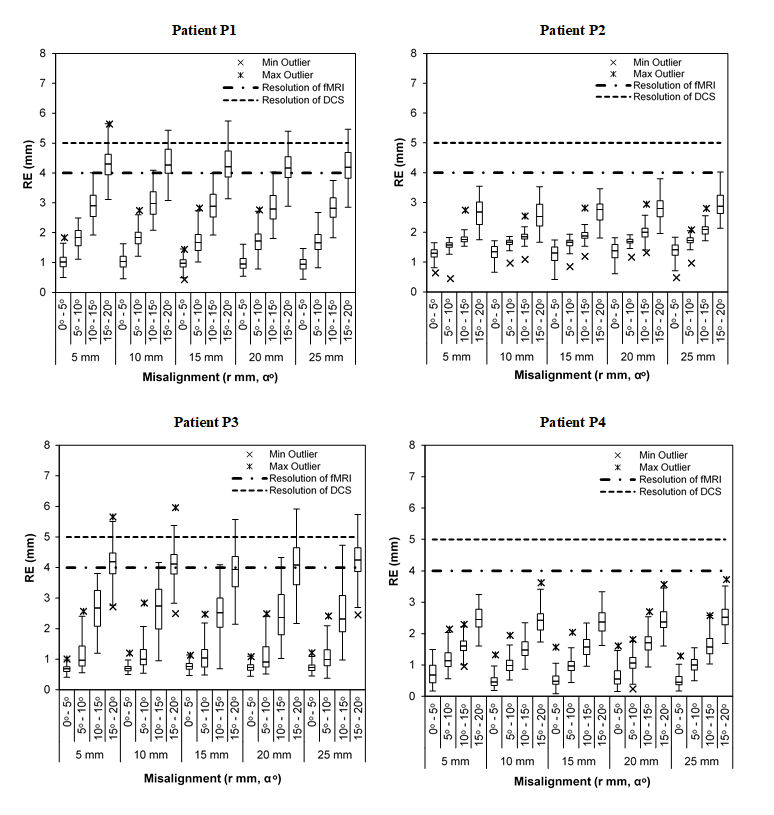
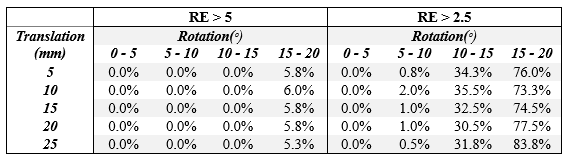
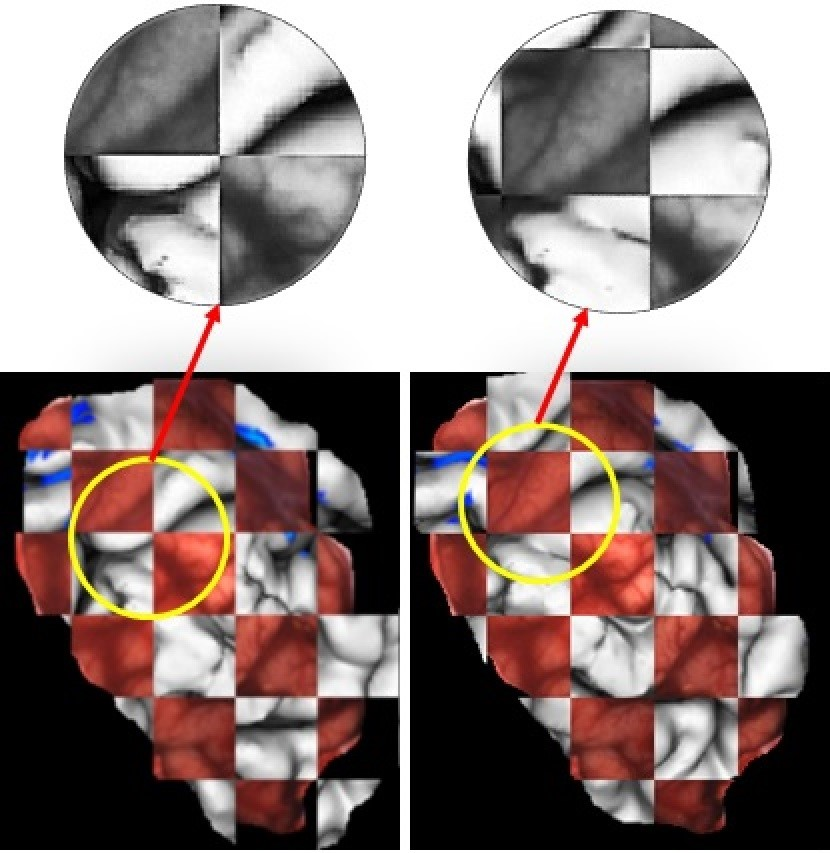
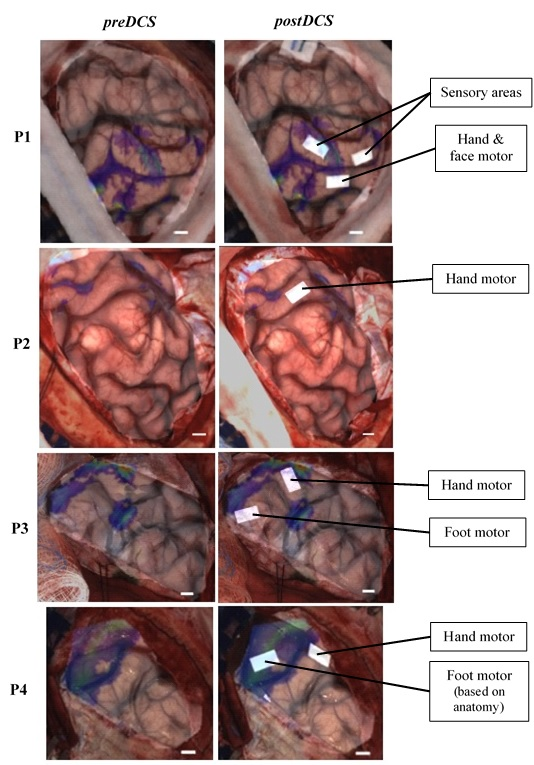
Fig. 1 illustrates the distribution of RE values for each patient over different combinations of initial misalignments, showing errors well under 5 mm (nominal resolution of DCS) for misalignments of up to 25 mm (and possibly larger) and approximately 10-15ᵒ. Assessment of pipeline failure rates quantified for two criteria: RE > 5 mm and RE > 2.5 mm (Table 1), demonstrates a success rate of 94-95 % and 16-27 % respectively, for rotational misalignments up to 20ᵒ. Under both error tolerances, the pipeline had a negligible failure rate for rotational misalignments up to 10ᵒ. The quality of registration is evident from Fig. 2, where the discontinuities in sulcal lines due to misalignment between preoperative and intraoperative images are corrected upon registration. The pipeline provides visualization shown in Fig. 3, before DCS mapping (preDCS) and after DCS mapping (postDCS). The postDCS results indicate that the hand motor activations from DCS mapping were proximal to fMRI activations for all patients, with partial overlap for patients P3 and P4.Discussion/conclusion
Lacking a method for visualizing co-registered fMRI and DCS data intraoperatively, we developed a prototype image processing pipeline with such functionality and validated it on four brain tumor patients. Overall, the results were very promising, showing acceptable accuracy for intraoperative use, for the patients investigated. As expected, there was some variability in registration accuracy across the patients, with patient P3 proving the most challenging and patient P4 the most robust. Further tests will be necessary in additional patients for a more comprehensive evaluation over a wider range of brain tumor and brain shift presentations. Nevertheless, this method offers visualizations with potential benefits for intraoperative brain mapping. The preDCS output shows fMRI activations overlaid on the cortical surface for initial guidance of DCS procedures, whereas the postDCS output facilitates visual comparison between the sites mapped intraoperatively and the preoperative fMRI activations on the current state of the visible brain surface. As a result, the surgeon is relieved of transforming these data mentally while using them to streamline DCS workflow, and to assess fMRI and DCS concordance intraoperatively. This is important because although fMRI has known limitations3 and DCS is regarded as the gold standard for brain mapping, DCS has its own sources of variability4. In future, the prototype pipeline needs to be investigated by surgeons to assess the potential for improved workflow during intraoperative brain mapping. The present work is a useful starting point for such assessments, which ultimately may lead to a robust visualization tool within the tablet platform previously developed in our lab for awake craniotomy procedures5.Acknowledgements
The authors thank the Federal Economic Development Agency for Southern Ontario (FedDev) for providing funding for this work.References
- Petrella JR, Shah LM, Harris KM, et al. Preoperative Functional MR Imaging Localization of Language and Motor Areas: Effect on Therapeutic Decision Making in Patients with Potentially Resectable Brain Tumors. Radiology. 2006;240(3):793-802.
- Roberts DW, Hartov A, Kennedy FE, Miga MI, Paulsen KD. Intraoperative brain shift and deformation: A quantitative analysis of cortical displacement in 28 cases. Neurosurgery. 1998;43(4):749-758.
- Morrison MA, Tam F, Garavaglia MM, et al. Sources of variation influencing concordance between functional MRI and direct cortical stimulation in brain tumor surgery. Front Neurosci. 2016;10(OCT):1-16.
- Borchers S, Himmelbach M, Logothetis N, Karnath H-O. Direct electrical stimulation of human cortex — the gold standard for mapping brain functions? Nat Rev Neurosci. 2011;13(1):63-71.
- Morrison MA, Tam F, Garavaglia MM, et al. A novel tablet computer platform for advanced language mapping during awake craniotomy procedures. J Neurosurg. 2016;124(4):938-944.
Figures