2844
Exploiting Heterogeneous Data for Automatic Classification of Multiple Sclerosis Clinical Forms through Neural Networks1CREATIS, University Claude Bernard Lyon 1, Lyon, France, 2Department of Mathematics and Computer Science, University of Calabria, Rende, Italy, 3Hôpital Neurologique, Service de Neurologie A, Hospices Civils de Lyon, Lyon, France, 4CERMEP - Imagerie du Vivant, Université de Lyon, Lyon, France
Synopsis
This work is aimed at producing a fully automatic model for the classification of MS clinical profiles exploiting heterogeneous source of data. The task is addressed by extracting the connectivity graph of the subject as well as the corresponding MRI-derived feature vector, and then by applying a two-branches NN procedure to obtain the corresponding classification.
Introduction
Multiple Sclerosis (MS) is a chronic disease of the central nervous system, constituting the main cause of non-traumatic disability in young adults. In the 85% of the cases, patients experience a first neurological episode, known as a clinically isolated syndrome (CIS) that may evolve into the Relapsing-Remitting (RR) course. After a period of 10 to 20 years, RR patients will evolve into a Secondary Progressive (SP) course. The remaining 15% of patients start with the Primary Progressive (PP) course1. Today, MS diagnosis is based on the detection of T2-weighted lesions and the evaluation of their spatial and temporal disssemination2. However, conventional MRI remains poorly correlated to patients' clinical status. More advanced MR techniques, such as diffusion tensor imaging (DTI) have demonstrated higher sensitivity and specificity to detect tissue damage in lesions and in normal appearing white matter, through the estimation of metrics such as fractional anisotropy (FA) and mean diffusivity (MD). Based on DTI, the brain structural connectivity can be estimated and characterized using graph derived metrics3. The strong analogy between brain structure and complex networks, was already used to describe social behaviors, and indeed, opened new perspectives in neuroscience3-5. In particular, Neural Network (NN) based approaches for classifying MS patients within their respective clinical profiles have achieved remarkable results6,7.
The aim of this study is to define a novel family of NNs able to handle different measurements types such as brain connectivity representation and MRI-derived information to classify MS patients into the four clinical profiles. Our main intuition, indeed, is that Neural Networks can exploit meaningful patterns in brain connectivity and, at the same time, take advantage from MRI-derived information for a better characterization of the disease.
Methods
The collected dataset used for the experiments is composed of 12 CIS, 30 RR, 28 SP, and 20 PP. Multiple exams were collected for each patient at different time steps. The connectivity graph for each subject is obtained by combining brain segmentation and tractography extracted from Diffusion and T1-weighted MR images. The feature vector is obtained by extracting MD and FA measurements from DTI. The architecture proposed in this work is a two-branches neural network. The first branch is devoted to capture spatial locality of brain structure, and the second branch is used to process the feature vector of MRI-derived information. Each branch projects the input in a different dimensional space. Once concatenated, these vectors represent the input of a logistic classifier, which computes the output score. An illustration of the proposed architecture is shown in Figure 1. Cross validation with 5 folds was used to evaluate the performances. Quality of the classification was assessed by means of Precision, Recall and F-Measure.
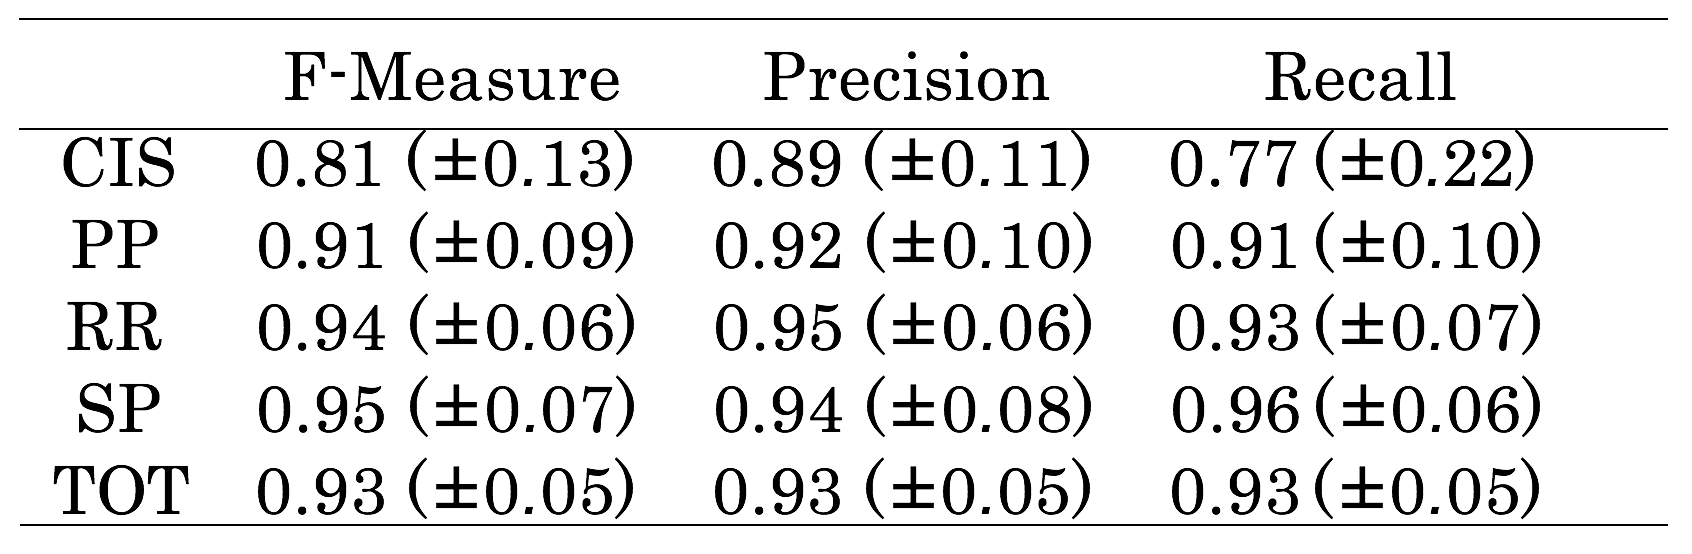
Results
Table 1 shows the achieved results. It illustrates how the proposed approach can reach significant results on the test set. Indeed, the results of our experiments show that our model allows to classify MS patients with an average F-Measure of 90%. In particular, the two branches lead the network to combine different sources of information. This approach may also have the advantage to be more robust in case of image artifacts or data acquisition errors affecting one of the sources, which is a common issue in medical imaging.Discussion and Conclusion
In this work, we showed how information from structural representation of the brain topology can be effectively combined with DTI-derived measures using NNs. This approach allowed the classification of MS patients with high level of accuracy, even on a small dataset. An interesting perspective would be to analyze how each feature contributes to the classification by trying to isolate a small subset of biomarkers, that is meaningful for the characterization of clinical profiles.Acknowledgements
The work is partially funded by the Italian Ministry of University and Research under project "Dottorato innovativo a caratterizzazione industriale" PON R&I FSE-FESR 2014-2020. We gratefully acknowledge the support of NVIDIA Corporation with the donation of the Quadro P6000 GPU used for this research.References
1. Kocevar G, Stamile C, Hannoun S, Cotton F, Vukusic S, Durand-Dubief F, Sappey-Marinier D. Graph theory-based brain connectivity for automatic classification of multiple sclerosis clinical courses. Frontiers in neuroscience. 2016;10.
2. Polman CH, Reingold, SC, Banwell B, Clanet M, Cohen JA, Filippi M, et al. Diagnostic criteria for multiple sclerosis: 2010 Revisions to the McDonald criteria. Ann. Neurol. 2015;69:292-302.
3. Rubinov M, Sporns O. Complex network measures of brain connectivity: Uses and interpretations. Neuroimage. 2010;52:1059-1069.
4. Bullmore ET, Sporns, O. Complex brain networks: graph theoretical analysis of structural and functional systems. Nat. Rev. Neurosci. 2009;10:186-198.
5. Shuman DI, Narang SK, Frossard P, Ortega A, Vandergheynst P. The emerging field of signal processing on graphs: extending high-dimensional data analysis to networks and other irregular domains. IEEE Signal. Process. 2013;30:83-98.
6. Calimeri F, Marzullo A, Stamile C, Terracina G. Graph based neural networks for automatic classification of multiple sclerosis clinical courses. In Proceedings of the European Symposium on Artificial Neural Networks, Computational Intelligence and Machine Learning (ESANN). 2018; forthcoming.
7. Calimeri F, Cauteruccio F, Marzullo A, Stamile C, Terracina G. Mixing Logic Programming and Neural Networks to Support Neurological Disorders Analysis. In International Joint Conference on Rules and Reasoning. 2018;33-47.
Figures