2839
The utility of a convolutional neural network for generating a myelin volume index map from rapid simultaneous relaxometry imaging1Applied MRI Research, Department of Molecular imaging and Theranostics, National Institute of Radiological Sciences, QST, Chiba, Japan, 2Department of Radiology, Juntendo University School of Medicine, Tokyo, Japan, 3Department of Radiology, Graduate School of Medicine, The University of Tokyo, Tokyo, Japan, 4Department of Molecular imaging and Theranostics, National Institute of Radiological Sciences, QST, Chiba, Japan
Synopsis
Myelin volume measurement based on rapid-simultaneous-relaxometry-imaging (RSRI) is useful for the clinic. However, the software that translates RSRI into the index map contains a potential weak point: the index is obtained using a pixelwise table-lookup that doesn't incorporate information from surrounding pixels. A novel deep-learning-based method was developed to overcome this problem. A myelin volume index based on magnetization-transfer saturation imaging was used as a reference for training and testing. The proposed method was evaluated by leave-one-out cross-validation using images from 20 healthy volunteers. Correlation with the reference was significantly higher for the proposed method.
Introduction
A myelin volume fraction map based on rapid simultaneous relaxometry imaging (RSRI)1 provides useful information for the clinic. As a particular example, a widely-used commercial software package (SyMRI 8.0, SyntheticMR, Linkoping)2 provides an index (SyMVF: SyMRI based myelin volume fraction) that is highly correlated with the conventional magnetization transfer (MT)-based myelin volume index (MTMVI)3, 4. Effective application of the SyMVF index to the clinic has been reported5, 6. The SyMVF map is generated pixel-by-pixel from a lookup table that connects combinations of R1, R2, and proton density (PD) values to myelin volume fraction. However, the SyMRI algorithm has room for improvement because it does not incorporate information about the location of and tissue structure surrounding a pixel. In this study, we propose a novel method based on the convolutional neural-network (CNN) technique in order to add additional information together with the SyMVF map to finally generate a new myelin volume index, GenMVI, that is more strongly correlated to MTMVI than SyMVF.Materials and methods
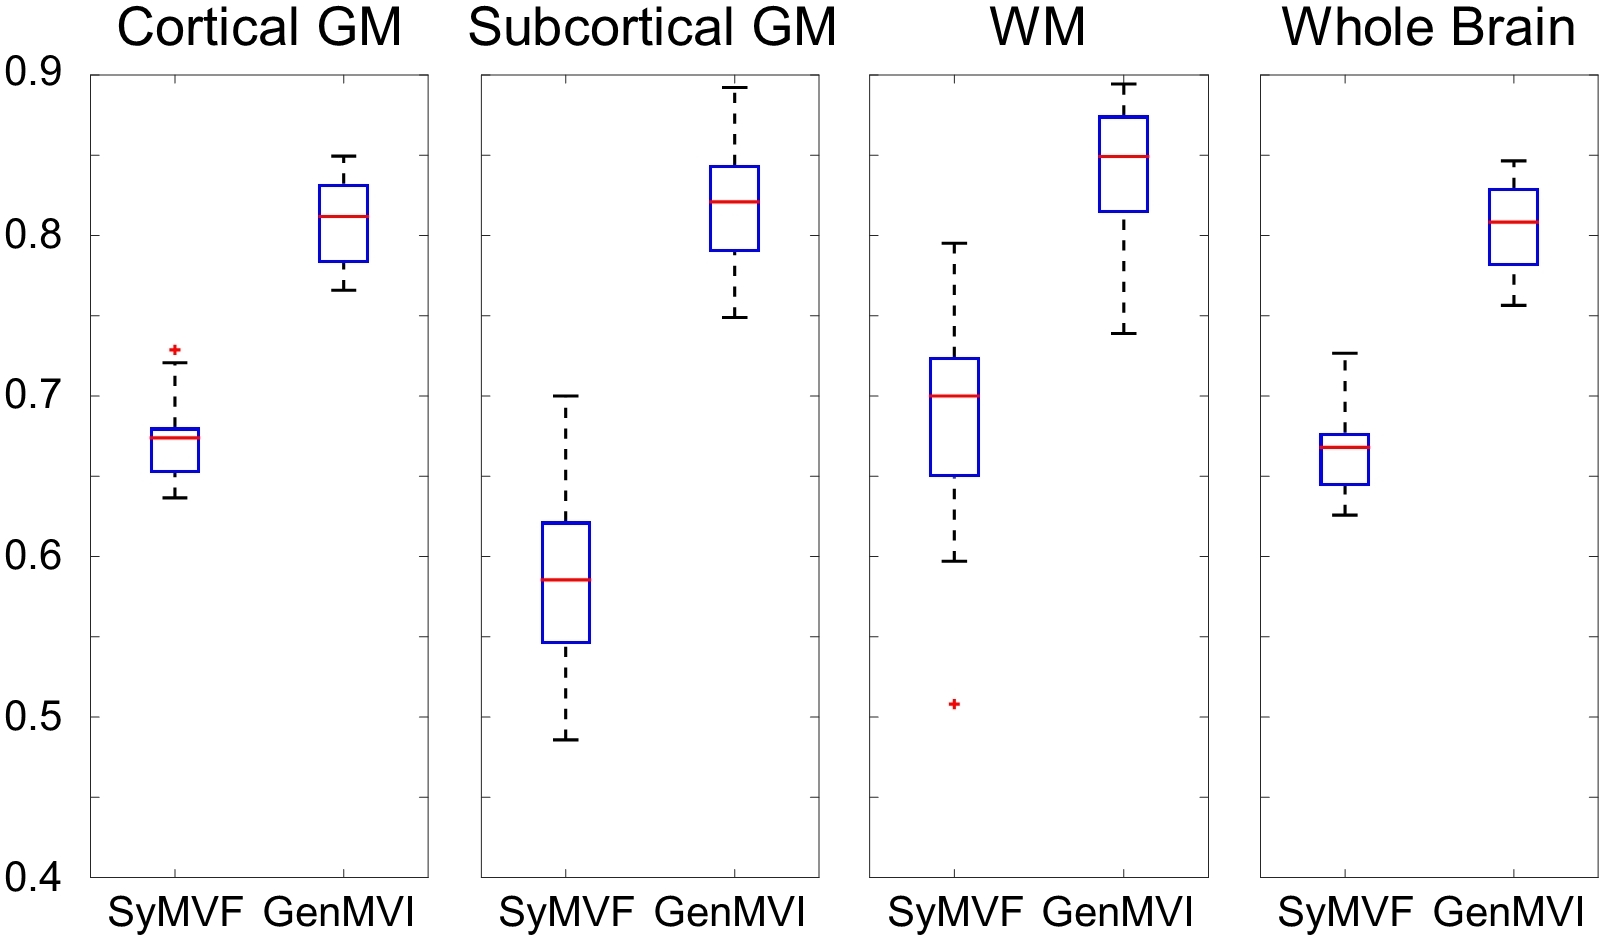
RSRI images and MT-weighted images were acquired from 20 healthy volunteers using the same 3T clinical MRI protocol as presented in a previous report3. The R1, R2, PD, and SyMVF maps were obtained from the RSRI images (matrix size: 256 x 256 pixels) using SyMRI 8.0 software. To create a MTMVI map, a MT saturation map was first calculated from the MT-weighted images, after which the map was rescaled so that the mean value of the pixels in the white matter area was equal between the SyMRI and the final MTMVI map. The architecture of the CNN used to generate GenMVI maps is in Figure 1. Training and testing were performed using patch images uniformly subsampled from the original map images (each patch was 32x32 pixels and approximately 6000 patches were sampled from a single volume). The R1, R2, PD, and SyMVF patches were input to the CNN to output the corresponding GenMVI patch. The CNN was trained using the root-mean-square-error with respect to the corresponding MTMVI map as a loss-function. Training was performed for each volunteer using the data of the remaining 19 volunteers (leave-one-out cross-validation).The SyMVF and GenMVI maps were compared with respect to how much they correlated with MTMVI in two ways. First, the mean values within 164 atlas-based local ROIs7, 8 were calculated for each volunteer, and Pierson’s correlation analysis was performed for both the SyMVF and GenMVI maps with respect to the MTMVI map. In addition, the absolute-error with respect to the MTMVI map for each local ROI was recorded and compared for the SyMVF and GenMVI maps using the Wilcoxon signed-rank test (P<.05 regarded as significant).Second, the pixel-based Pierson’s correlation coefficient for the SyMVF and GenMVI maps with respect to the MTMVI map was calculated for each patient for ROIs in four different tissue types (cortical gray matter, subcortical gray matter, white matter, and whole brain). These ROIs were defined by merging the local ROIs. The distributions of the coefficients were compared using the Wilcoxon signed-rank test (P<0.5 regarded as significant).Results
Examples of MTMVI, SyMVF, and GenMVI maps from one volunteer are shown in Figure 2. For the comparisons based on the mean values within each of the local ROIs, Pierson’s correlation coefficient was larger for the GenMVI map (R=0.86) than for the SyMVF map (R=0.77) (Figure 3). The median values of the absolute errors were significantly smaller for GenMVI in all four areas (P<.001) (Table 1). In the pixel-wise comparison, a strong correlation between the MTMVI and GenMVI maps was found for all four tissue types (Figure 4), with the median values of the correlation coefficients always being higher than 0.80. On the other hand, those for the SyMVF maps were 0.70 or less. The distributions of the SyMVF and GenMVI correlation coefficients were significantly different for all four tissue types (P<.001) (Figure 4).Discussion
Visually, the contrast of the GenMVI map was closer than the contrast of the SyMVF map to that of the MTMVI map (Figure 2). The stronger correlation for GenMVI vs. MTMVI than SyMVF vs. MTMVI was further supported by the mean-value- and pixelwise-based statistical comparisons (Table 1, Figures 3, 4). These results suggest that the GenMVI map is potentially useful for both general atlas-based analysis and image-based map analysis. Further study using pathology-based measures of myelin volume as a reference during the training would be desirable before this technique is suitable for clinical use.Conclusion
The CNN-based method proposed in this study was useful for estimating a myelin-volume index from RSRI.Acknowledgements
The authors appreciate the assistance of Hiroko Kamada and Etsuko Mitsui during the study.
This work was supported by AMED under grant number JP18lk1010025; ImPACT Program of Council for Science, Technology, and Innovation (Cabinet Office, Government of Japan); JSPS KAKENHI grant number 17K10385; JSPS KAKENHI grant number 16K19852; JSPS KAKENHI grant number JP16H06280, Grant-in-Aid for Scientific Research on Innovative Areas– Resource and Technical Support Platforms for Promoting Research “Advanced Bioimaging Support”; and the Japanese Society for Magnetic Resonance in Medicine.
References
1. Warntjes JB, Leinhard OD, West J, Lundberg P. Rapid magnetic resonance quantification on the brain: Optimization for clinical usage. Magnetic resonance in medicine. 2008;60:320-329
2. Warntjes M, Engstrom M, Tisell A, Lundberg P. Modeling the presence of myelin and edema in the brain based on multi-parametric quantitative mri. Frontiers in neurology. 2016;7:16
3. Hagiwara A, Hori M, Kamagata K, Warntjes M, Matsuyoshi D, Nakazawa M, Ueda R, Andica C, Koshino S, Maekawa T, Irie R, Takamura T, Kumamaru KK, Abe O, Aoki S. Myelin measurement: Comparison between simultaneous tissue relaxometry, magnetization transfer saturation index, and t1w/t2w ratio methods. Sci Rep. 2018;12:10554
4. Lema A, Bishop C, Malik O, Mattoscio M, Ali R, Nicholas R, Muraro PA, Matthews PM, Waldman AD, Newbould RD. A comparison of magnetization transfer methods to assess brain and cervical cord microstructure in multiple sclerosis. Journal of neuroimaging. 2017;27:221-226
5. Hagiwara A, Hori M, Yokoyama K, Nakazawa M, Ueda R, Horita M, Andica C, Abe O, Aoki S. Analysis of white matter damage in patients with multiple sclerosis via a novel in vivo mr method for measuring myelin, axons, and g-ratio. AJNR. 2017;38:1934-1940
6. Andica C, Hagiwara A, Hori M, Nakazawa M, Goto M, Koshino S, Kamagata K, Kumamaru KK, Aoki S. Automated brain tissue and myelin volumetry based on quantitative mr imaging with various in-plane resolutions. Journal of neuroradiology. 2018;45:164-168
7. Hua K, Zhang J, Wakana S, Jiang H, Li X, Reich DS, Calabresi PA, Pekar JJ, van Zijl PC, Mori S. Tract probability maps in stereotaxic spaces: Analyses of white matter anatomy and tract-specific quantification. NeuroImage. 2008;39:336-347
8. Wakana S, Caprihan A, Panzenboeck MM, Fallon JH, Perry M, Gollub RL, Hua K, Zhang J, Jiang H, Dubey P, Blitz A, van Zijl P, Mori S. Reproducibility of quantitative tractography methods applied to cerebral white matter. NeuroImage. 2007;36:630-644
Figures
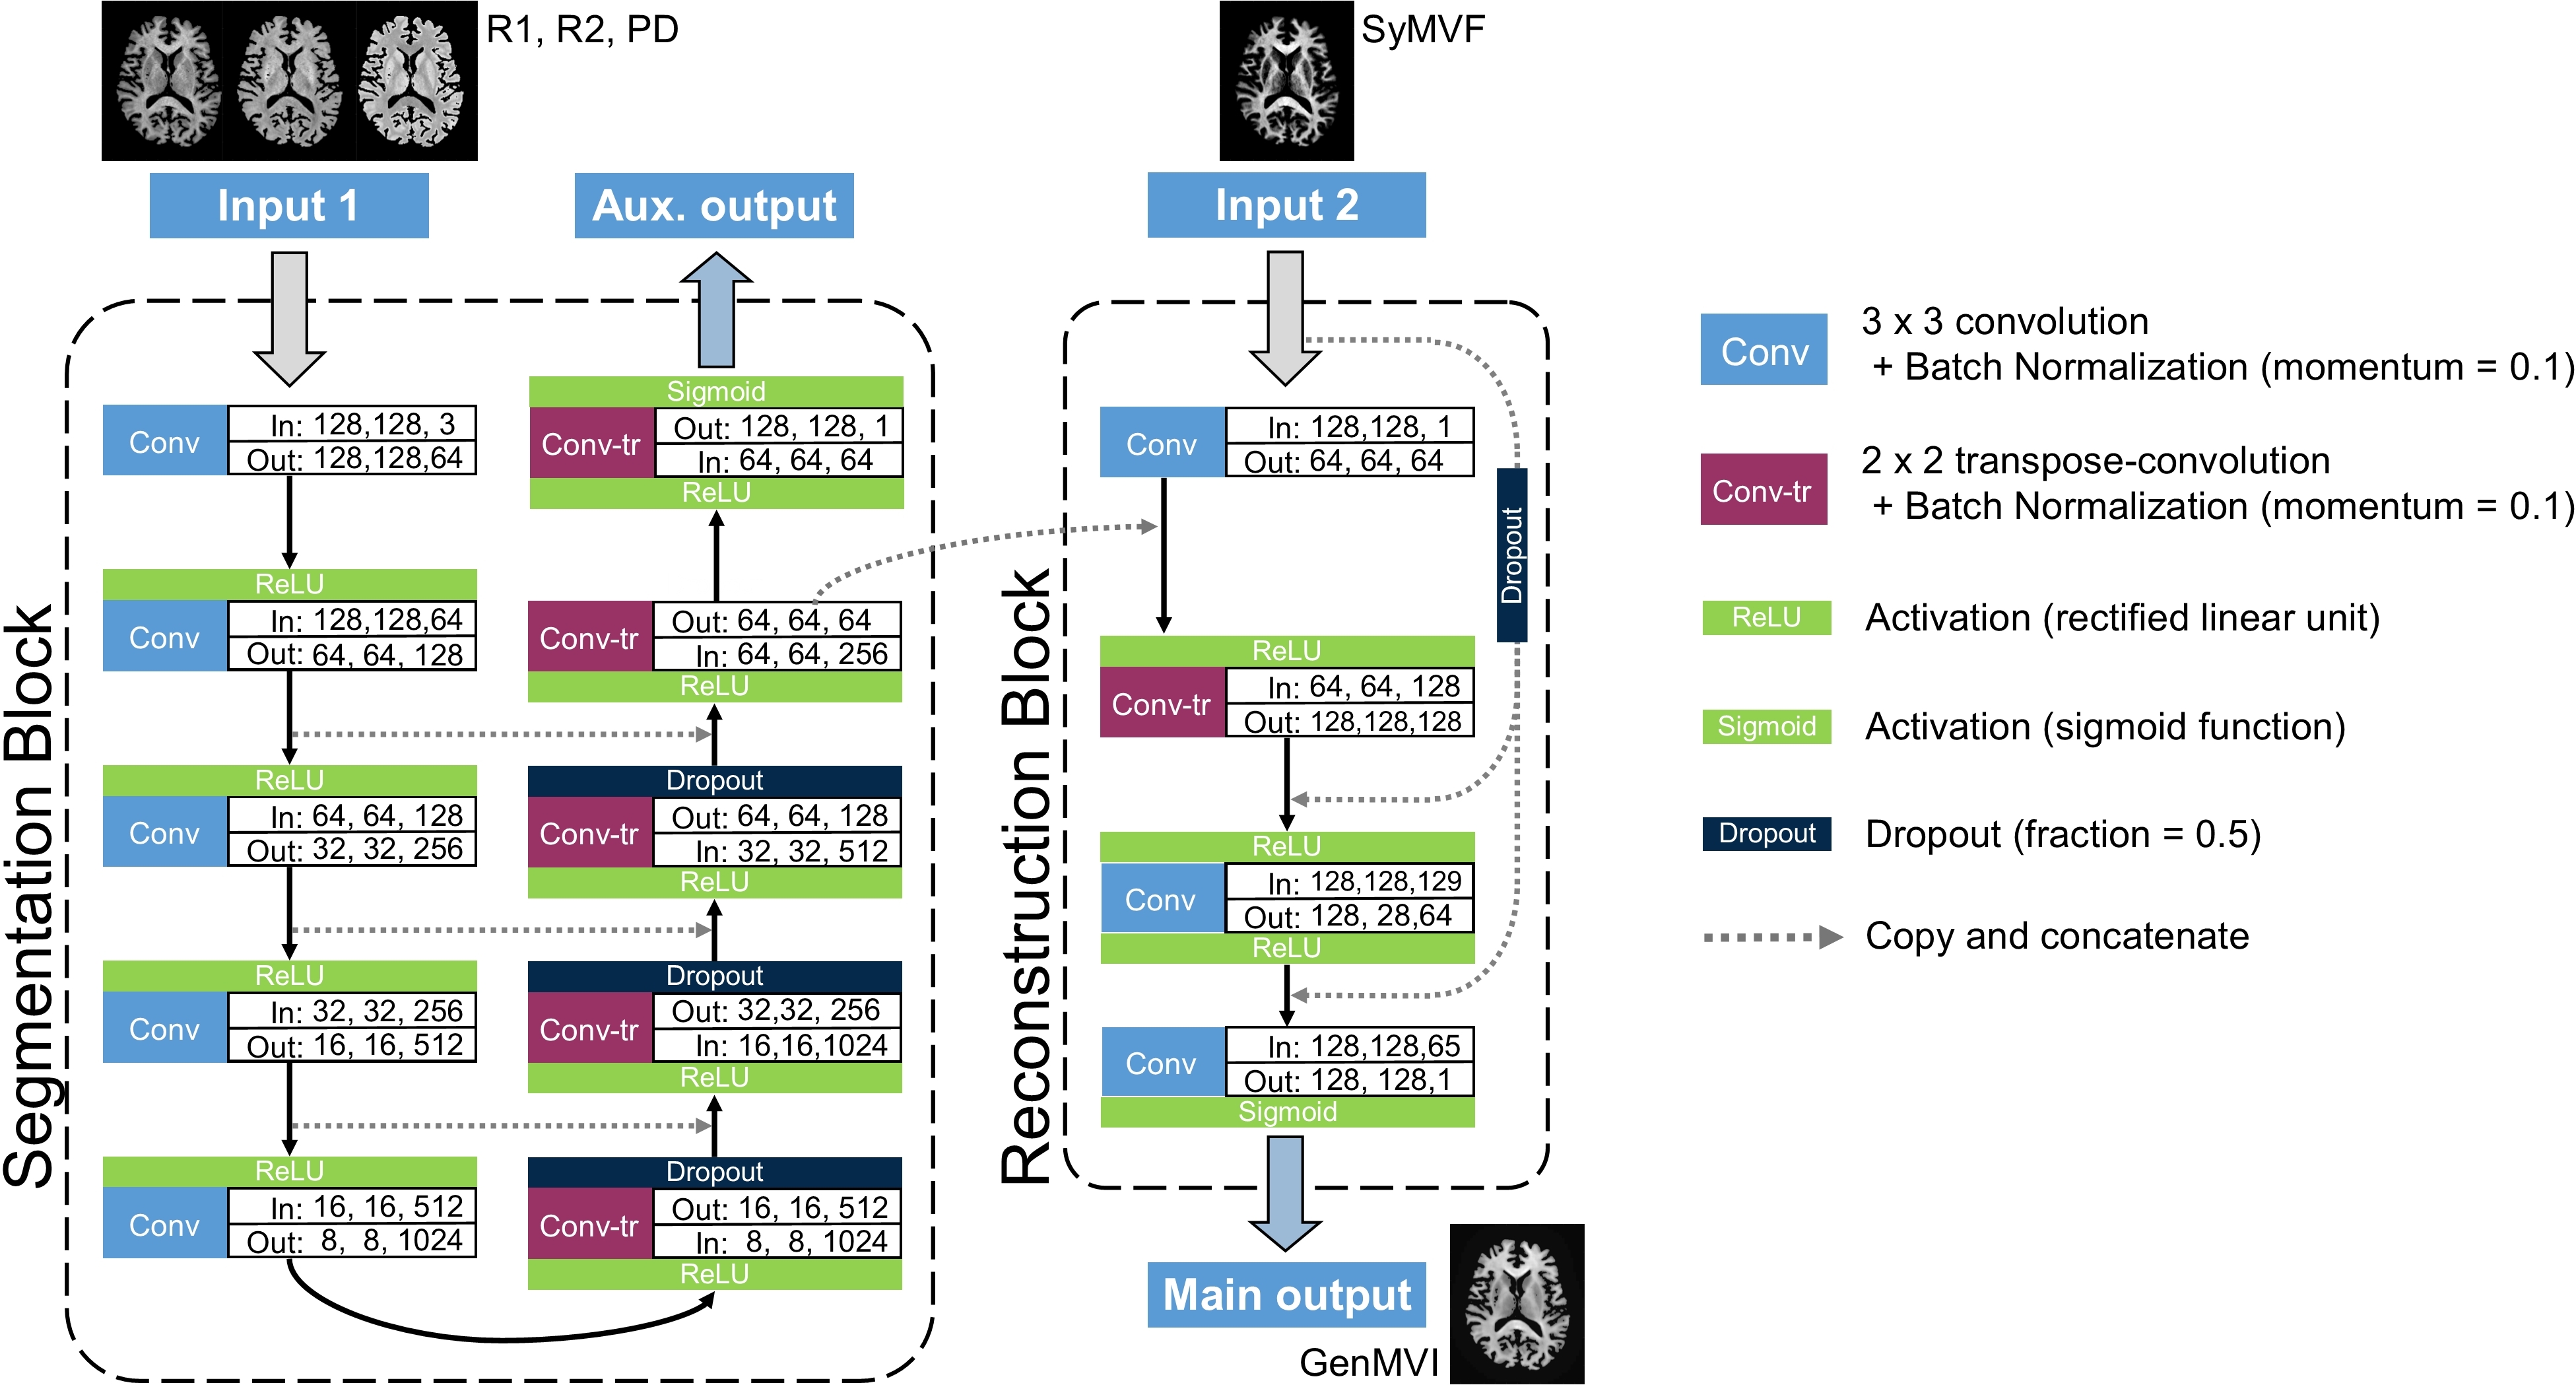
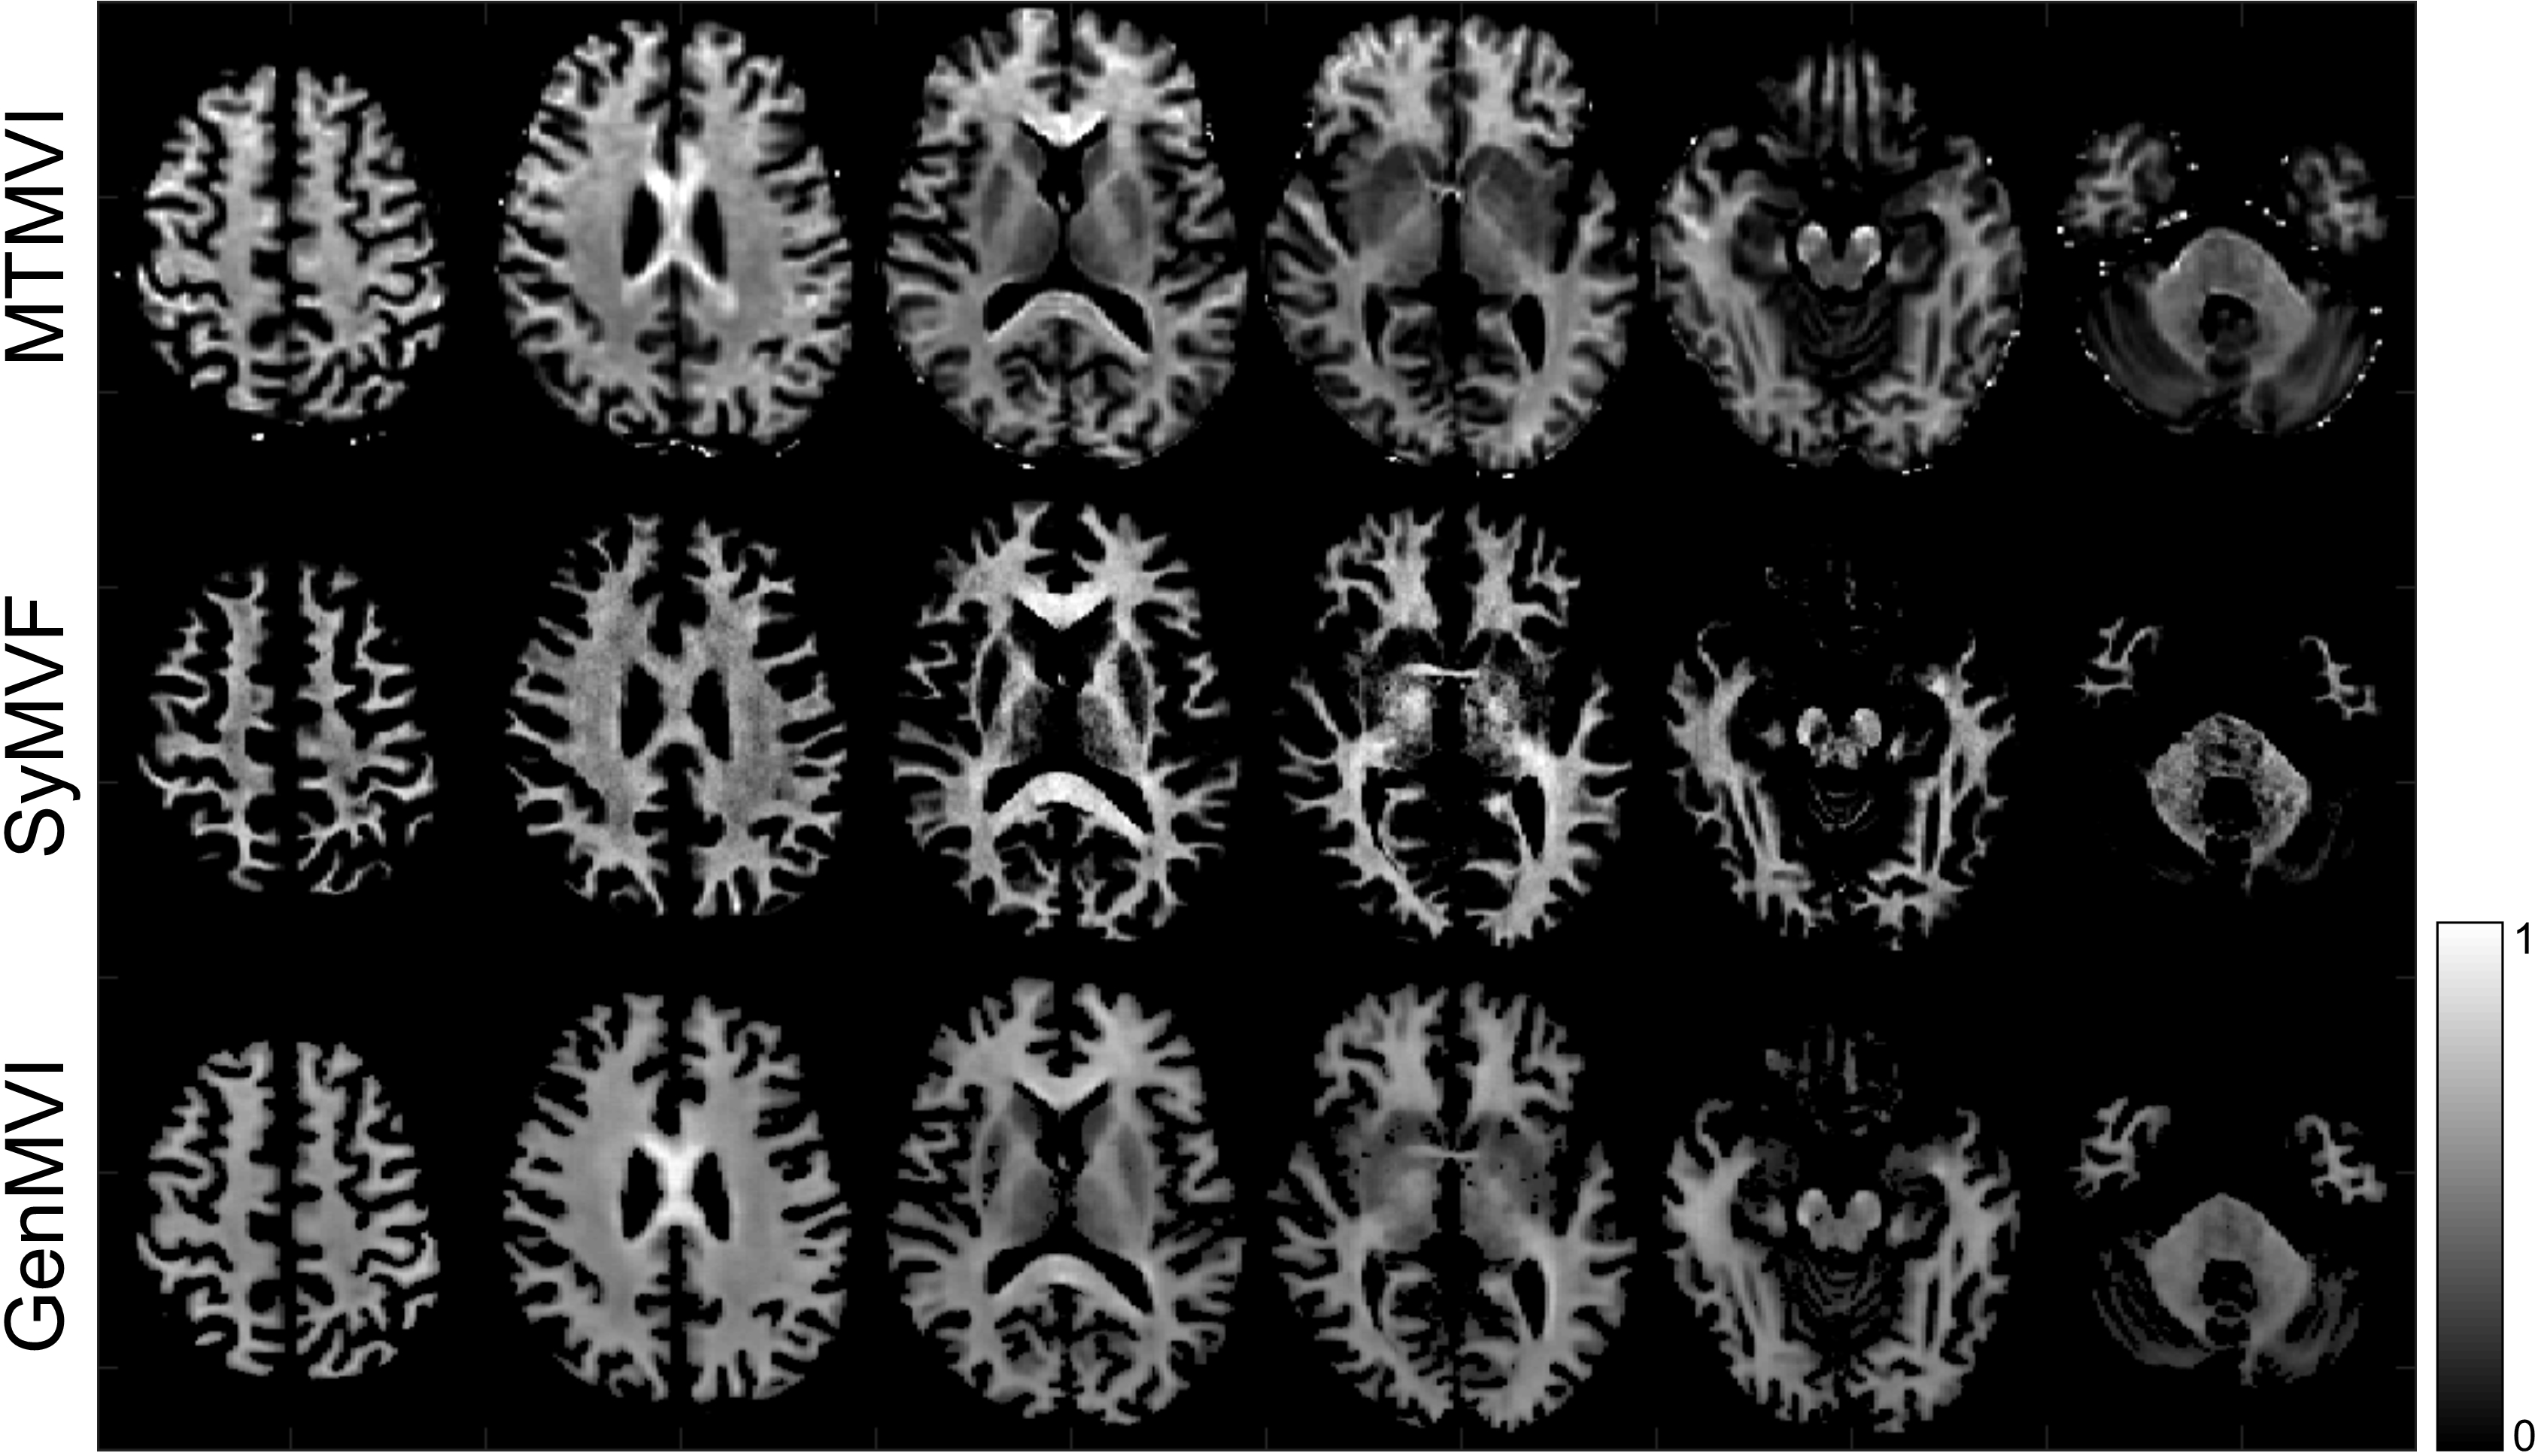
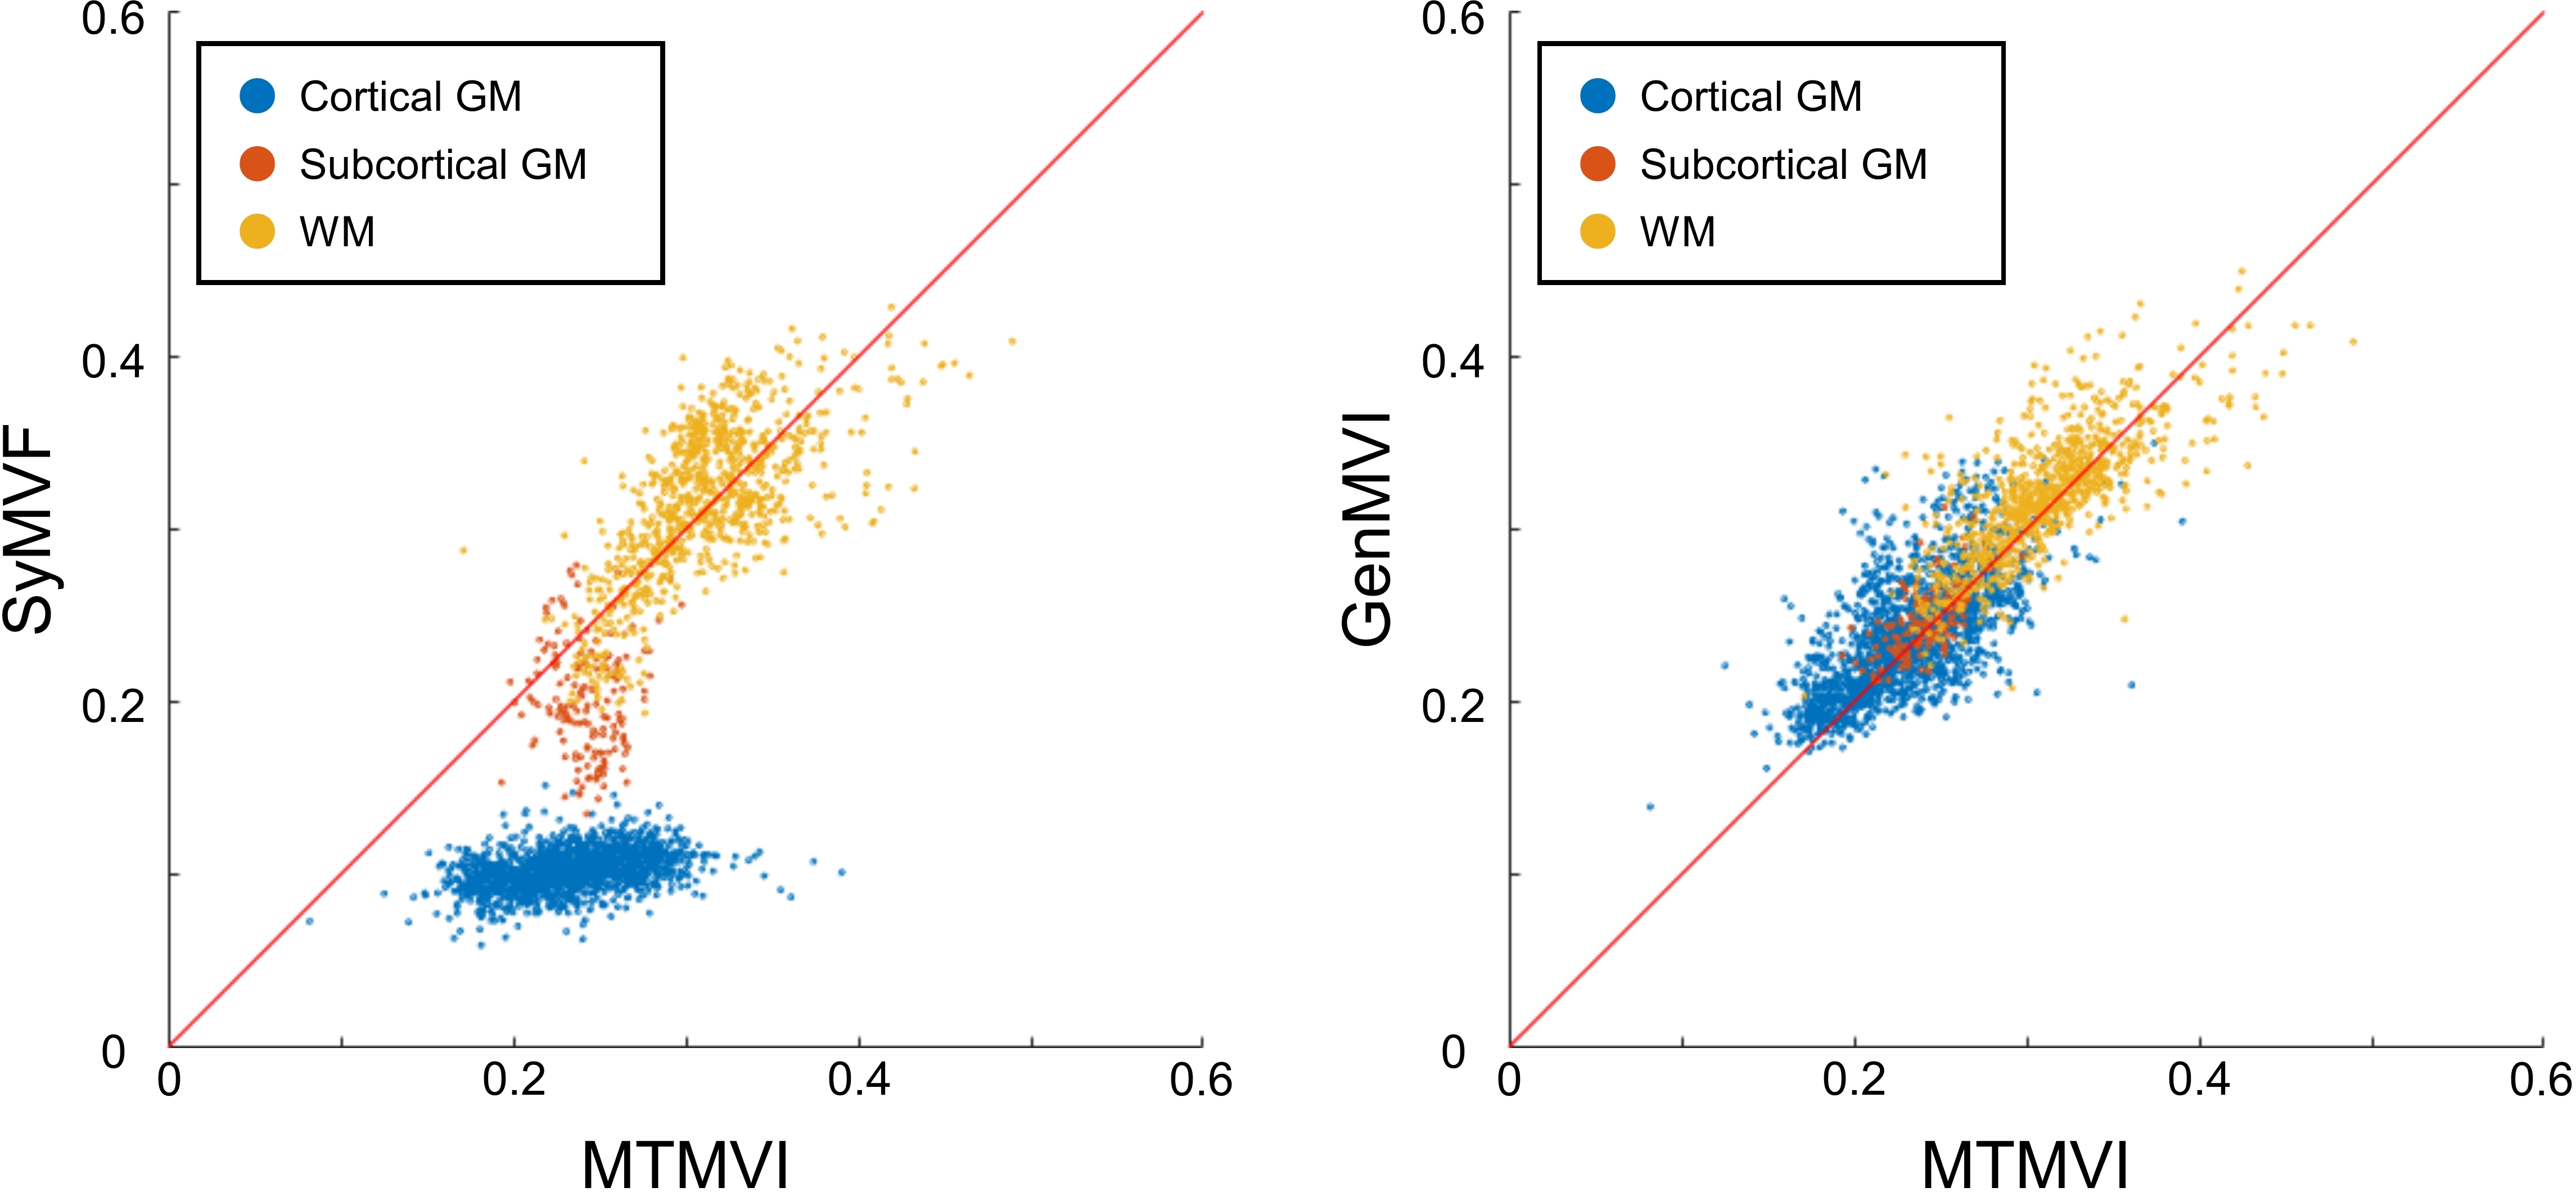
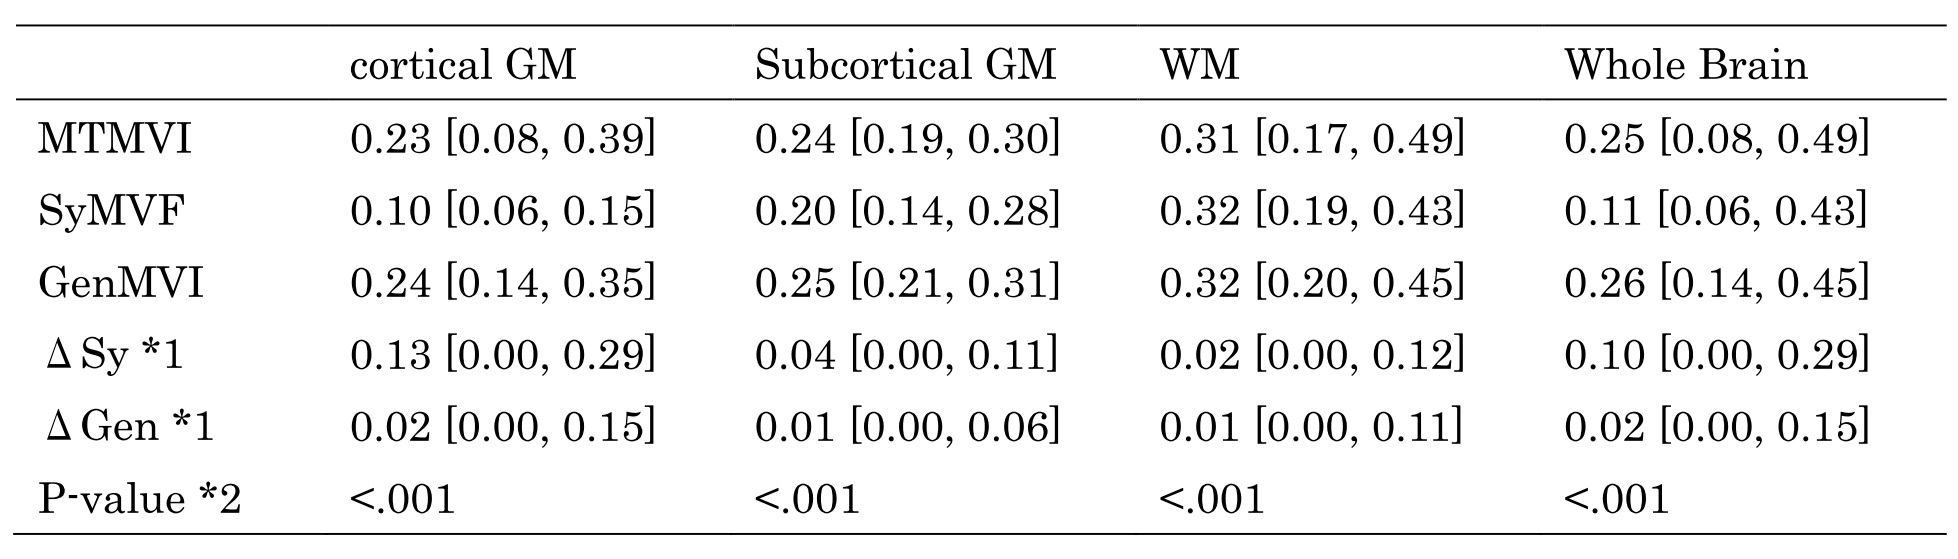
Table 1: The absolute errors between the SyMVF and MTMVI maps (ΔSy), and between the GenMVI and MTMVI maps (ΔSy)
The results are presented as median [min, max].
*1 ΔSy = |SyMVF - MTMVI|, ΔGen = |GenMVF - MTMVI|
*2 Comparison betweenΔSy andΔGen (Wilcoxon signed-rank test, P<.05 considered as significant.