2838
Applying Unsupervised Machine Learning Techniques to Resting-State BOLD Multicenter Neuroimaging of Pre-adolescent Complex Congenital Heart Disease Patients to Enhance Image Harmonization and Predict Motion Artifact Characteristics1Department of Biomedical Informatics, University of Pittsburgh, Pittsburgh, PA, United States, 2Pediatric Radiology, UPMC Children's Hospital of Pittsburgh, Pittsburgh, PA, United States
Synopsis
Resting-state BOLD MR images are invaluable for evaluating the neurocognitive state of patients, particularly populations at high risk for neurodevelopmental impairment; however, BOLD images are highly susceptible to motion. The combination of machine learning and image reconstruction techniques during and after BOLD image acquisition holds great promise for harmonizing images and recovering motion-corrupted data. However, there is little information about the relationship between unsupervised ML techniques and characteristics of resting BOLD images. We examined
Introduction
Resting-state BOLD MR images are often used to examine and evaluate the functional connectivity of different areas of the brain. Because of the MR protocol required to obtain these images, they are highly susceptible to motion. Researchers and clinicians have developed various behavioral and sedation-based protocols to prevent a patient from moving during image acquisition; however, these protocols are often not compatible with resting-state BOLD imaging and fail to completely eliminate all sources of motion in an image. Acquired images often must pass through one of many motion correction pipelines to account for the spatial and spin gradient effects of motion on the image contents1,2. Protocol compliance and image harmonization can also influence characteristics of resting BOLD data acquired as part of multi-center neuroimaging studies. Quality assurance measures are used to determine if an image needs to undergo this process as well as if the motion correction was successful. The “gold standards” for resting-state BOLD image usability are the positional and signal change thresholds developed by Power et al3. We applied these thresholds to a set of 129 resting-state BOLD images of case and control adolescent subjects and found that a total of 71 images are not usable. We suggest that there are features that may be representative of different groups of subjects that ultimately impact whether a subject's image is usable according to existing quality assurance metrics.Methods
Cohort
The subjects in this study were enrolled in an IRB-approved multicenter neuroimaging study of cardiovascular and neurological development. A total of 43 controls and 78 CHD subjects were recruited from 10 sites. The subjects were scanned using the following parameters: FOV = 256mm, TE/TR = 32/650ms, a multiband factor of 4, and an isotropic voxel size of 4.0 mm. Two multiband image sequences were acquired for each subject consisting of 470 volumes each. Demographic, behavioral/neurocognitive, and longitudinal risk factor information about each subject was also collected.
Characterizing Motion
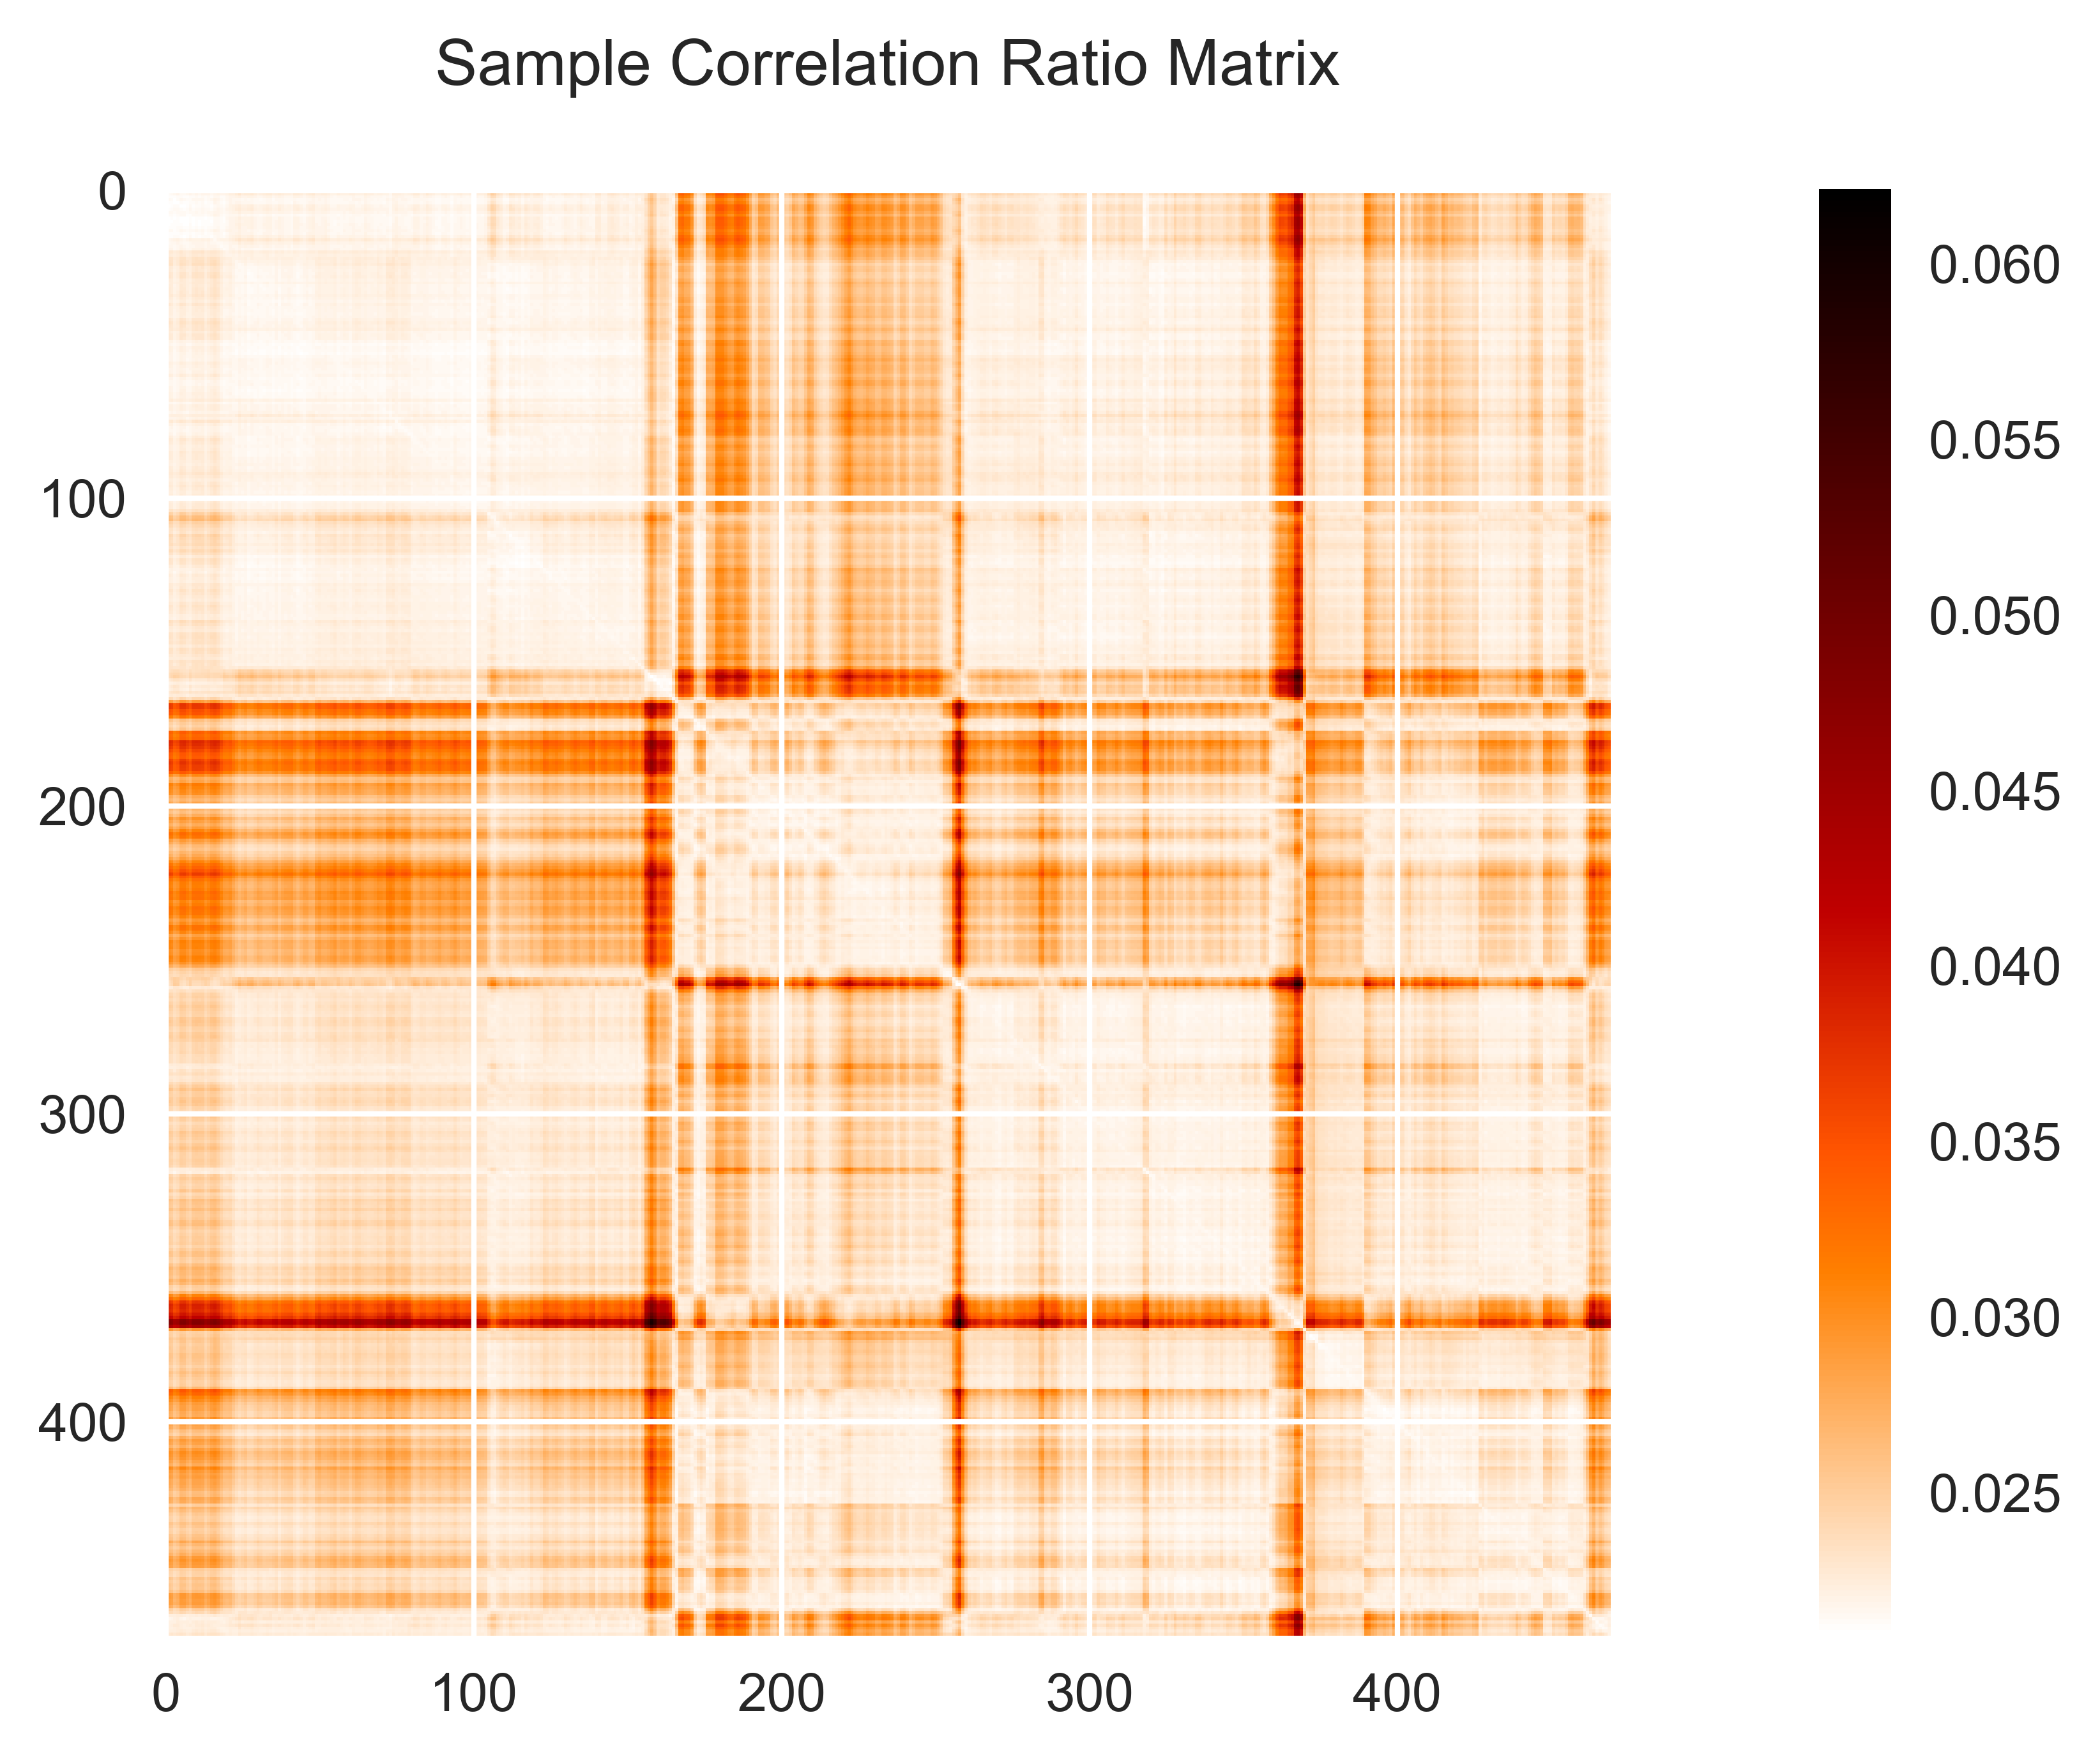
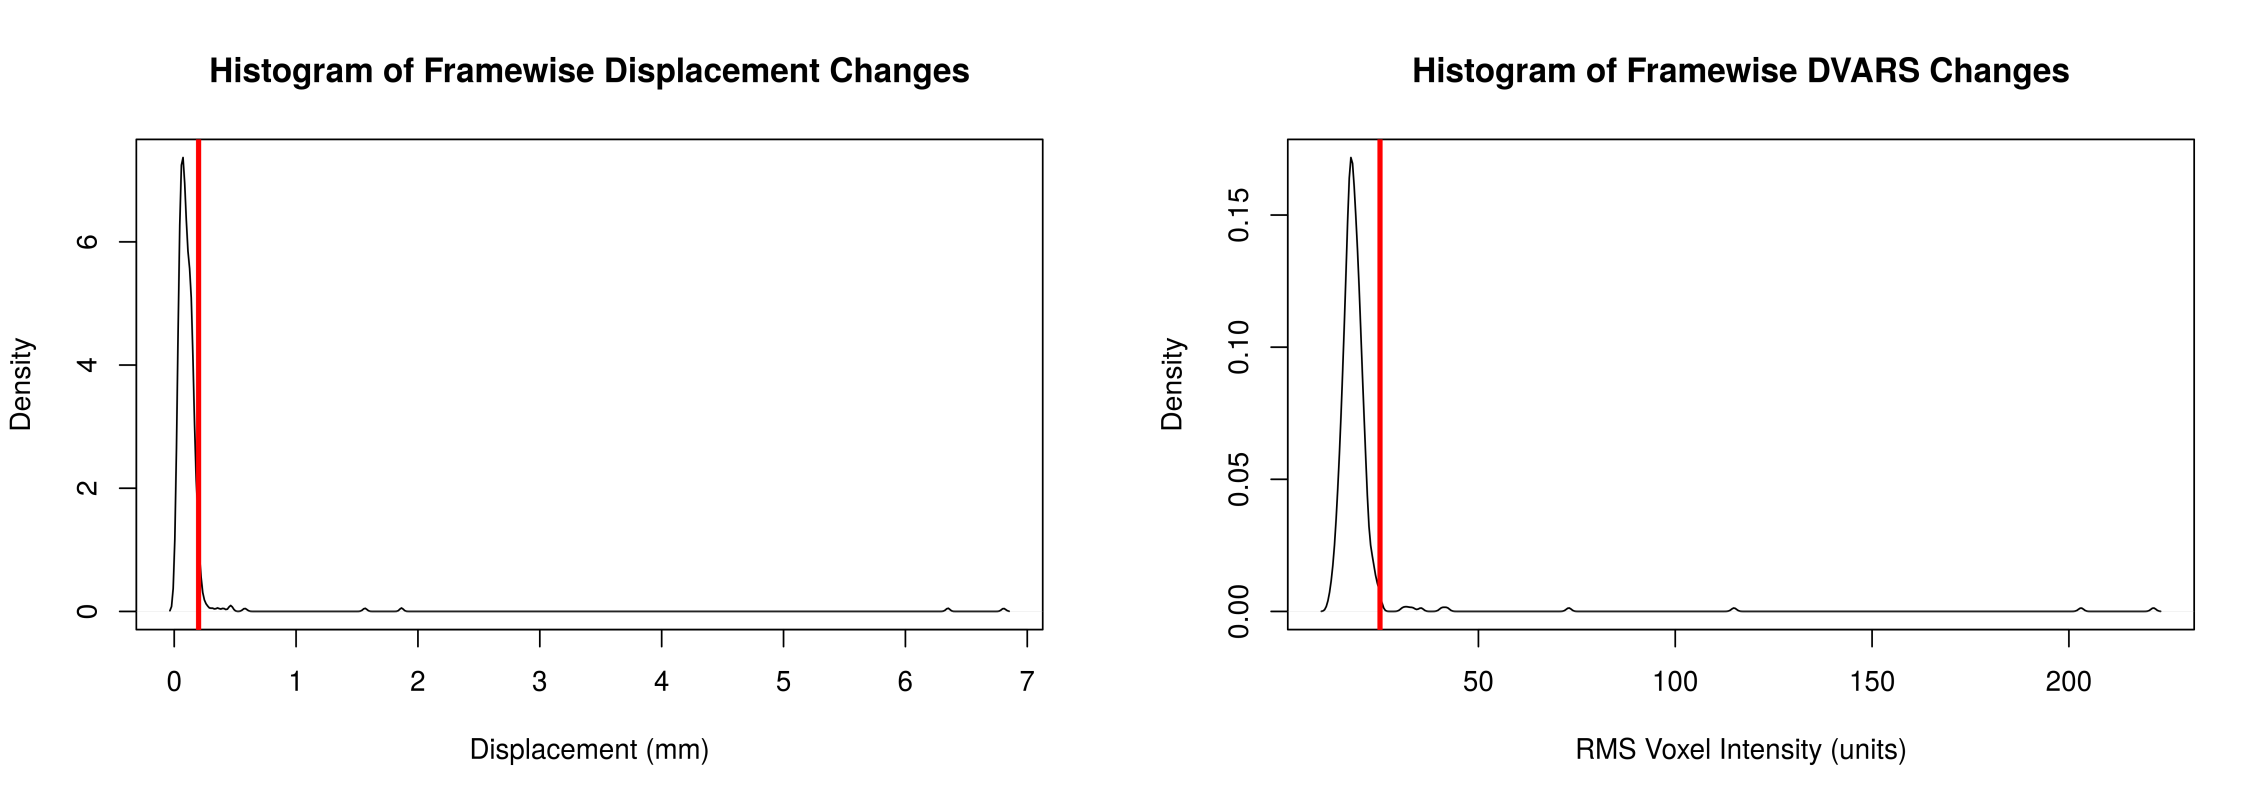
We developed a set of features to represent global and local motion in each image. The metric used to measure global patterns in motion throughout the entire image sequence was the correlation ratio. The correlation ratio measures the difference between a pair of volumes4. For each image sequence, we calculated the correlation ratio between every volume and every other volume in the sequence. This process generated a symmetric matrix of correlation ratios for each image (Figure 1). The metrics used to measure local motion patterns are Power et al’s displacement and signal change metrics. These metrics were calculated between each pair of neighboring volumes. These metrics for a single subject can be seen as histograms in Figure 2.
Evaluation
We applied unsupervised machine learning techniques to different combinations of the feature sets. We looked for groups that could be identified using the basic demographic data and each combination of global and local feature sets. The unsupervised machine learning techniques we used were k-means clustering and agglomerative clustering.
Results
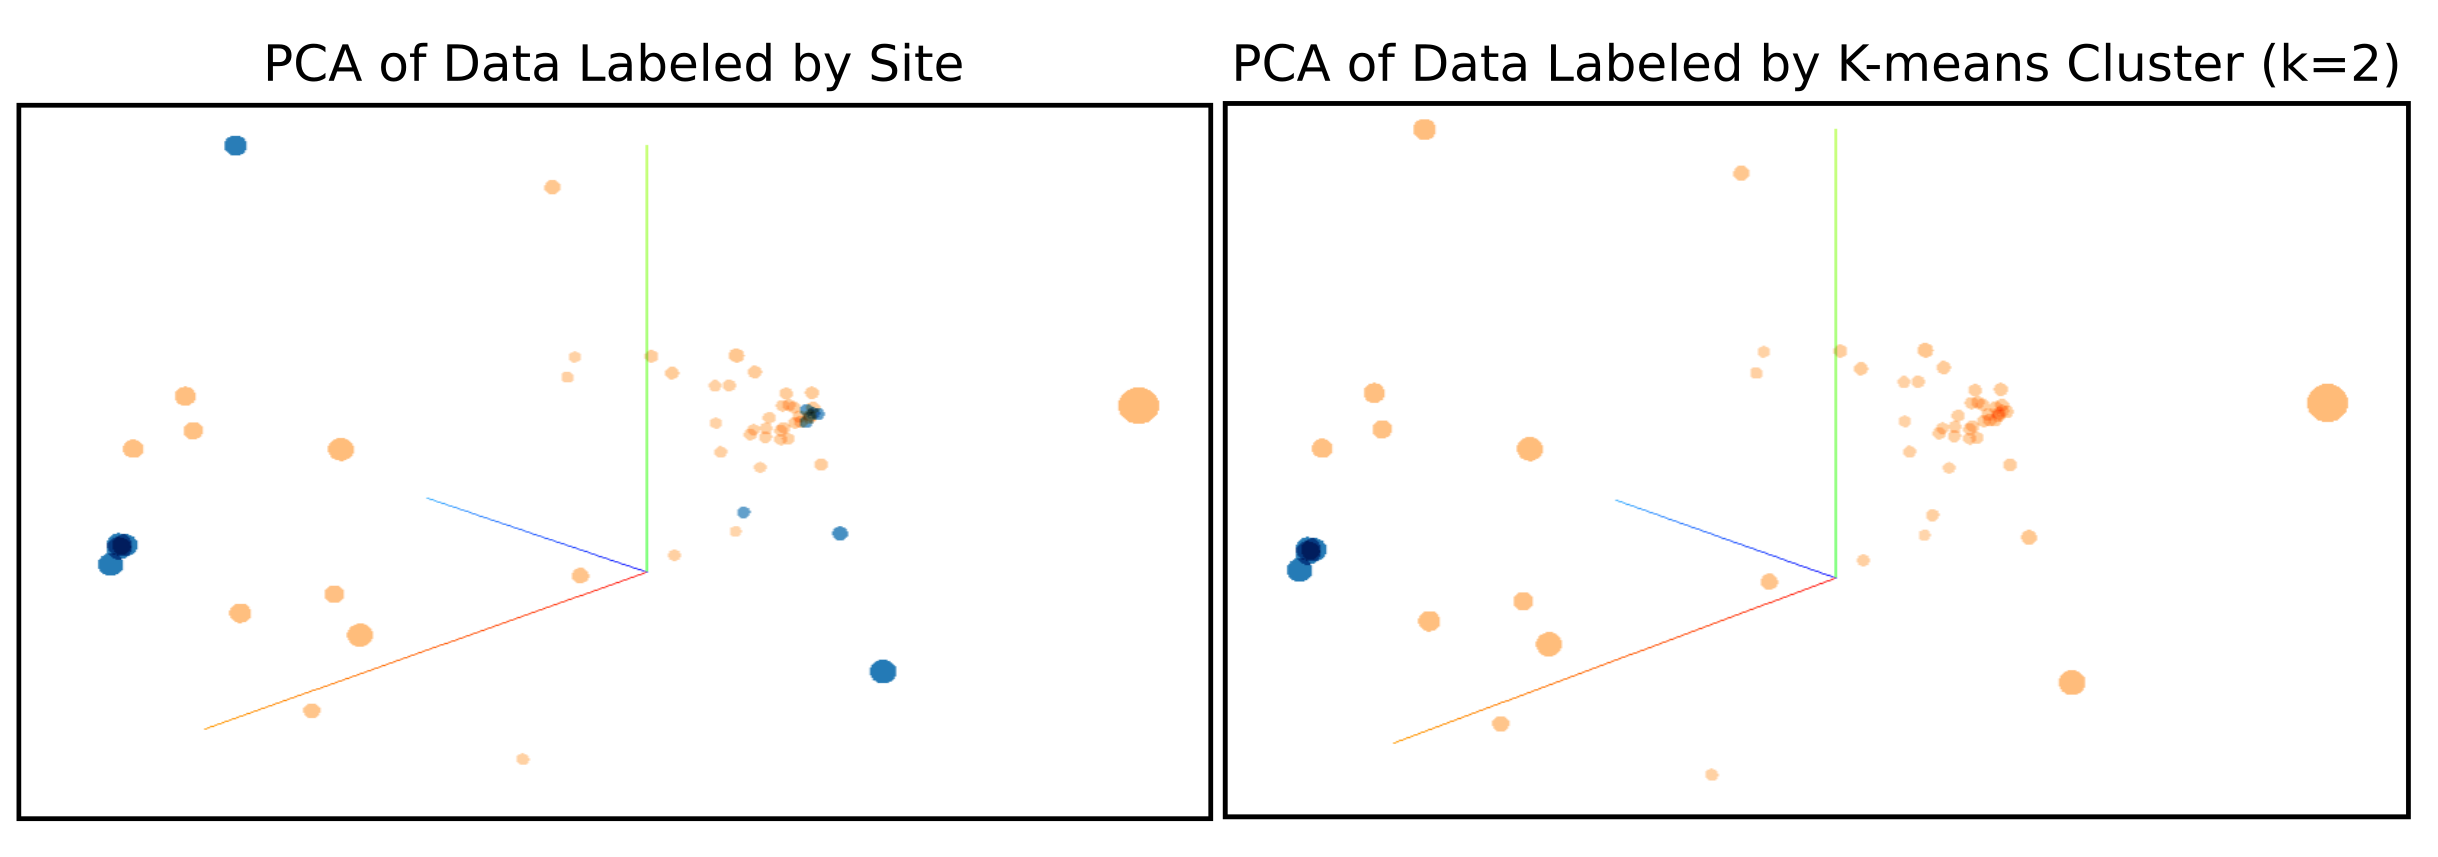
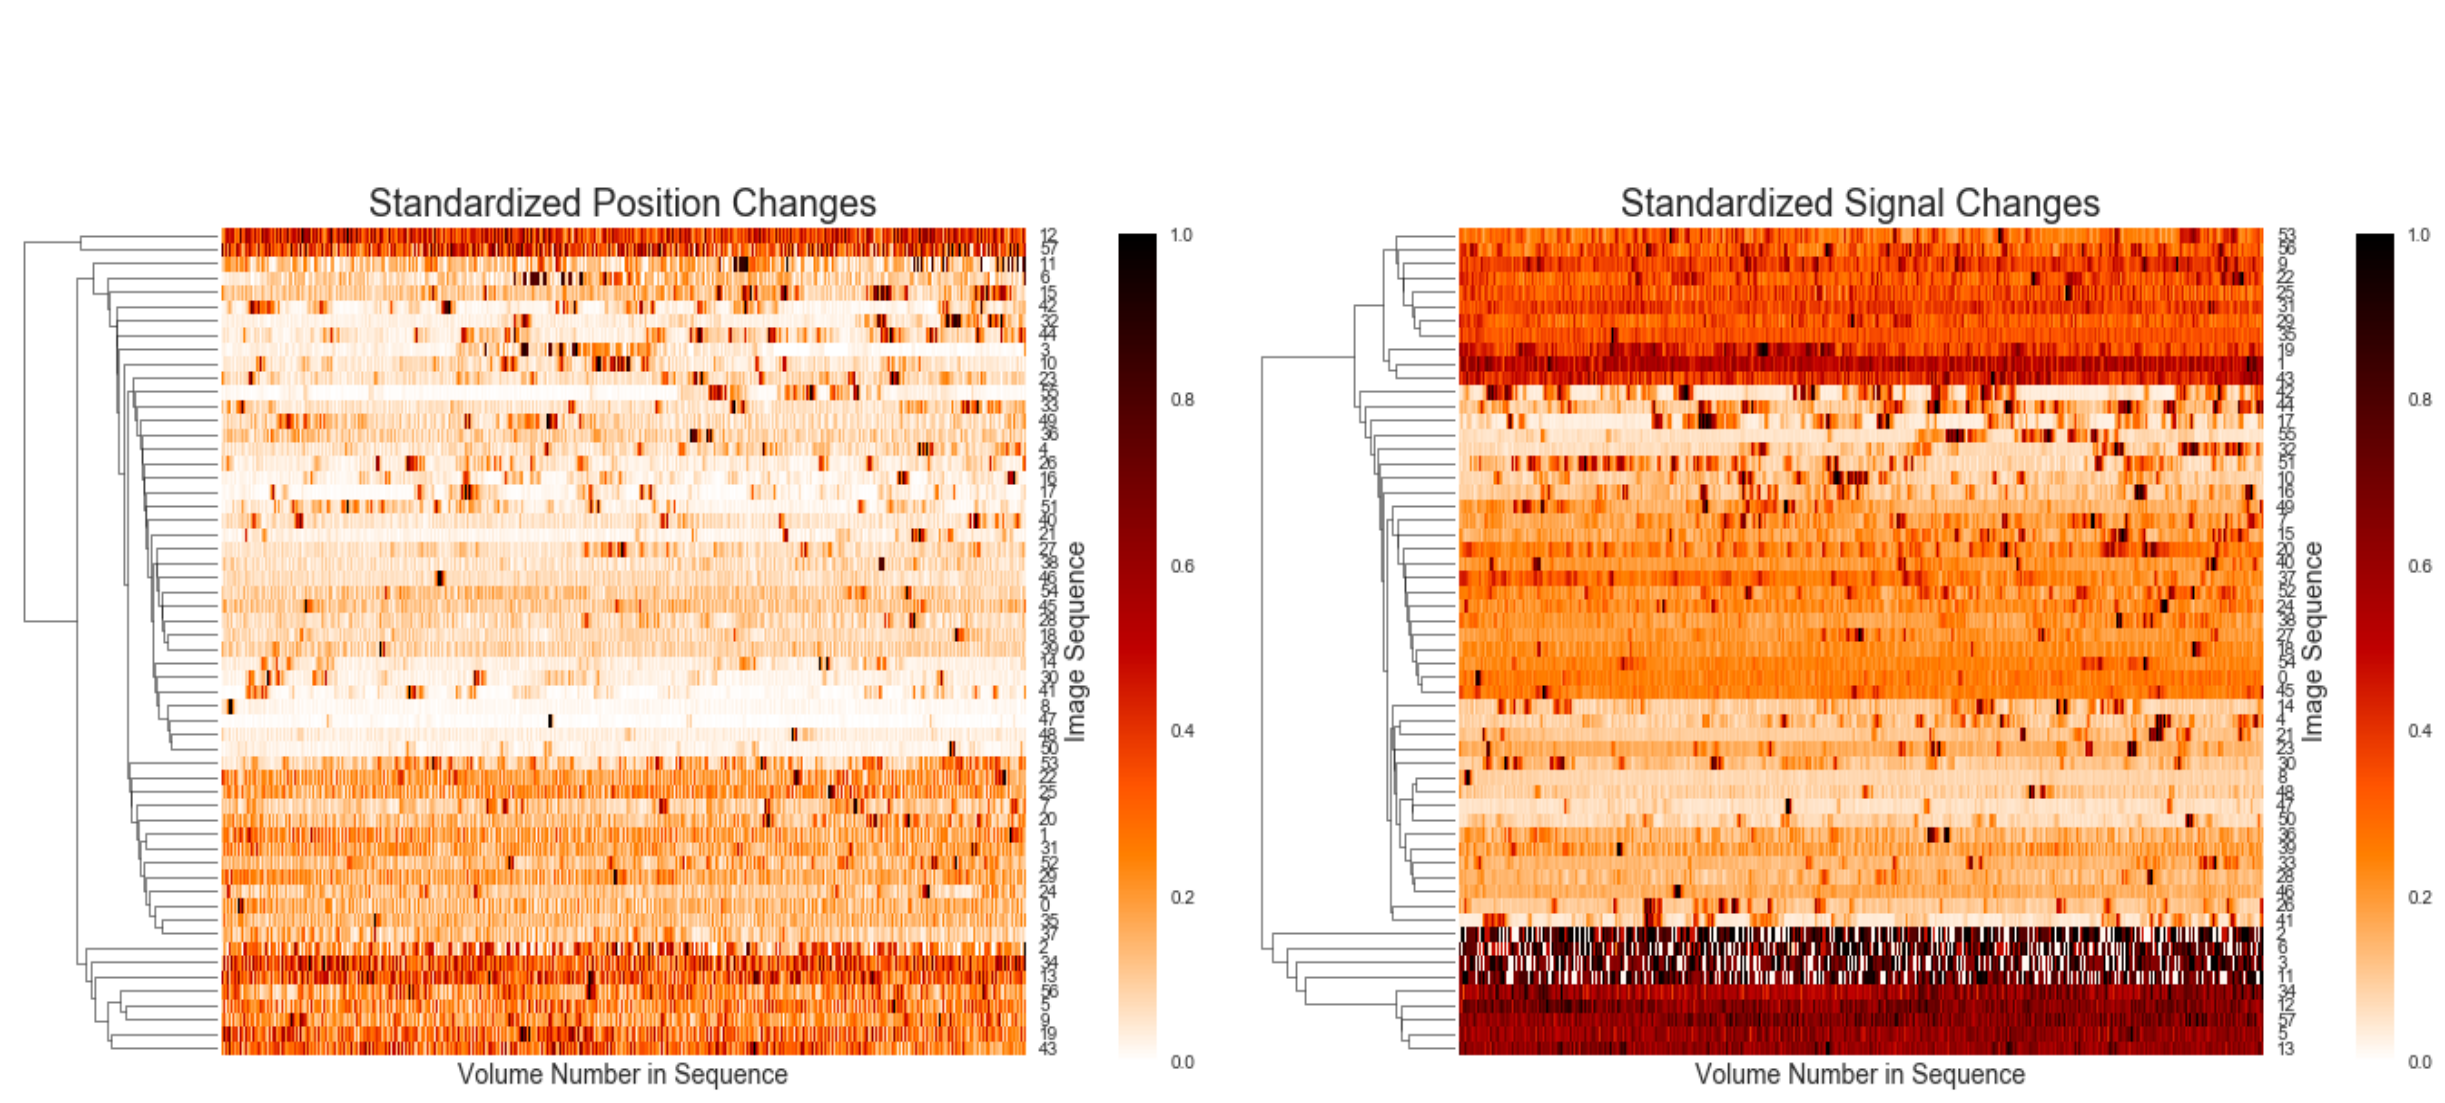
The results of the k-means clustering were visualized using the TensorFlow Online tool (Figure 3). The results of the agglomerative clustering were visualized using a set of heat maps (Figure 4).Discussion
The k-means clustering (Figure 3) shows that the global and local features did not contain any site-specific artifacts that could confound the unsupervised ML techniques. The agglomerative clustering of local and global features shows that there are subtle groups of subject motion in this dataset. Our ongoing work will further correlate these clusters with demographic data, longitudinal clinical risk factors, and neurocognitive/neurobehavioral outcomes.Conclusion
Our study examines resting BOLD data acquired as part of the multi-center neuroimaging study of pre-adolescent complex CHD patients and controls, a high proportion of which is corrupted by motion. We demonstrate the use of unsupervised machine learning techniques to not only inform harmonization characteristics of the multi-center acquired resting BOLD data, but also important features of the motion artifact. Our future work is aimed at using these techniques to better clinically characterize the CHD/controls subjects that are at the highest risk of failure of resting BOLD acquisition so that preventive measures (i.e use of mock scanners, iterative motion assessment during acquisition) may be used to mitigate motion. This work also provides baseline information to develop future pipelines that will combine imaging reconstruction and machine learning techniques to mitigate the effects of motion on resting state measures of brain connectivity.Acknowledgements
This work was supported in part by the National Library of Medicine (T15LM007059).References
1. Friston K, Williams S, Howard R, et al. Movement-related effects in fMRI time-series. Magnetic Resonance in Medicine. 1996;35(3):346-355.
2. Liao R, Krolik J, McKeown M. An information-theoretic criterion for intrasubject alignment of FMRI time series: Motion corrected independent component analysis. IEEE Transactions on Medical Imaging. 2005;24(1):29–44.
3. Power J, Barnes K, Synder A, et al. Spurious but systematic correlations in functional connectivity MRI networks arise from subject motion. NeuroImage. 2012;59(3):2142–2154.
4. Roche A, Malandain G, Pennec X, et al. The correlation ratio as a new similarity measure for multimodal image registration. Lecture Notes in Computer Science: Medical Image Computing and Computer-Assisted Intervention (MICCAI'98). 1998;1496.
Figures