2837
Estimating the Age of Healthy Children Based on Myelination Pattern in Brain MRI using a Deep Learning Neural Network Method1Department of Radiological Sciences, Graduate School of Human Health Sciences, Tokyo Metropolitan University, Tokyo, Japan, 2Department of Radiology, Juntendo University Graduate School of Medicine, Tokyo, Japan
Synopsis
In this study, we used deep learning model to estimate the age of children based on the MR signal changes associated with myelination process on T1 and T2-weighed images. Brain MR images of 119 children age ranging from 0.25 to 24 months were first used as a training and test dataset. The age was then estimated by deep learning model based on the T1-WI and T2-WI dataset and T1-WI only dataset. Our results showed that convolution neural network model using T1WI and T2WI dataset demonstrated higher correlation and lower mean absolute error (MAE) compared to T1-WI only dataset.
Background and Purpose
Myelination is an essential component of brain maturation in children. This process can appear as signal changes (i.e., reduce T1 and T2 relaxation times) in T1 weighted image (WI) and T2 WI that related to increasing lipid and protein contents and a decrease of tissue water in the white matter.1-4 Until now, the neurologic development of children is usually subjectively evaluated by comparing the estimated age from the MR signal distribution of the white matter with the real age. The purpose of this study was to develop a machine learning (ML) model to estimate the age of children from the MR images reflecting the myelination objectively.Methods
Data Acquisition and Pre-Processing
This study included 119 children age ranging from 0.25 to 24-month-old without any abnormalities in neurological and brain structural MRI examination (Figure 1). Whole brain 2D T1- and T2-WIs were obtained using a 1.5T (MAGNETOM Avanto, Siemens Healthcare, Erlangen, Germany; T1WI: TR/TE = 530/11 or 602/13, T2WI: TR/TE = 4040/92 or 4100/94) and a 3T (Achieva, Philips Healthcare, Amsterdam, Netherlands; T1WI: TR/TE = 2256/10 or 2155/10, T2WI: TR/TE = 4000/80 or 2000/140) MR scanners with 4.5-5.5 mm slice thickness. Axial images in 5 different levels: (a) middle cerebellar peduncle of the pons, (b)midbrain, (c) splenium of the corpus callosum and internal capsule, (d) centrum semiovale, and (e) subcortical white matter were extracted and adopted as a training and test dataset for ML. These images were converted from digital imaging and communications in medicine into bitmap then cropped and resized to a resolution of 128×128. Fig. 2 and 3 show the example of preprocessed images and the full data, respectively.
DL framework
Two types of deep learning neural network models were constructed using SONY neural network console ver. 1.20 (https://dl.sony.com/) on a Windows PC Intel Corei7 2.2GH, 32GB memory, with graphical processing unit NVIDIA GeForce GTX 1070. Each learning model consisted of 3 convolutional layers and 6 fully connected layers for T1WI only dataset and T1- and T2-WIs dataset (Figure 4). To build the ML model, the following solver parameters were used for training: 100 epochs; base learning rate for untrained model, Adam (learning rate = 0.001, beta_1 = 0.9, beta_2 =0.999, epsilon = 0.00000001).
Evaluation of the model
In evaluation of the deep learning model, the 4-fold cross-validation method was employed. For a validation, test data was evaluated 10 times and these output values were averaged to obtain final output. The correlation coefficient and Mean Absolute Error (MAE) were calculated between estimated age by ML model and true age using SPSS version 13.
Results
The scatterplots between estimated age by ML model and true age are shown in Figure 5. For the deep learning model using T1-WI only dataset, the correlation coefficient and MAE were 0.921 (p < 0.001) and 1.88 months, respectively. While for T1- and T2WIs dataset, the correlation coefficient and MAE were 0.931 (p < 0.001) and 1.79 months, respectively. Furthermore, by adding T2-WI to T1-WI dataset, the age overestimation in children below 12 months and age underestimation in children above 12 months were improved.Discussion
Brain myelination in children’s brain begins before birth and progresses rapidly within the first two years after birth started from the caudal to rostral, dorsum to ventral and central to peripheral parts of the brain.5-7 Myelination trajectories appear as white matter signal changes conventional T1- and T2-WIs reflecting the change of tissue water and myelin lipids.1-4 Barkovich et al. were then established a chart of age based on signal change on T1- and T2-WIs and this milestone chart helps radiologists who specialize in the neuroimaging of children.8-13 The ML is superior in recognizing shape, color and geographic pattern of an object.14 Therefore, it is expected that ML can recognize MR signal changes reflecting the myelination and can estimate the development of children’s brain. In our investigation, the estimated age provided by deep learning models showed strong correlations with true age. Adding T2-WI to T1-WI dataset improved the accuracy of the deep learning model in children below 12 months and above 12 months.Conclusion
A deep learning neural network model can estimate the progression of the children brain myelination based on MR signal distribution.Acknowledgements
No acknowledgement found.References
- Dietrich RB, Bradley WG, Zaragoza EJ 4th, et al. MR evaluation of early myelination patterns in normally and developmentally delayed infants. AJR Am J Roentgenol. 1987;150:889-896.
- Ballesteros MC, Hansen PE, Soila K. MR imaging of the developing human brain. Part 2. Postnatal development. Radiographics. 1993;13:611-622.
- Paus T, Collins DL, Evans AC, Leonard G, Pike B, Zijdenbos A. Maturation of white matter in the human brain: a review of magnetic resonance studies. Brain Res Bull. 2001;54:255-266.
- Leppert IR, Almli CR, McKinstry RC, et al. T2 relaxometry of normal pediatric brain development. J Magn Reson Imaging. 2009 ;29:258-267.
- Yakovlev PI, Leours AR. The myelogenetic cycles of regional maturation of the brain. In: Regional development of the brain in early life (Minkowski A, ed). Oxford: Blackwell. 1967:3-70.
- Kinney HC, Brody BA, Kloman AS, et al. Sequence of central nervous system myelination in human infancy. II. Patterns of myelination in autopsied infants. J Neuropathol Exp Neurol. 1988;47:217-234.
- Casey BJ, Giedd JN, Thomas KM. Structural and functional brain development and its relation to cognitive development. Biol Psychol. 2000;54:241-257.
- Barkovich AJ, Kjos BO, Jackson DE Jr, et al. Normal maturation of the neonatal and infant brain: MR imaging at 1.5 T. Radiology. 1988;166:173-180.
- Bird CR, Hedberg M, Drayer BP, et al. MR assessment of myelination in infants and children: usefulness of marker sites. AJNR Am J Neuroradiol. 1989;10:731-740.
- Christophe C, Muller MF, Baleriaux D, et al. Mapping of normal brain maturation in infants on phase-sensitive inversion-recovery images. Neuroradiology. 1990;32:173.
- van der Knaap MS, Valk J. MR imaging of the various stages of normal myelination during the first year of life. Neuroradiology. 1990;31:459-470.
- Martin E, Kikinis R, Zuerrer M, et al. Developmental stages of the human brain: an MR study. J Comput Assist Tomogr. 1988; 12:917-922.
- Martin E, Krassnitzer S, Kaelin P, et al. MR imaging of the brainstem: normal postnatal development. Neuroradiology. 1991;33:391-395.
- Kaiming He, Xiangyu Zhang, Shaoqing Ren, et al. Delving Deep into Rectifiers: Surpassing Human-Level Performance on ImageNet Classification. in 2015 IEEE International Conference on Computer Vision (ICCV), 2015.
Figures

Figure 1. Distribution of subjects based on the age.
All subjects included 119 children from 0.25 to 24-month-old after birth. They didn’t have any neurologic abnormality.

Figure 2. Examples of preprocessed dataset from one subject.
Axial images in 5 different levels consisting of (a) middle cerebellar peduncle of pons, (b) Midbrain, (c) splenium of corpus callosum and internal capsule, (d) centrum semiovale and (e) subcortical white matter were extracted and adopted as a training and test dataset for ML.


Figure 4. Deep learning neural network architecture which was used in this study.
Each learning model consisted of 3 convolutional layers and 6 fully connected layers for T1WI only dataset and T1- and T2-WIs dataset. To build the ML model, the following solver parameters were used for training: 100 epochs; base learning rate for untrained model, Adam (learning rate = 0.001, beta_1 = 0.9, beta_2 =0.999, epsilon = 0.00000001).
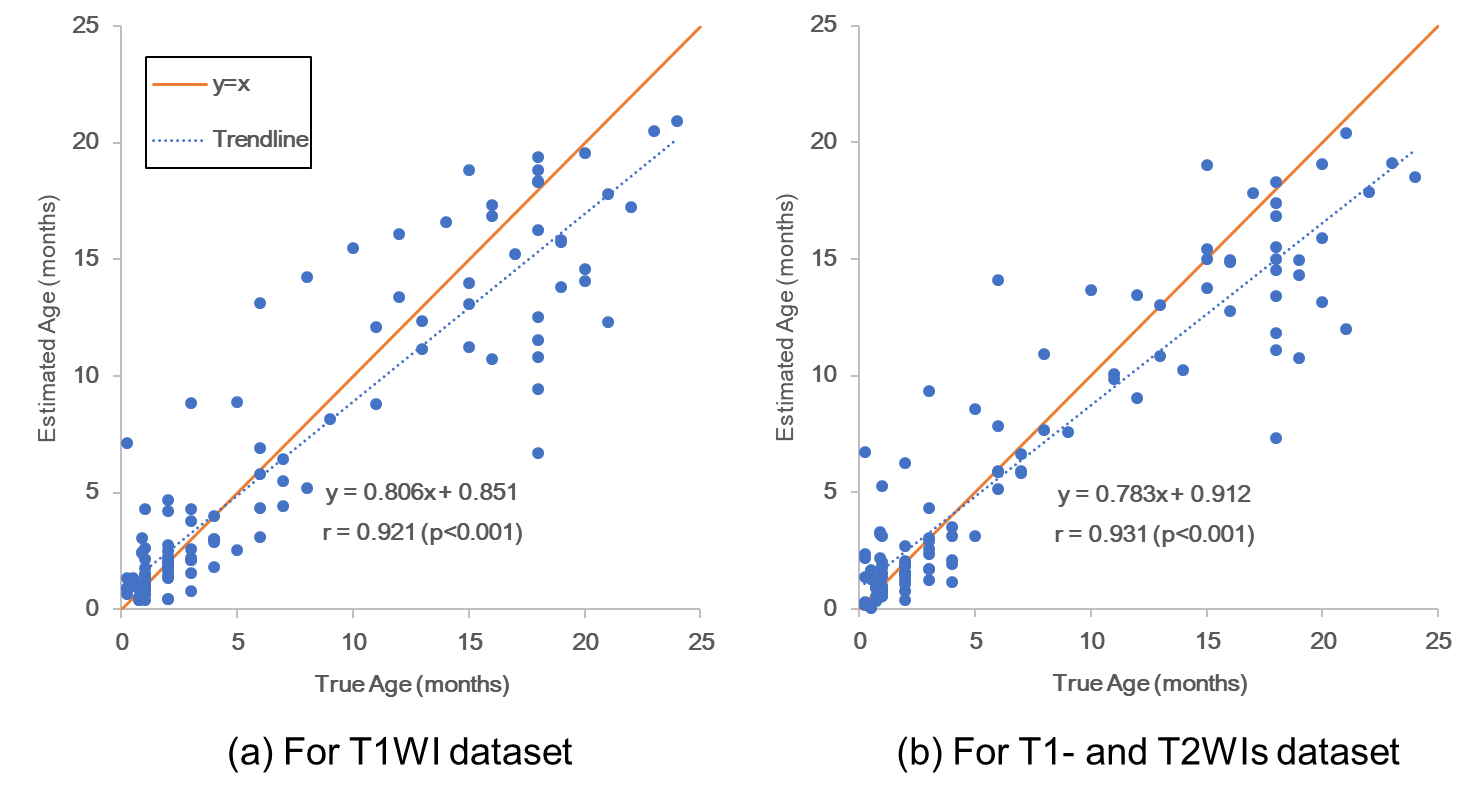
Figure 5. Scatterplots between estimated age by ML model and true age.
Red solid is y = x and blue dotted line is Trendline. For the deep learning model using T1-WI only dataset, the correlation coefficient and MAE were 0.921 (p < 0.001) and 1.88 months, respectively. While for T1- and T2WIs dataset, the correlation coefficient and MAE were 0.931 (p < 0.001) and 1.79 months, respectively. Furthermore, by adding T2-WI to T1-WI dataset, the age overestimation in children below 12 months and age underestimation in children above 12 months were improved.