2833
Standardization of MRI as Pre-Processing Method for Machine Learning Based SegmentationRobert T Wujek1,2 and Kathleen M Schmainda3
1Biomedical Engineering, The Medical College of Wisconsin, Milwaukee, WI, United States, 2Biomedical Engineering, Marquette University, Milwaukee, WI, United States, 3Biophysics, The Medical College of Wisconsin, Milwaukee, WI, United States
Synopsis
In this study, standardization methods are used to pre-process brain MRI to generate a machine learning dataset for tumor segmentation. This method was chosen for previously documented repeatability properties as compared to more widely used normalization methods, which could potentially lead to a more generalized segmentation model. When applied to the publicly available BRATS dataset, the standardization methods performed equally as well as the normalization method used in this study, which supports further analysis of the methods beyond the highly controlled BRATS dataset.
Introduction
Fully automated machine learning based segmentation methods can significantly increase processing speeds and reduce inter-observer variability. However, model performance can vary greatly depending on dataset pre-processing methodology. Intensity normalization methods are frequently used to impose consistent scaling on the entire dataset to simplify the learning process. The purpose of this study was to assess the utility of the standardization method previously described1,2 with respect to dataset preparation for training high grade glioblastoma segmentation models. This method was chosen for consideration due to previously documented application to MR data and superior repeatability compared to image normalization methods3.Methods
Dataset: The publicly available BRATS dataset4,5 was used for this study. This dataset includes 220 high grade glioma cases with high quality, pre-processed T2, T1, T1+C, and FLAIR MRI. Each patient image set includes radiologist annotated segmentations for edema, necrosis, non-enhancing, and enhancing tumor. The dataset was further processed in 3 different ways: (1) using the proposed standardization method applied to T1, T1+C, and FLAIR, (2) using the robust deviation normalization method described by Goetz et al6 applied to T1, T1+C, T2, and FLAIR, (3) no additional pre-processing (control). Each dataset was divided into training and testing groups at a ratio of 80:20 (176 and 44 patients, respectively). Model Architecture: A U-Net architecture was chosen for this study due to documented success with medical image segmentation and rapid model convergence7. Multiple changes were made to the published model including but not limited to the number of intermediate CNN blocks, the number of input/output channels, and the resolution of input/output channels. Training: A new model was trained using each of the 3 datasets, with the MR images as model input and the annotated segmentations as output (shown in Figure 1). RMSProp was used to minimize the cost function, which was the summation of cross-entropy and L2 weight penalties. All processing was performed in TensorFlow using Tesla K40m GPUs. Training time was approximately 5 hours per model. Analysis: After training was complete each model was evaluated using the respective test dataset. Predicted segmentations were grouped into “Whole Tumor”, “Tumor Core”, and “Active Tumor” ROIs in accordance with the BRATS assessment methods, and F1 (DICE) scores were used to compare the model predictions to the ground truth. This was the primary metric used to compare performance between the models.Results
The results from the analysis are presented in Table 1. Overall, the standardization and normalization methods each outperformed the control method, with the normalization method performing slightly better in Whole Tumor and Tumor Core segmentation. Qualitatively, sample segmentation predictions are shown in Figure 2. From observation, the segmentations agree with the relative performances presented in Table 1.Discussion/Conclusions
The results for this study suggest that dataset standardization is non-inferior to the chosen normalization method when applied to the BRATS segmentation challenge. These preliminary results support further investigation of the standardization method for machine learning dataset preparation. Further studies will likely include data from outside the highly controlled BRATS dataset, to confirm generalization of the standardization method. Also, alternative metrics to the F1 score should be considered to further gauge performance differences between the pre-processing methods.Acknowledgements
Funding was provided by NIH/NCI U01 CA176110 and the Robert C. Olson MD Endowment. Data was provided by the Multimodal Brain Tumor Segmentation Challenge 2018. This research was completed in part with computational resources and technical support provided by the Research Computing Center at the Medical College of Wisconsin.References
[1] D. Bedekar et al. Proceedings ISMRM 18, 2175 (2010). [2] Jensen T et al. J Magn Reson Imaging, 2009. 30(3): p. 481-9. [3] M.A. Prah et al. AJNR, 36(9): 1654-1661 (2015). [4] Menze BH, et al. IEEE Transactions on Medical Imaging, 34(10), 1993-2024 (2015). [5] Bakas S, et al. Nature Scientific Data, 4:170117 (2017). [6] Goetz M et al. Proceedings MICCAI BraTS (Brain Tumor Segmentation Challenge), pp. 6-11 (2014). [7] Ronneberger O et al. Medical Image Computing and Computer-Assisted Intervention, pp. 234–241 (2015).Figures
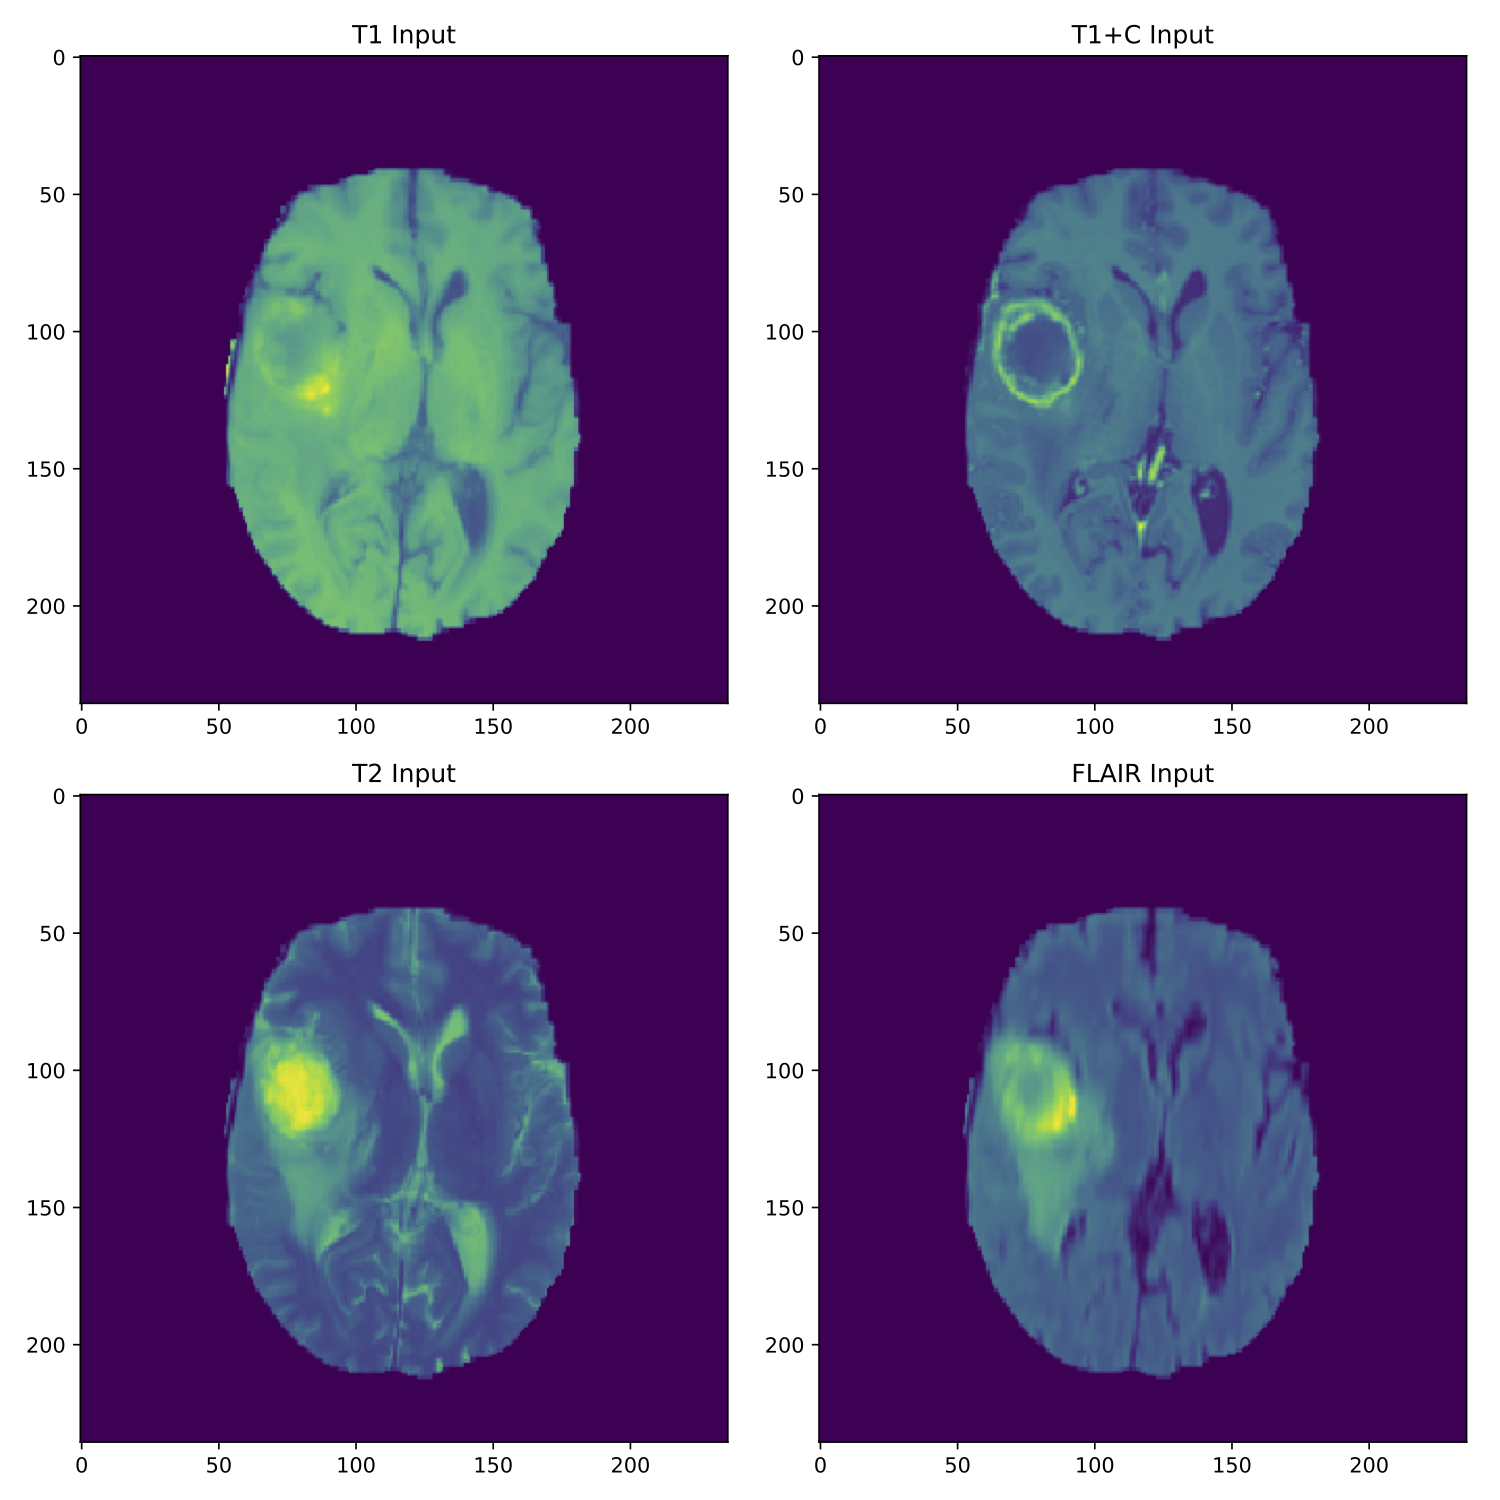
Figure 1 - Sample Input; This is a sample control input with T1 (top-left), T1+C (top-right), T2 (bottom-left), and FLAIR (bottom-right).
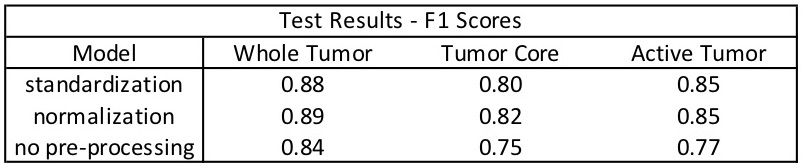
Table 1 - Test Results; The F1 scores associated with the 3 models suggest similar performance between the standardization and normalization methods. Both are superior to the control. F1 scores are the primary metric used for assessing the performance of the models.
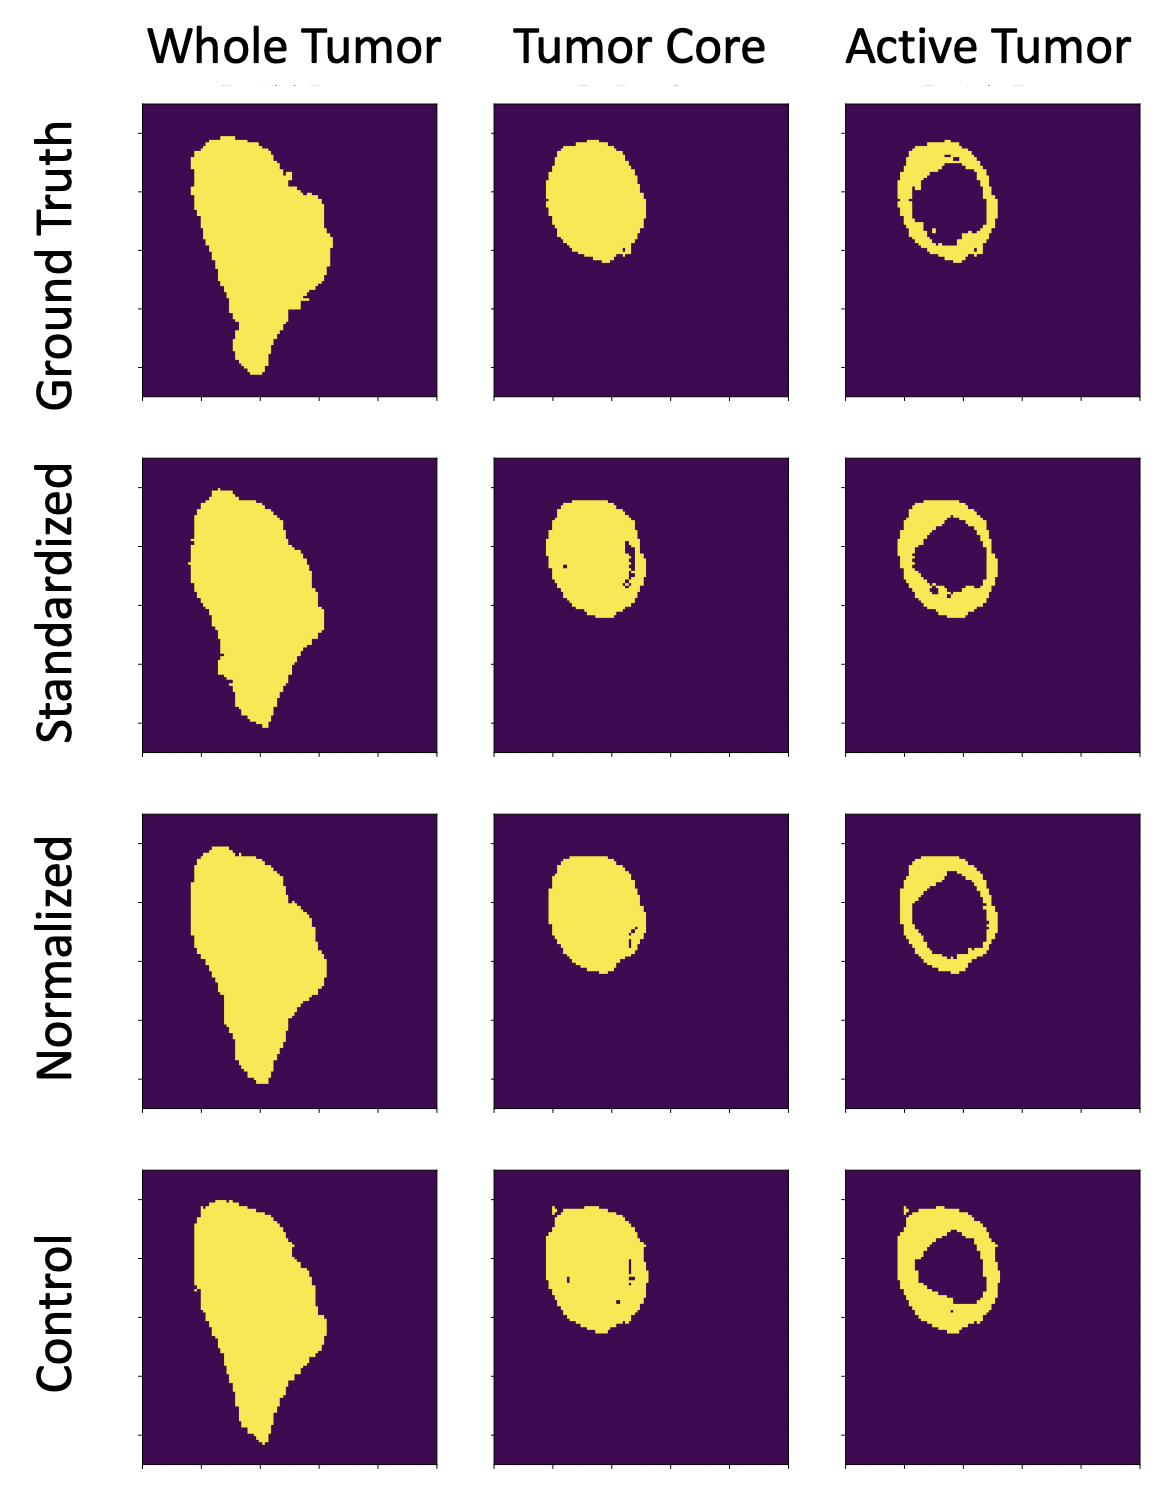
Figure 2 - Sample Outputs; The ground truth segmentations (top) can be qualitatively compared to the predicted segmentations generated by the 3 models. Generally, the ROIs are similar, but some false positives and negatives can be seen in the "Tumor Core" ROI specifically, as well as thickening of the "Active Tumor" ROI.