2832
Radiomics and machine learning analysis of brain lesions in MOG-ab-positive and AQP4-ab-positive patients1Department of Radiology, Huashan Hospital, Fudan University, Shanghai, China, 2Academy for Engineering & Technology, Fudan University, Shanghai, China
Synopsis
Little is known about the differences between the lesion features of the recently discovered MOG-ab-positive and well-demonstrated AQP4-ab-positive patients till now. We studied the radiomics features of 747 lesions from AQP4 patients, and 295 lesions from MOG patients. Seventy radiomic features were calculated and compared. Features with significant between-group discrimination ability input to the classifier and trained. A radiomics signature was obtained for the discrimination of MOG-ab-positive and AQP4-ab-positive patients. These results provide valuable information for understanding of pathogenesis and imaging-based initial diagnosis in the two subsets of patients.
INTRODUCTION
Recently, antibodies to myelin oligodendrocyte glycoprotein (MOG-ab) has been suggested to play a role in a subset of patients with neuromyelitis optica spectrum disorders (NMOSD) phenotypes, commonly separated from NMOSD patients with antibodies to aquaporin-4 (AQP4-ab). Considering the immunologic and clinical discrepancies between MOG-ab-positive and AQP4-ab-positive patients, a plausible hypothesis is that differences may exist between the brain impairments of the two patient populations. However, little is known about the differences between the lesion features of the two subgroups till now. The aim of this study is to use radiomics and machine learning methods to analyze the brain lesion images of the two groups.METHODS
Fifty-seven and thirty-three clinical MR examinations were performed on fifty-two AQP4-ab-positive and twenty-eight MOG-ab-positive patients, respectively. Hyper-intense T2 lesions were segmented manually on each axial FLAIR image. Each spatially connected cluster was extracted and treated as an independent volume-of-interest (VOI). Three-quarters of these lesions (781 lesions) were assigned as discovery set, and the others (261 lesions) were assigned as validation set.
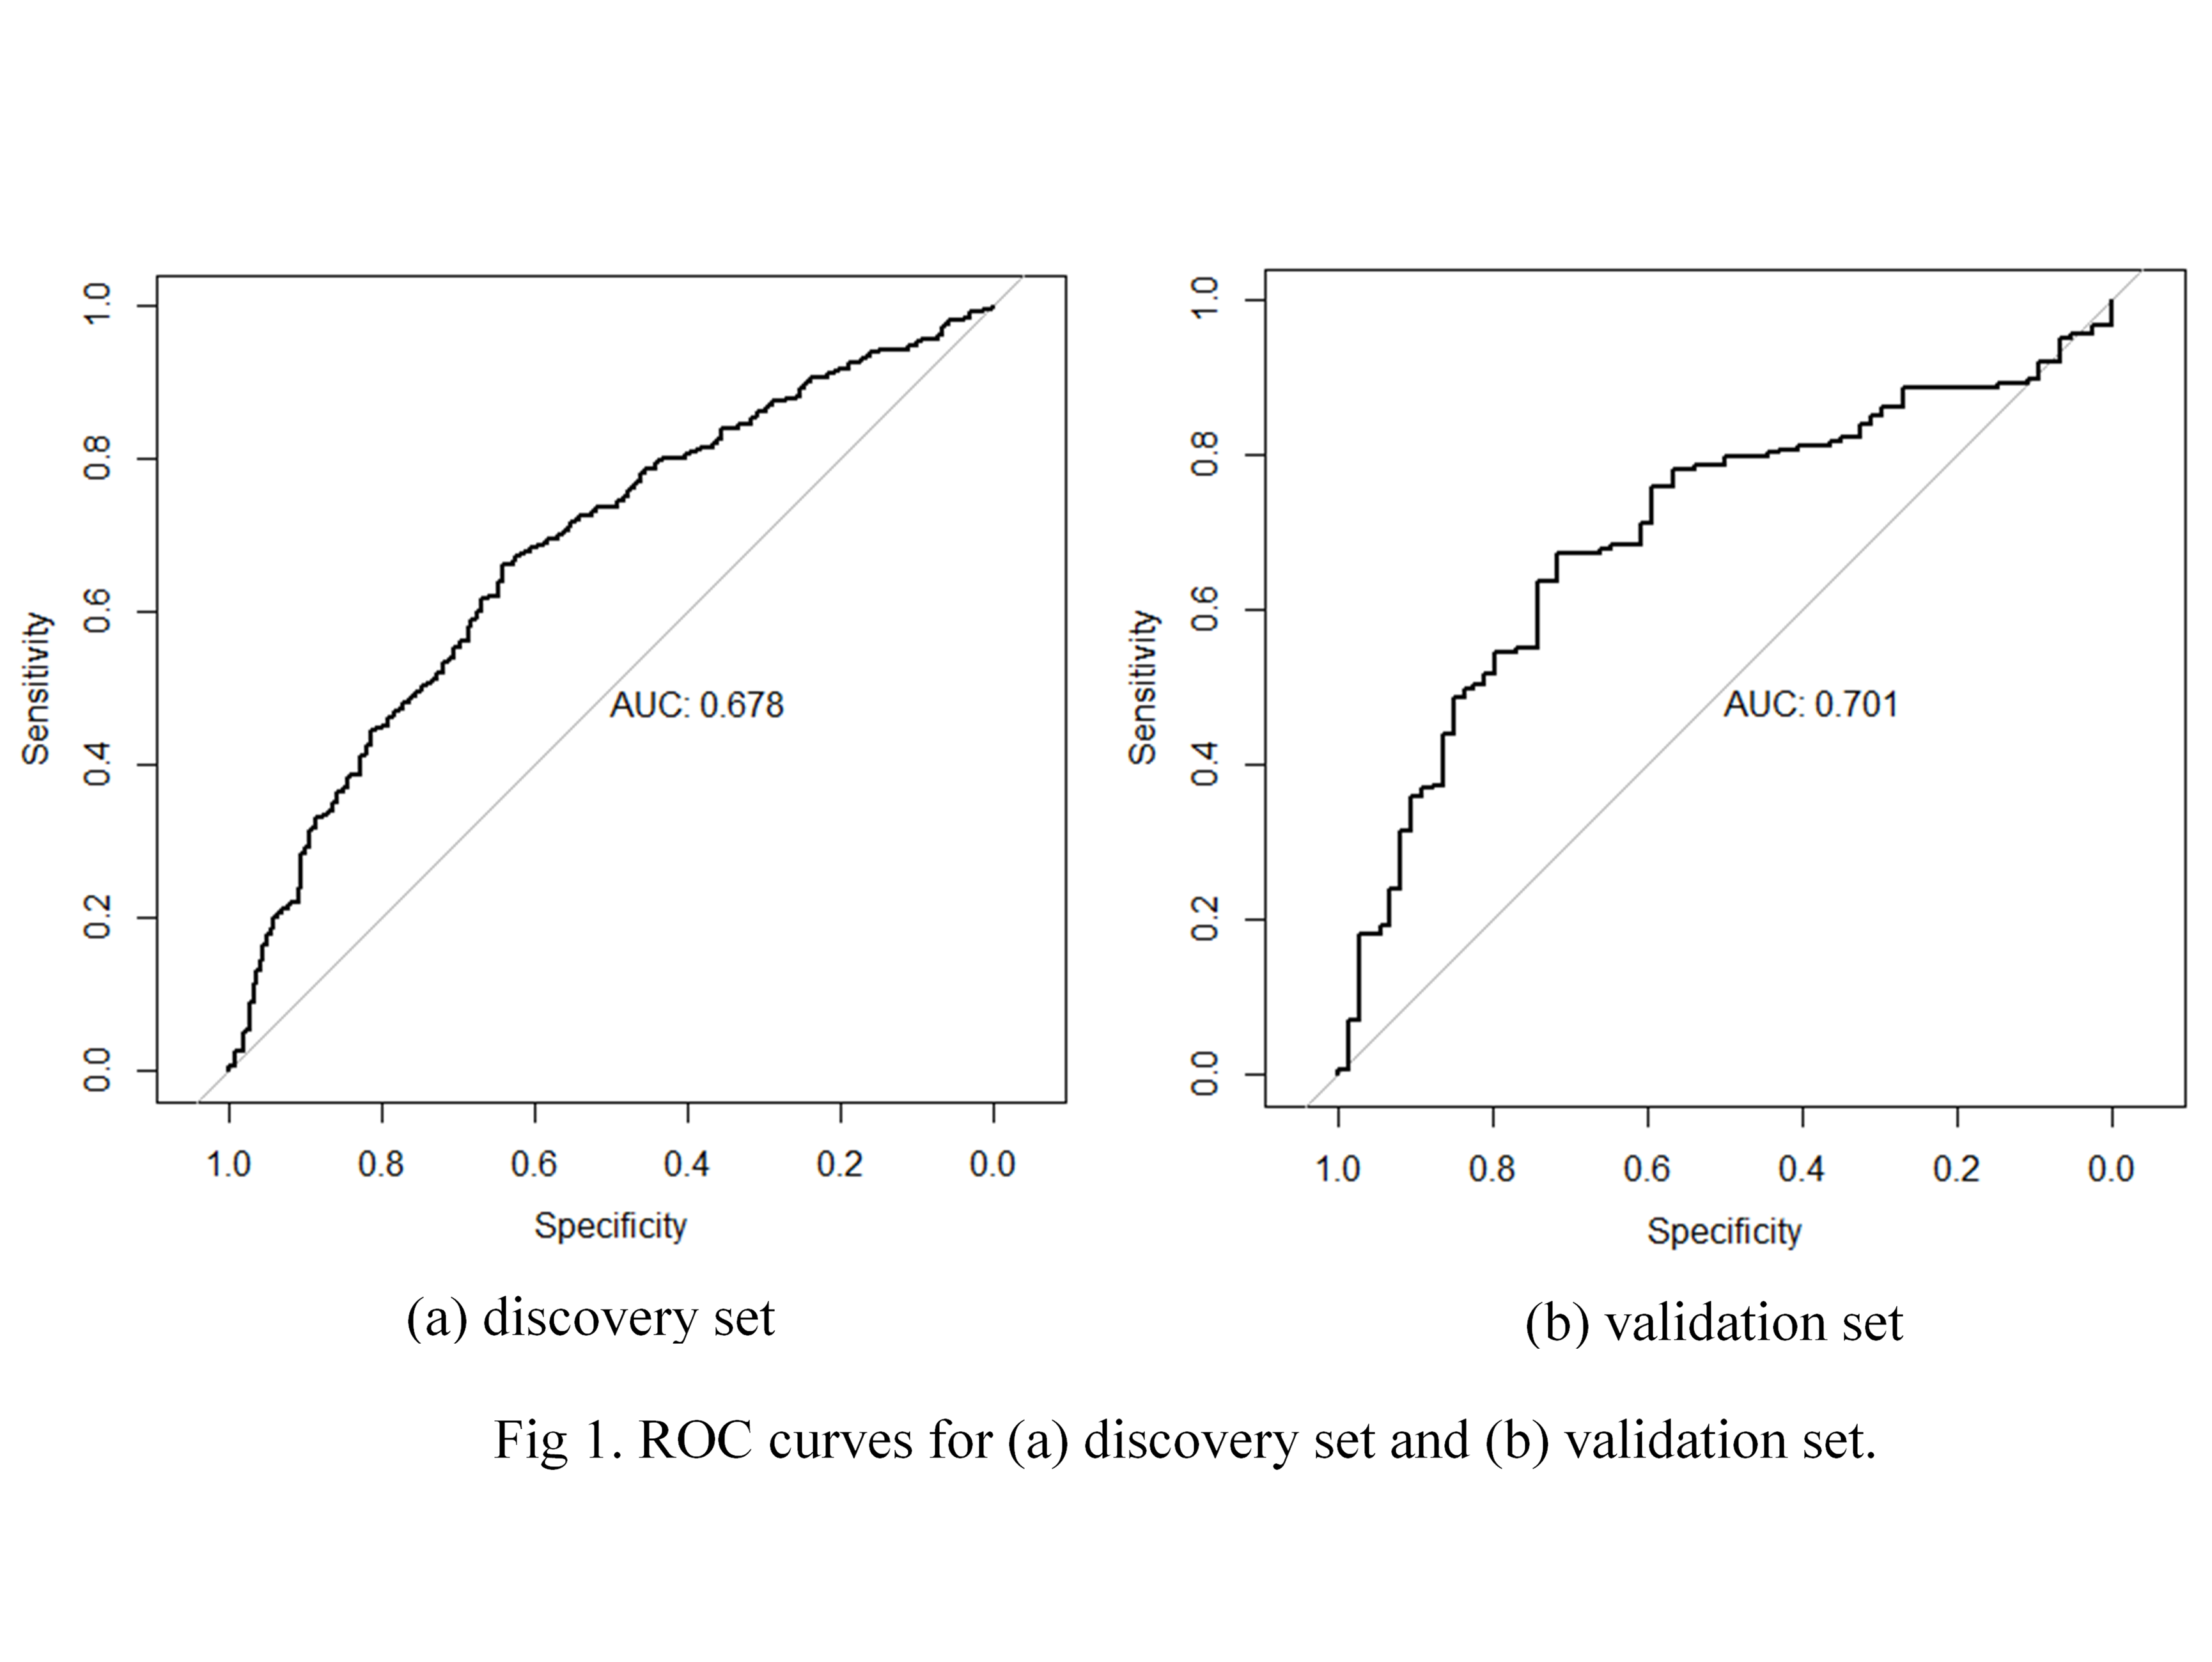
Radiomic features, including 14 first-order statistical features and 56 texture features, were calculated for each lesion [1][2]. Redundant features were eliminated according to the feature correlation matrix. Features with a between-group discrimination significance of P < 0.05 using Wilcoxon rank-sum test were selected and input to the classifier, least absolute shrinkage and selection operator (LASSO), to build a radiomic signature for the discrimination of AQP4 and MOG. LASSO was trained using 10-fold cross-validation on the discovery set. Then, the most useful predictive features and their weights were determined, and radiomics score (Rad-score) was calculated for each lesion. The discrimination ability of the radiomics signature was tested on the validation dataset and assessed by receiver operating characteristic (ROC) curve analysis and quantified by the area under the ROC curve (AUC). The point on the discovery ROC curve that was closest to the upper left corner was selected as the cutoff, and the corresponding accuracy, sensitivity, and specificity values were calculated for both discovery and validation set.
RESULTS
19 features were identified with significant difference by WLCX, and the radiomics signature was finally built as Rad_score = 0.93861779 + 0.06885856*VAR + 0.08354644*SKE +0.17588992*LGZE, where VAR denotes Variance, SKE denotes Skewness and LGZE denotes Low Gray-Level Zone Emphasis. The radiomics signature distinguish the two groups with sensitivity of 0.66 and 0.65, and specificity of 0.64 and 0.72 for the discovery and validation dataset respectively. The ROI curves were shown in Figure 1, and the AUC values were 0.678 and 0.701.DISCUSSION
Using radiomics and machine learning methods, we were able to discover new brain lesion imaging features that could not be visually detected. The combination of features with significant discrimination abilities could aid to classify MOG-ab-positive and AQP4-ab-positive patients.CONCLUSION
These results provide valuable information for understanding of pathogenesis and imaging-based initial diagnosis in the two subsets of patients.Acknowledgements
This work was supported by the Scientific Research project of Huashan Hospital, Fudan University (2016QD085) and Science and Technology Commission of Shanghai Municipality (16410722800) (17411953700).References
[1] Xia W, Chen Y, Zhang R et al (2018) Radiogenomics of hepatocellular carcinoma: multiregion analysis-based identification of prognostic imaging biomarkers by integrating gene data-a preliminary study. Physics in Medicine and Biology 63
[2] Vallieres M, Freeman CR, Skamene SR, El Naqa I (2015) A radiomics model from joint FDG-PET and MRI texture features for the prediction of lung metastases in soft-tissue sarcomas of the extremities. Physics in Medicine and Biology 60:5471-5496
Figures