2830
Age prediction from time-of-flight MR angiography using deep learning: Comparison of the predicted age among normal, MCI and AD.1Yonsei University, Seoul, Korea, Republic of, 2Seoul St. Mary’s Hospital, Seoul, Korea, Republic of, 3Seoul National University Hospital, Seoul, Korea, Republic of
Synopsis
Time-of-Flight (TOF) MR angiography (MRA) provides meaningful vascular information related to aging. Recently, we have developed a deep learning based chronological age prediction model from 3D TOF data and demonstrated its accuracy in predicting the age of normal volunteers. In this study, to investigate its clinical utilities, we applied the deep learning model to subjects with mild cognitive impairment and Alzheimer’s disease.
Purpose
The vasculatures of the brain are closely associated with age-related changes.1 In previous MRA studies, the changes of age-related imaging features such as tortuosity or irregularity in the brain vasculature have been demonstrated.2-4 There are many imaging features related to aging for MRA, but it is not easy to automatically represent them in a quantitative way. Recently, we have developed a deep learning based chronological age prediction model from 3D time-of-flight (TOF) data and demonstrated its accuracy in predicting the age of normal volunteers.5 In this study, to investigate its clinical utilities, we applied the deep learning model to subjects with mild cognitive impairment (MCI) and Alzheimer’s disease (AD).Methods
1) Dataset
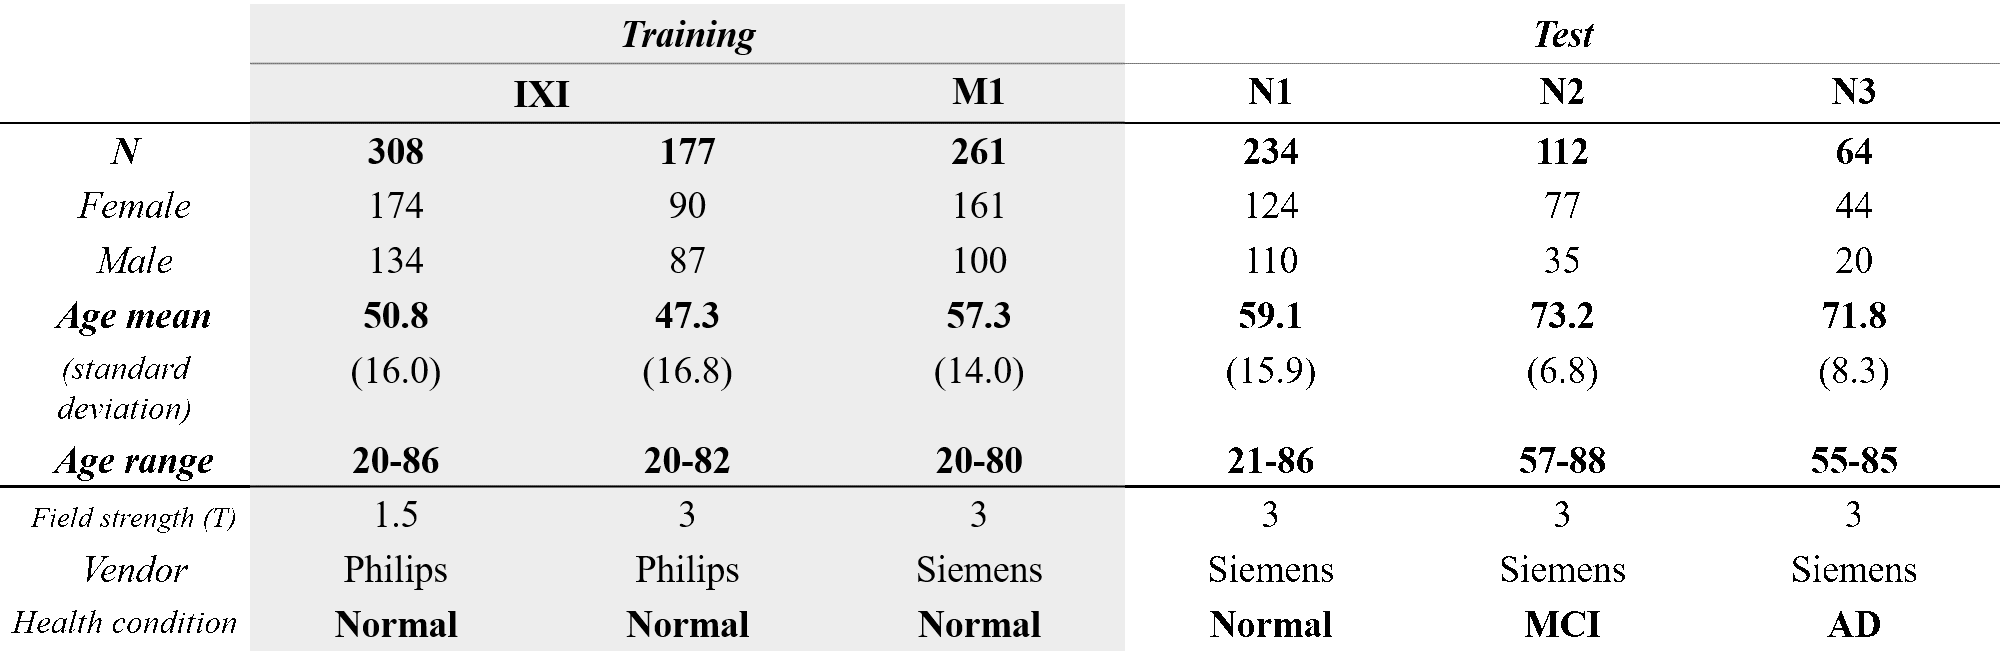
3D time-of-flight (TOF) MRA images of a total 1,156 subjects were collected from the public database (IXI) and our collaborator’s hospital databases (Hospital M: M1, Hospital N: N1, N2, and N3). Details of the databases are summarized in Table 1. Note that the images in the test set were acquired from different scanners with different scan protocols than the images in the training set as indicated in Table 1.
2) Pre-processing
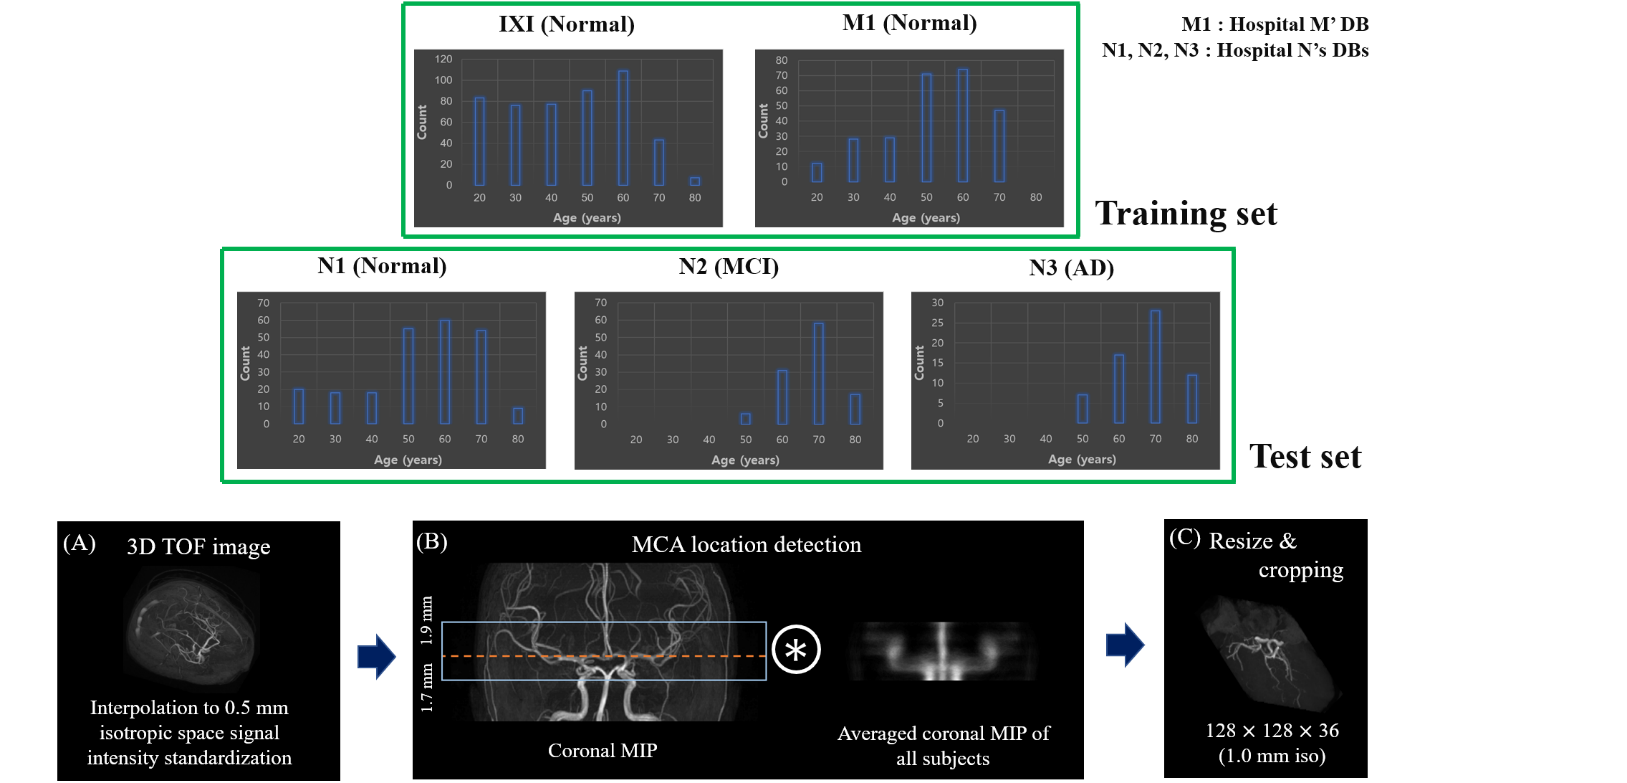
Due to the different imaging protocols and scan environments (discrepancies in FOV, number of imaging slabs, scan parameters, and protocols), pre-processing introduced in the previous study5 is essential to align the images in the database. The following pre-processing was performed (Fig. 1):
Step 1. 3D TOF images were interpolated to 0.5 mm isotropic space and signal intensities were standardized (mean of zero and standard deviation of 1).
Step 2. A slab of 3.6 cm thickness (from 1.7 mm below to 1.9 mm above the MCA point) was extracted.
Step 3. Resizing to 1.0 mm isotropic space and cropping of the outer regions were performed to reduce input data size and to minimize the effects of non-vascular structures such as high signals from skull or eye regions.
3) Training 3D TOF CNN
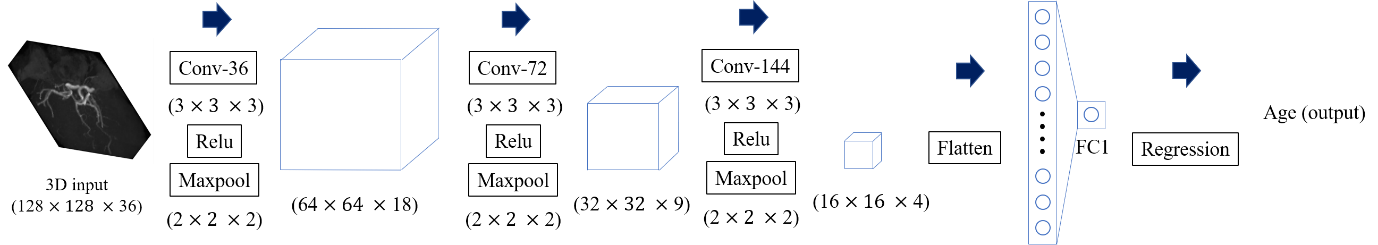
During training of the network, augmentation of the images (shifting, rotating about the x- and y-axes, flipping) was performed for every batch input data to avoid overfitting. Except for the number of channels, the architecture of the network is similar to the previous study and the network used in this study is summarized in Figure 2. The convolution layers have 36, 72, 144 filters, respectively, and 3x3x3 convolution kernels were utilized. The learning rate started at 0.001 divided by 1/2 every 2000 epochs and training was performed for 9,000 epochs, which took 90 hours.
4) Evaluation
This trained model was evaluated by external validation sets from three different databases: N1 for normal, N2 for MCI, and N3 for AD. For test DBs, correlation coefficients and mean absolute errors (MAEs) between the predicted age and the actual age were calculated. The predicted age was subtracted from the actual age, calculating a predicted age difference (PAD) score for all subjects. The t-test was performed for comparison of the PAD distributions between two different databases (N1 and N2, N2 and N3, N1 and N3). A p-value of 0.01 or smaller was considered statistically significant.
Results
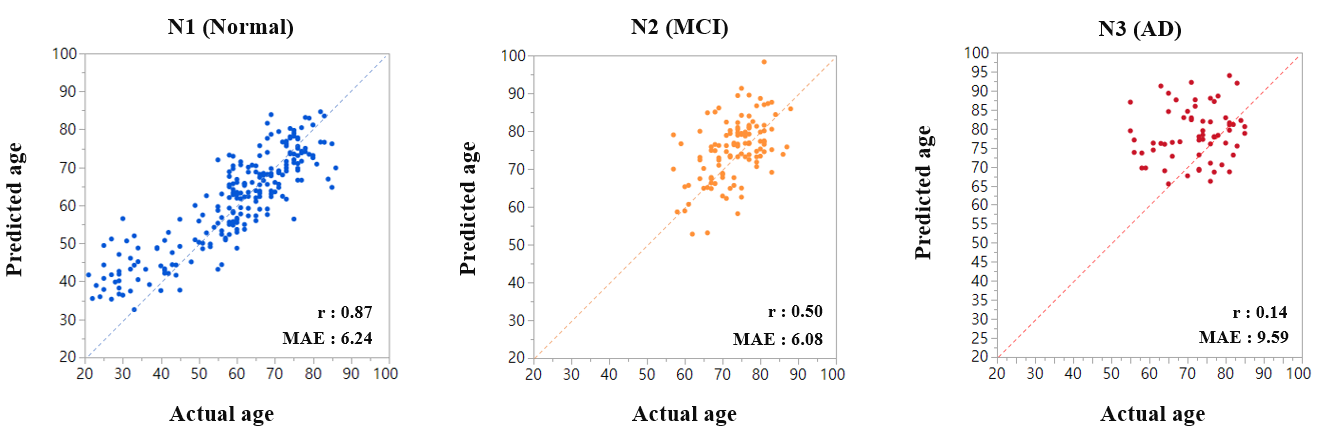
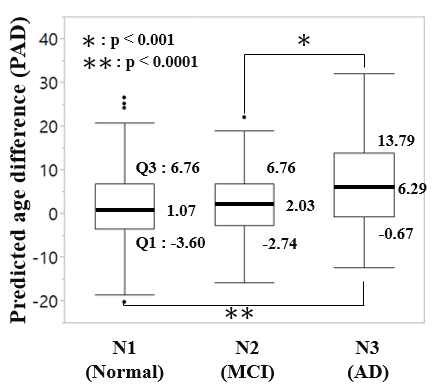
As shown in Figure 3, the correlation coefficients were 0.87 for normal, 0.50 for MCI, 0.14 for AD, respectively. MAE were 6.24 for normal, 6.08 for MCI, and 9.59 for AD, respectively. For normal subjects, the PAD was 1.07 ± 5.18 years (PAD: predicted age difference). When the network was tested with MCI and AD databases, the PAD increased to 2.03 ± 4.75 for MCI and 6.29 ± 7.23 for AD. These results demonstrated significantly increased age prediction for AD (p<0.001 for normal, p<0.0001 for MCI) as shown in Figure 4.
Discussion
In this study, we have demonstrated that the potential clinical utility of the brain vascular age prediction model constructed by deep learning. As the severity of degeneration gets higher, higher PAD score was obtained, indicating that high PAD score might indicate the degree of severity of the AD. In this study, the difficult part of constructing the network that works for multiple hospital data was to match spatial coverage of 3D TOF data. Because of the different z-coverages for each DB, unfortunately, we could only utilize z-directional coverage of 36 mm. For further optimization, the effects of the z-coverage used for the network and the key locations based on the judgement will be investigated.Acknowledgements
This research was supported by the Brain Research Program through the National Research Foundation of Korea(NRF) funded by the Ministry of Science, ICT & Future Planning (2018M3C7A1056884)References
1. Mrak RE, Griffin ST, Graham DI. Aging-associated changes in human brain. J Neuropathol Exp Neurol. 1997;56(12):1269-75.
2. Bullitt E, Zeng D, Mortamet B, Ghosh A, Aylward SR, Lin W, et al. The effects of healthy aging on intracerebral blood vessels visualized by magnetic resonance angiography. Neurobiology of aging. 2010;31(2):290-300.
3. Kusunoki K, Oka Y, Saito M, Sadamoto K, Sakaki S, Miki H, et al. Changes in visibility of intracranial arteries on MRA with normal ageing. Neuroradiology. 1999;41(11):813-9.\
4. Han J, Qiao H, Li X, Li X, He Q, Wang Y, et al. The three-dimensional shape analysis of the M1 segment of the middle cerebral artery using MRA at 3T. Neuroradiology. 2014;56(11):995-1005.
5. Yoonho Nam, et al. Development of deep learning based age prediction model from time-of-flight MR angiography. RSNA 103rd Scientific Assembly and Annual Meeting.
Figures