2828
Machine Learning Approach Assisted MRI Characterization for Diagnosis of Neonatal Bilirubin Encephalopathy1Graduate School, Medical College of Nanchang University, Nanchang, China, 2Radiology and Imaging Sciences, Emory University School of Medicine, Atlanta, GA, United States, 3Radiation Oncology, Winship Cancer Institute, Emory University, Atlanta, GA, United States, 4Radiology, People's Hospital of Longhua, Shenzhen, China
Synopsis
Diagnosis of acute bilirubin encephalopathy (ABE) in newborns based on T1-weighted spin echo images in clinical routine is challenging due to subtle signal intensity change in the basal ganglia caused by ABE often overlapping with the presence of signal enhancement from the normal myelination in the
Introduction
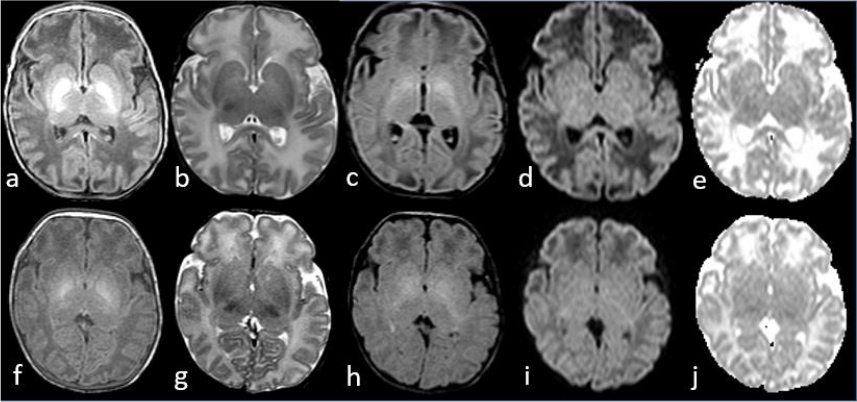
Acute bilirubin encephalopathy (ABE) in newborns can progress to chronic bilirubin encephalopathy (CBE), a permanent devastating neurological sequela induced by bilirubin toxicity. Early recognition is the key to apply effective treatment to keep it from exacerbating to CBE [1]. Comparing to current standard clinical measurements of serum bilirubin level and neurological symptoms, MRI, as a non-radiation technique, can directly provide non-invasive detection of abnormality in affected globus pallidus which is typically seen as hyperintense signal on T1-weighted spin echo images. However, normal myelination can lead to relatively high signal intensity in the same regions in newborns at the same age [2] (Figure 1). In this study, we used a machine learning approach to extract and identify the specific radiomics features from T1-weighted MR images of newborns to assist diagnosis of ABE.Methods and Materials
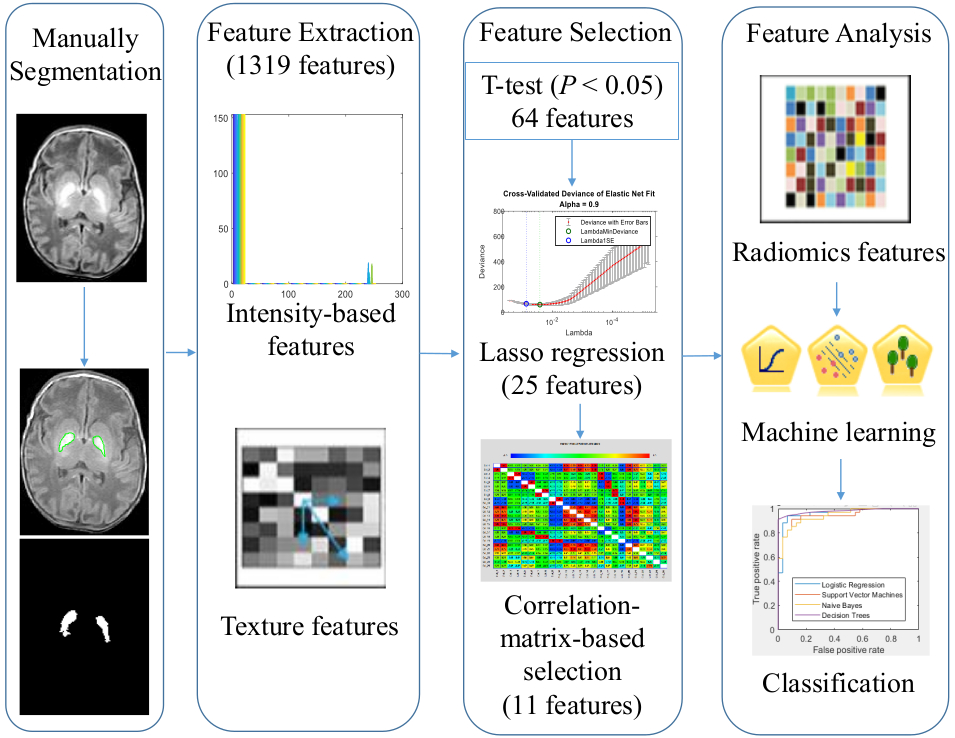
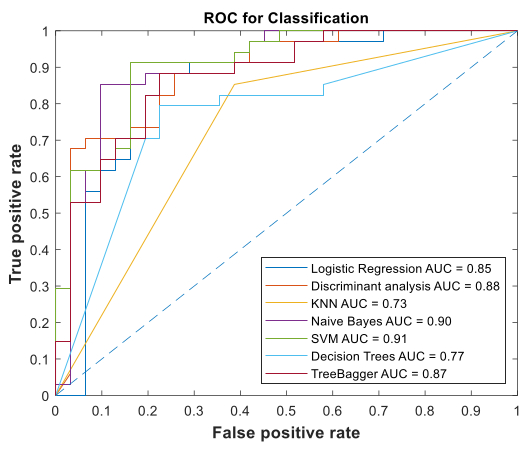
65 neonates with 31 normal neonates (male: female = 20: 11, 11.6 ± 6.4 days) and 34 neonates (male: female = 17: 17, 6.7 ± 3.4 days) with clinically confirmed ABE via serum bilirubin level, clinical manifestations, and positive imaging findings were enrolled in the study. All MR images were acquired from 1.5 T whole-body MRI scanner with a neonatal MRI protocol including T1, T2 and diffusion weighted imaging sequences. Using open source IBEX software, the regions of interest (ROI) covering globus pallidus were manually segmented by experienced radiologists based on the anatomical location, axial morphology on MRI with the reference of typical ABE cases. A total of 1319 features within 9 categories from the segmented globus pallidus were extracted from all cases using IBEX software [3]. To select informative features, a two-sample T-test was used with P < 0.05 as statistically significant difference, followed by the LASSO (least absolute shrinkage and selection operator) regression method. Then, a correlation-matrix map was generated based on the correlation between each selected feature pair. Those linearly-correlated features (r = 1) were first put into the same group and then only 1 representative feature in each group was selected as attributive feature. Finally, a prediction model based on multiple classification algorithms including logistic regression, discriminant analysis, KNN (k-nearest neighborhood), Naïve Bayes, SVM (support vector machine), decision trees and ensemble tree-bagger and the selected highly discriminant features was built using Matlab (2018b, Mathworks, US). A leave-one-out cross-validation scheme was used to split the data into training data and testing data randomly. Accuracy was obtained for each classifier with the value of area under curve (AUC) calculated based on receiver operating characteristics (ROC). The features were ranked based on their Fisher scores. The pipeline of the process is summarized in Figure 2.Results and Discussion
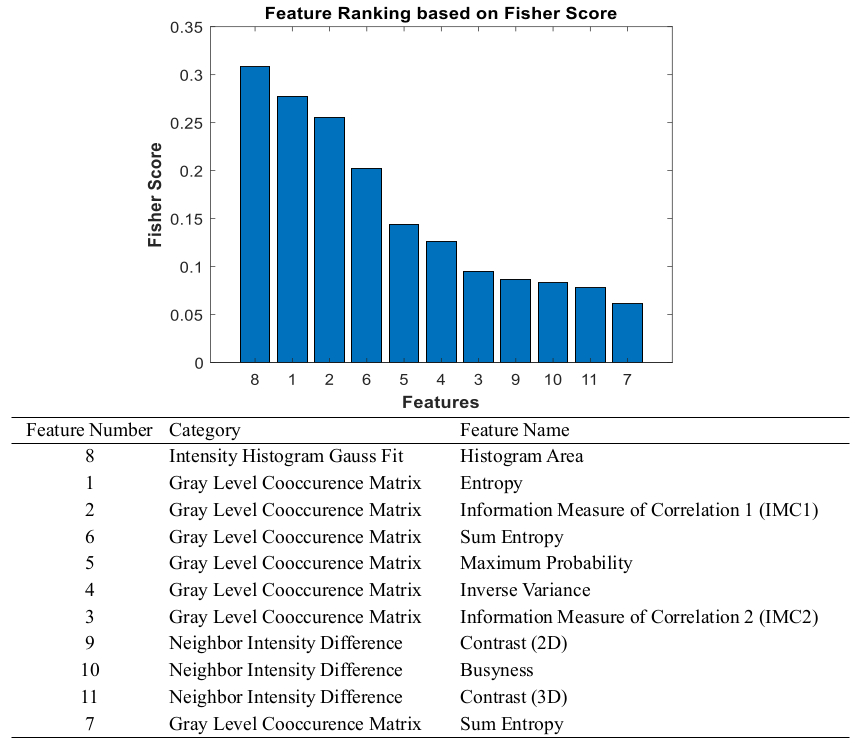
Signal intensity increases in the region of globus pallidus in various magnitude on T1-weighted images were found among all of the subjects with and without ABE. Figure 1 shows examples of T1-weighted spin echo images of subjects with and without ABE. From a total of 1319 features, 11 attributive features were selected for final classification, including 7 texture features and 4 intensity-based features. Of 4 intensity-based contributing features, 1 feature reflects the intensity magnitude of lesions, while 3 other features describe the intensity change between lesions and surrounding tissues. The detailed information for features selected in each step is summarized in Figure 2. Finally, The SVM had the best performance in classifying ABE and normal neonates based on these 11 features with AUC of 0.907 and accuracy of 87.7% in the ROC analysis (Figure 3). The selected features were ranked according to their importance in predicting ABE, as shown in Figure 4. The intensity-based features appear to follow the common reading strategy of radiologists, which focuses on identifying high signal and sharp contrast from the abnormalities. With machine learning assistance, 7 texture-based features also contributed to distinguishing ABE from normal myelination. These new texture features provide additional diagnostic power by identifying subtle morphological heterogeneity induced by accumulation of unconjugated bilirubin in patients with ABE, thus better distinguishing ABE from normal myelination.Conclusion
The current study demonstrated the feasibility of a radiomics-based machine learning approach in the diagnosis of neonatal ABE with improved differentiation of hyperintense T1-weighted image patterns of globus pallidus in ABE from the similar ones seen in normal myelination. These extracted radiomics features, especially texture-based ones, revealed new ABE-induced morphological heterogeneity, which cannot be seen by conventional clinical reading, and thus assist clinicians to make decisions.Acknowledgements
The authors gratefully acknowledge the financial support by the China Scholarship Council (CSC) to Zhou Liu for taking a joint Ph.D. program at Emory University School of Medicine, United States of America, where he has been working on this project.References
1. Bhutani, V.K., R.J. Wong, and D.K. Stevenson, Hyperbilirubinemia in Preterm Neonates. Clin Perinatol, 2016. 43(2): p. 215-32.
2. Barkovich, A.J., MR of the normal neonatal brain: assessment of deep structures. AJNR Am J Neuroradiol, 1998. 19(8): p. 1397-403.
3. Zhang, L., et al., IBEX: an open infrastructure software platform to facilitate collaborative work in radiomics. Med Phys, 2015. 42(3): p. 1341-53.
4. Sari, S., et al., Brain magnetic resonance imaging and magnetic resonance spectroscopy findings of children with kernicterus. Pol J Radiol, 2015. 80: p. 72-80.
Figures