2825
Automatic Dentate Nuclei Segmentation based on Quantitative Susceptibility Maps using a Convolutional Neural Network: Application to Healthy Controls and Cerebellar Ataxia Patients1Medical Physics Group, Institute for Diagnostic and Interventional Radiology, Jena University Hospital, Jena, Germany, 2Department of Neurology, Essen University Hospital, University of Duisburg-Essen, Essen, Germany, 3Department of Diagnostic and Interventional Radiology and Neuroradiology, Essen University Hospital, University of Duisburg-Essen, Essen, Germany, 4Michael-Stifel-Center-Jena for Data-Driven and Simulation Science, Friedrich-Schiller University Jena, Jena, Germany, 5Erwin L. Hahn Institute for Magnetic Resonance Imaging, University of Duisburg-Essen, Essen, Germany
Synopsis
Non-invasive visualization and segmentation of the dentate nucleus is helpful for characterizing neurological diseases. Therefore, we set up an automatic segmentation strategy relying on a convolutional neural network (CNN) for the delineation of the dentate nucleus based on quantitative susceptibility maps. We trained the network on 101 healthy controls and 118 patients suffering from various types of cerebellar ataxia. We were able to demonstrate that the CNN accurately segments the dentate nuclei in 26 healthy controls and 21 SCA6 patients with volume estimates being in agreement with literature.
Introduction
The dentate nucleus is a highly convoluted structure on the order of 400 mm³ (per hemisphere),1 and its detailed assessment is important for characterization of neurological diseases.2 It has already been demonstrated using susceptibility sensitive MRI (susceptibility weighted imaging [SWI]3 and quantitative susceptibility mapping [QSM]4, 5) and manual delineation that the dentate nuclei in spinocerebellar ataxia (SCA) type 6 (SCA6) patients atrophy.6, 7 Interestingly, two different studies6, 7 revealed contradictory results for the dentate volume change in SCA3 patients with respect to healthy controls likely due to different delineation strategies. A way to circumvent such a bias is the use of automatic segmentation approaches. One approach relying on a single atlas that segments the dentate nucleus as bean-like structure.8 Another technique employing multiple atlases was able to segment the ribbon of the dentate in 10 similar-aged healthy controls.9 While most segmentation tools sufficiently work for healthy controls, their application to patient data often yields uncertain segmentations as the dentate nuclei can atrophy severely. Therefore, we set up an alternative automatic strategy relying on a convolutional neural network (CNN) for the segmentation of the dentate nucleus based on quantitative susceptibility maps and investigate its performance in both healthy and diseased subjects suffering from cerebellar ataxia.Materials & methods
Data Acquisition: 139 patients with cerebellar ataxia of different types (e.g., SCA1, SCA3, Friedreich ataxia), as well as 127 healthy controls, underwent MRI. Multi-echo gradient-echo imaging (TE1-4= 6.47ms/17.23ms/27.99ms/38.75ms, TR=62ms, flip angle [FA]=17°, bandwidth [BW]1-4=120Hz/px, voxel size=0.5mm×0.5mm×0.5mm) and T1-weighted imaging (MP-RAGE, voxel size=1mm×1mm×1mm, TE=3.26ms, TR=2530ms, inversion time=1100ms, FA=7°, BW=200Hz/px) were performed at 3T.
Data Processing: Quantitative susceptibility maps were calculated from the gradient-echo phase images using V-SHARP10, 11 and HEIDI.12 The dentate nuclei were manually traced in both hemispheres on the axial, sagittal and coronal susceptibility maps by at least one rater. For 47 subjects the dentate nuclei were delineated by two independent raters.
Segmentation: As a preprocessing step the cerebellum was identified based on the T1-weighted images using a dedicated CNN.13 The cerebellum mask was then transferred to the susceptibility maps via rigid-body registration and susceptibility values outside the cerebellum were set to 0. The signal intensities of the cerebellum-masked susceptibility maps were normalized across the study population using decile normalization.14 A two-pathway, 3D, 12 layer deep CNN was set up using the DeepMedic framework.15 The CNN was trained using the pre-processed susceptibility maps and the manual delineations of rater 1 of 219 participants (101 controls, 118 patients). The CNN relied on the Dice-Soerensen-Coefficient (DSC) as cost metric and the ADAM algorithm for optimization. The trained CNN was applied to 26 controls and 21 SCA6 patients.
Analysis: The CNN segmentation performance and the inter-rater variability were assessed using the DSC and the relative volume change with respect to the delineations of rater 1.
Results & Discussion
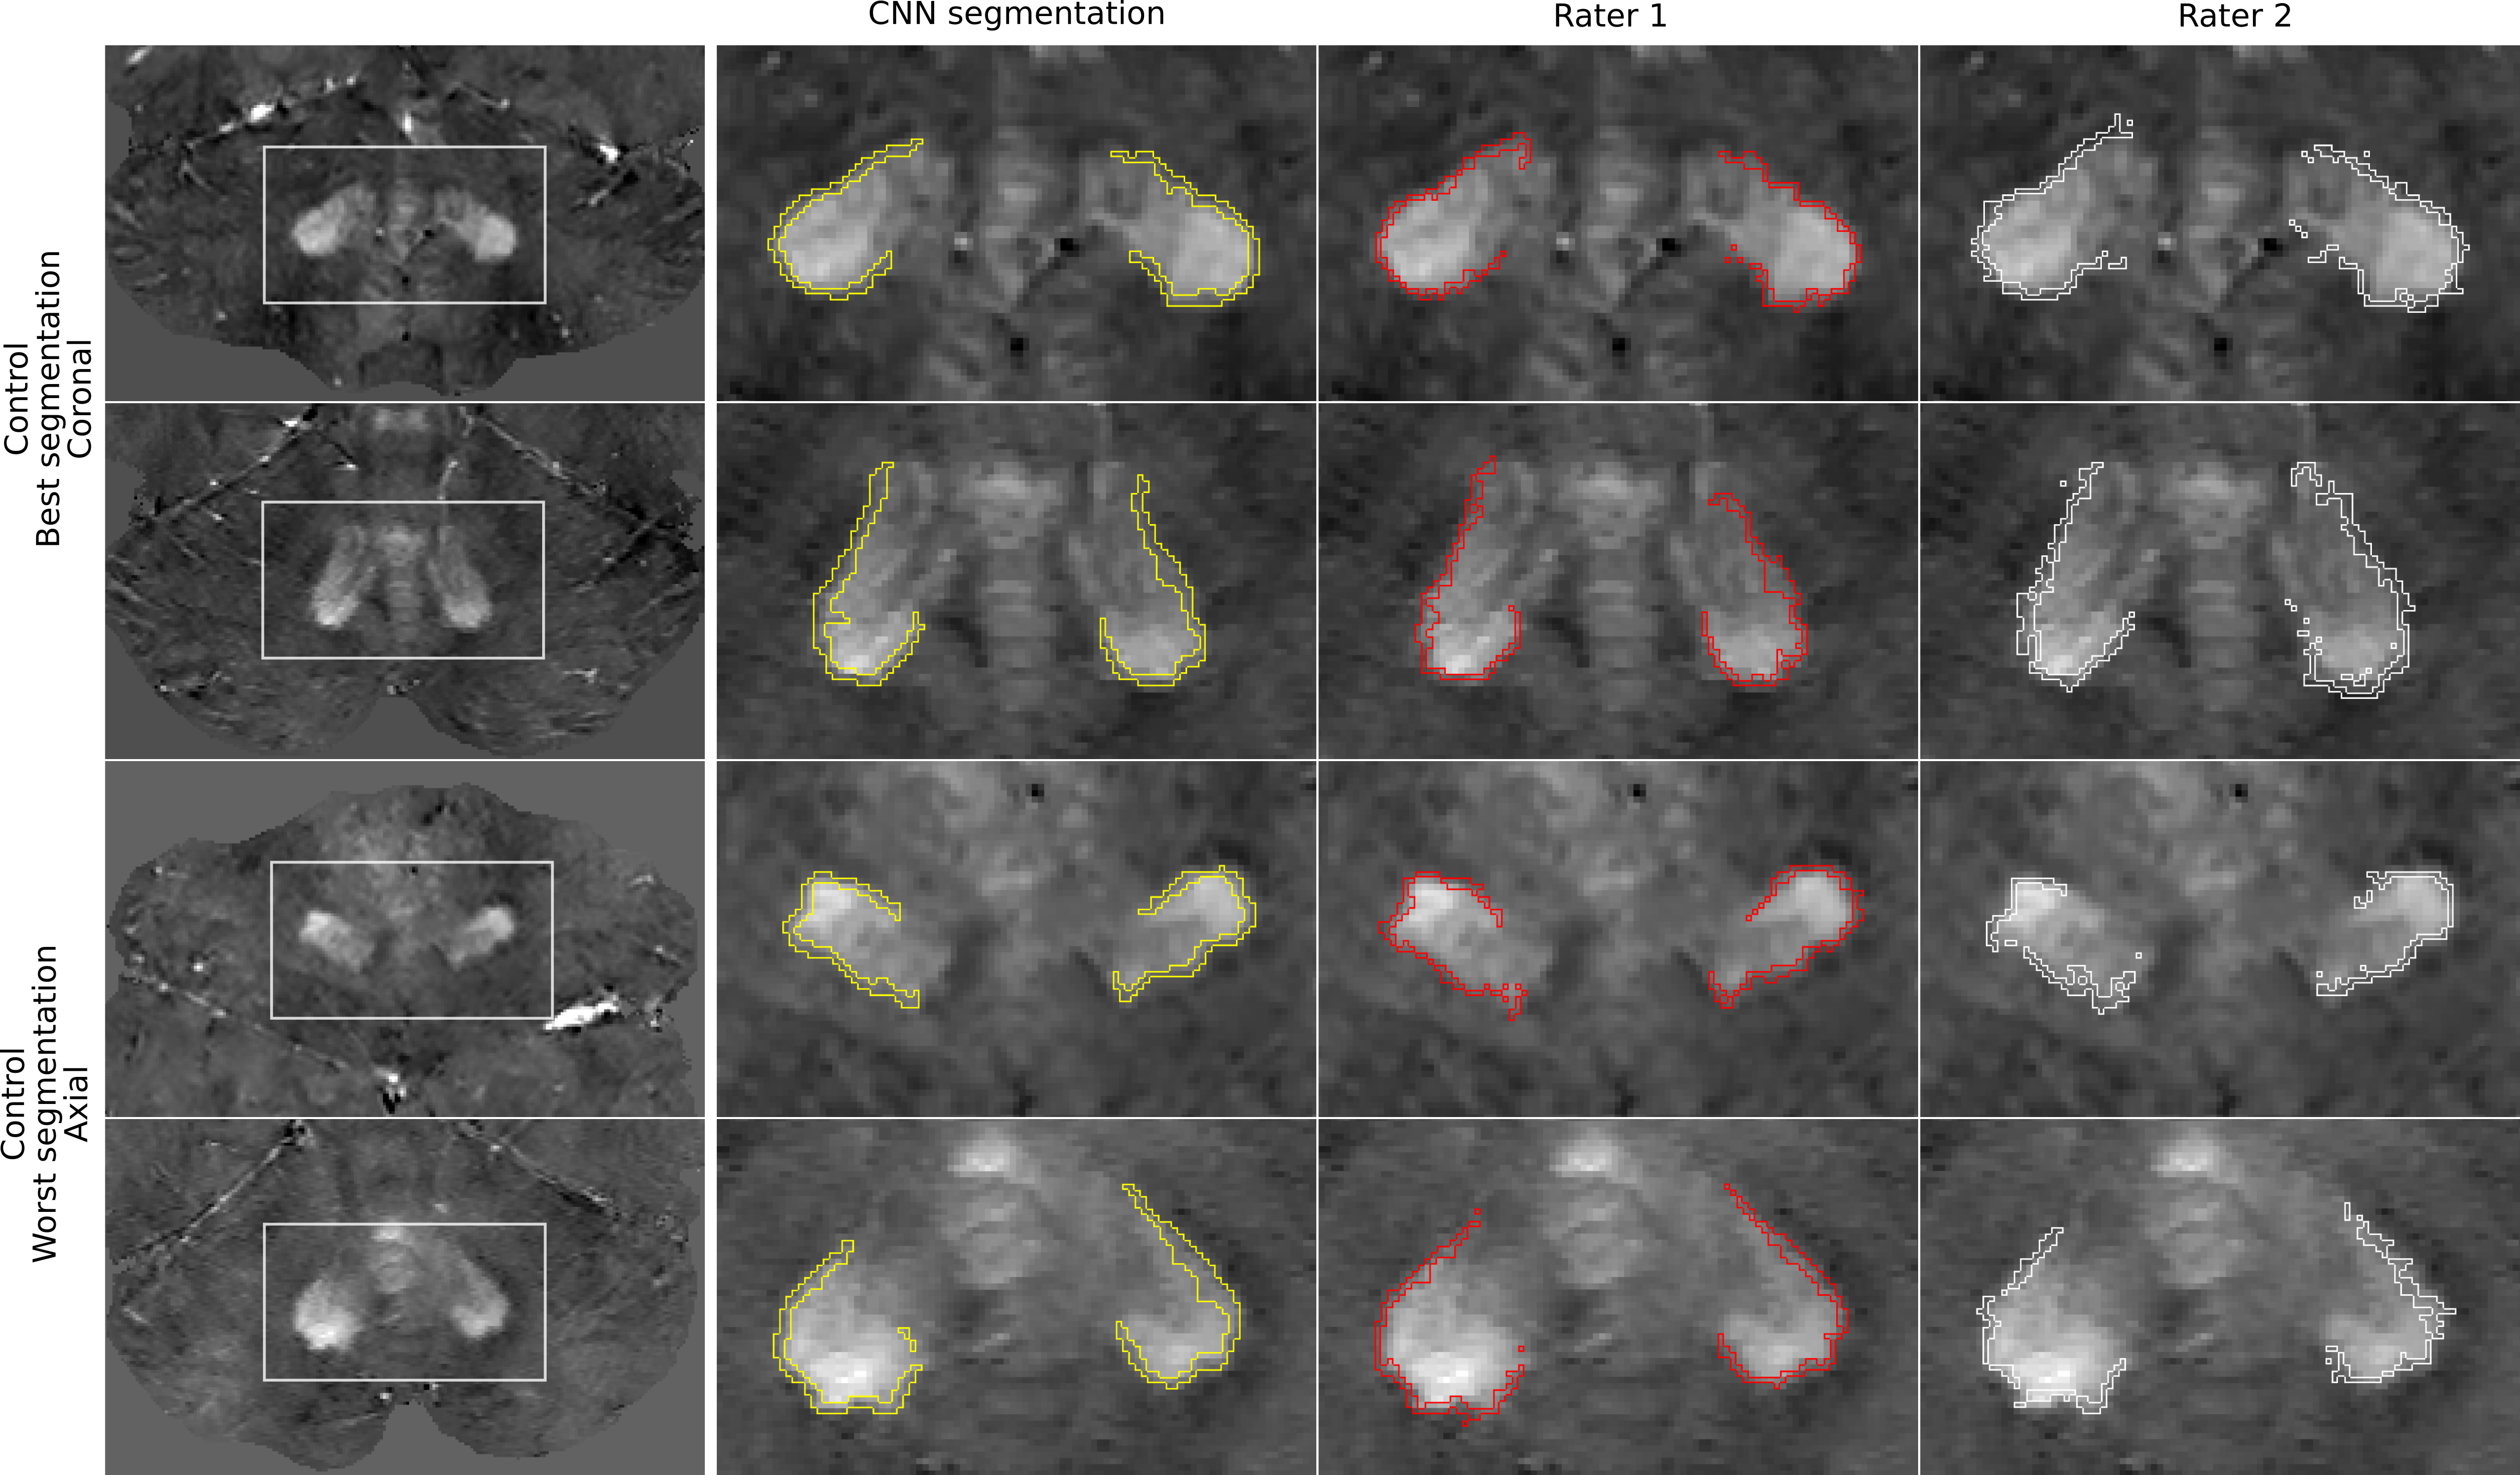
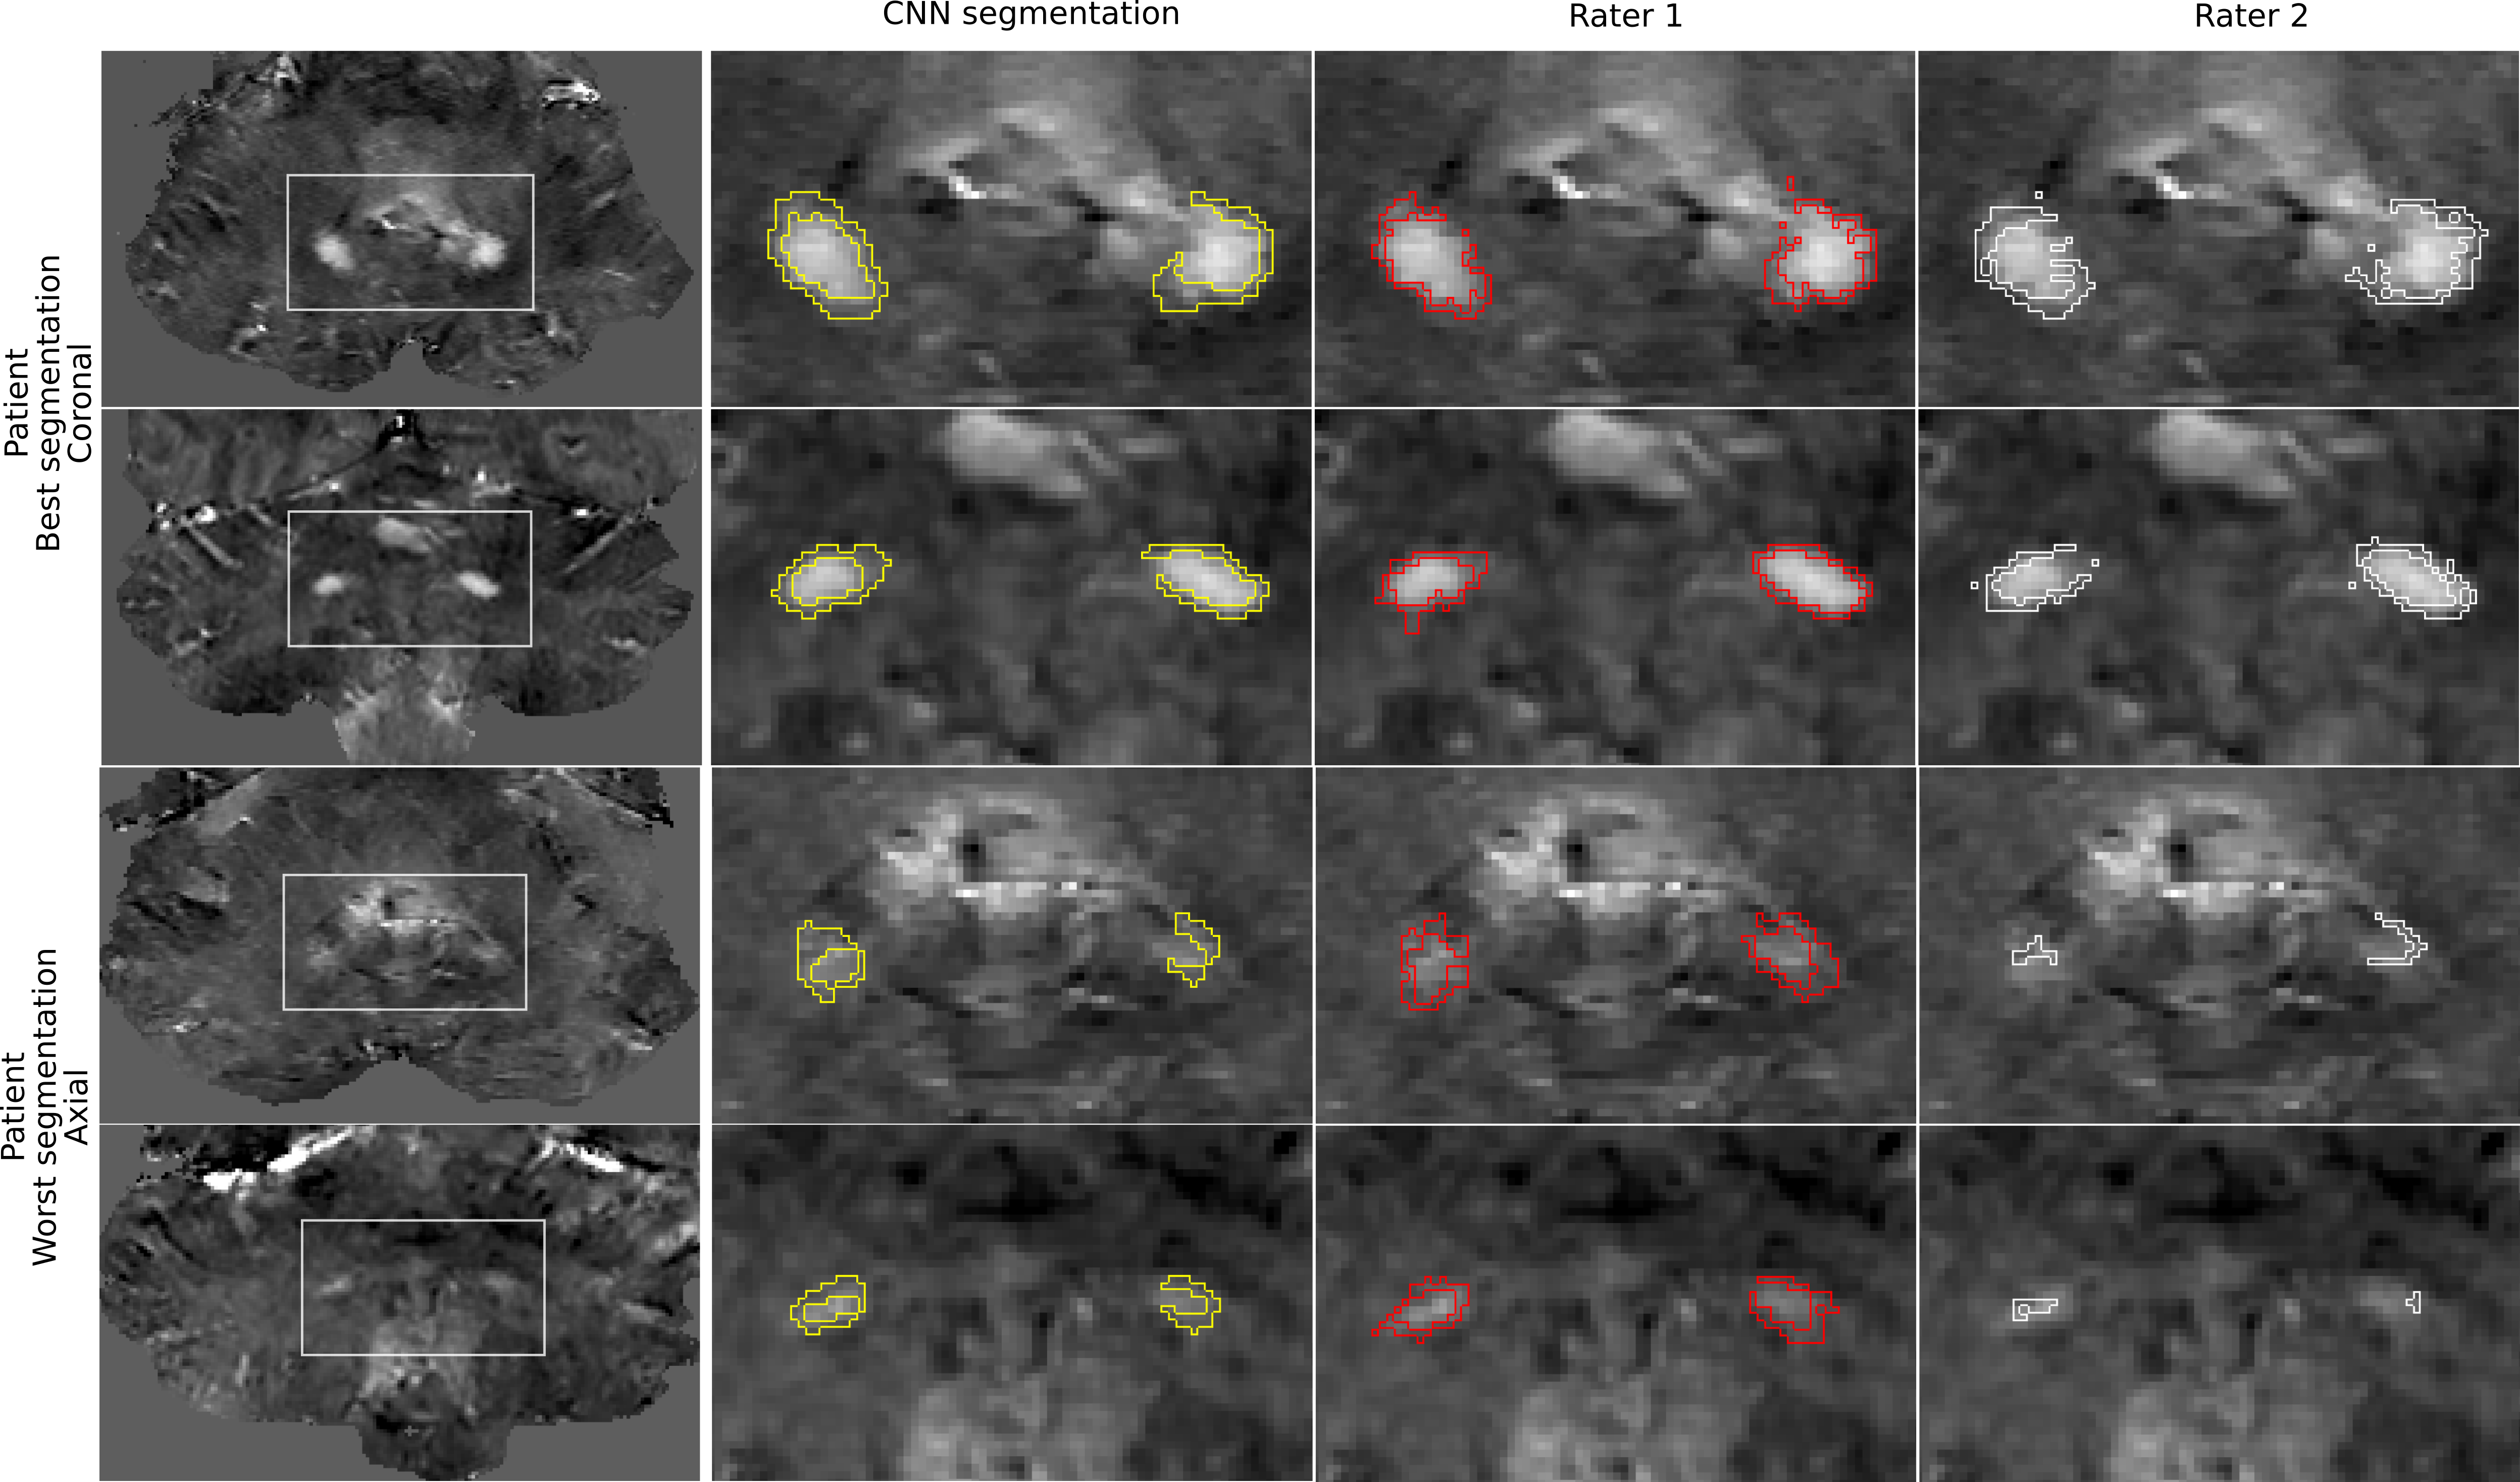
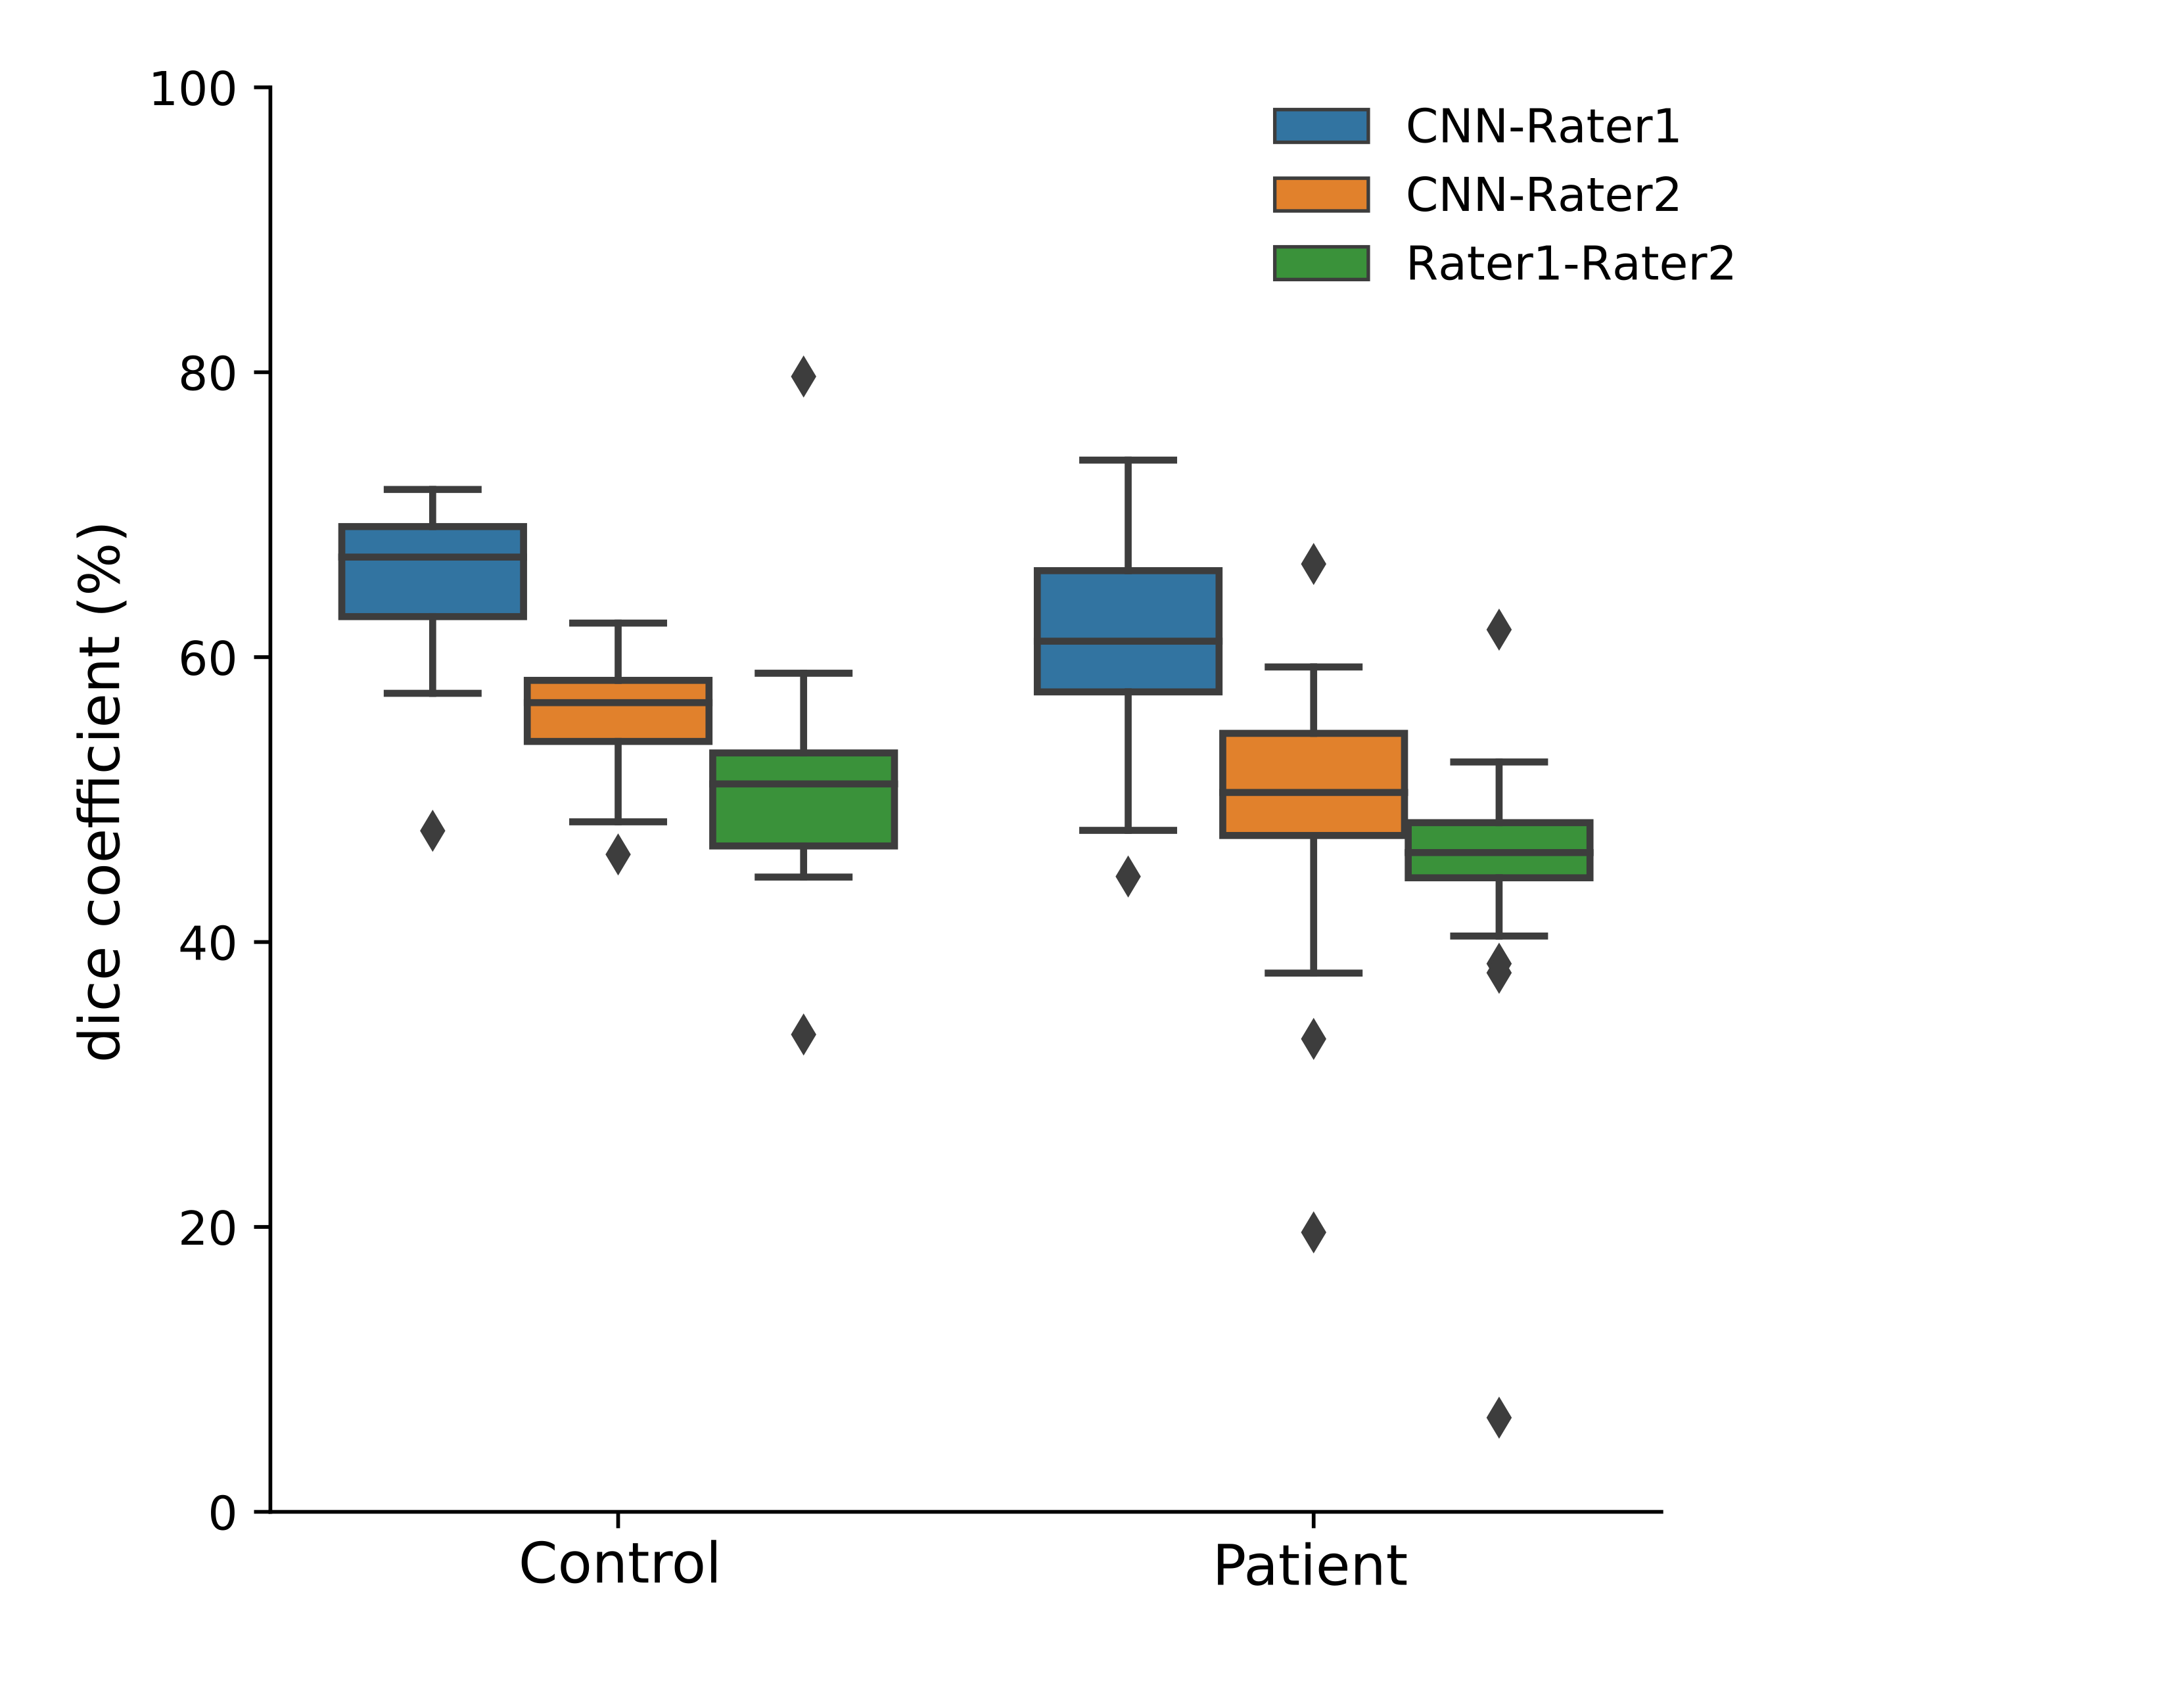
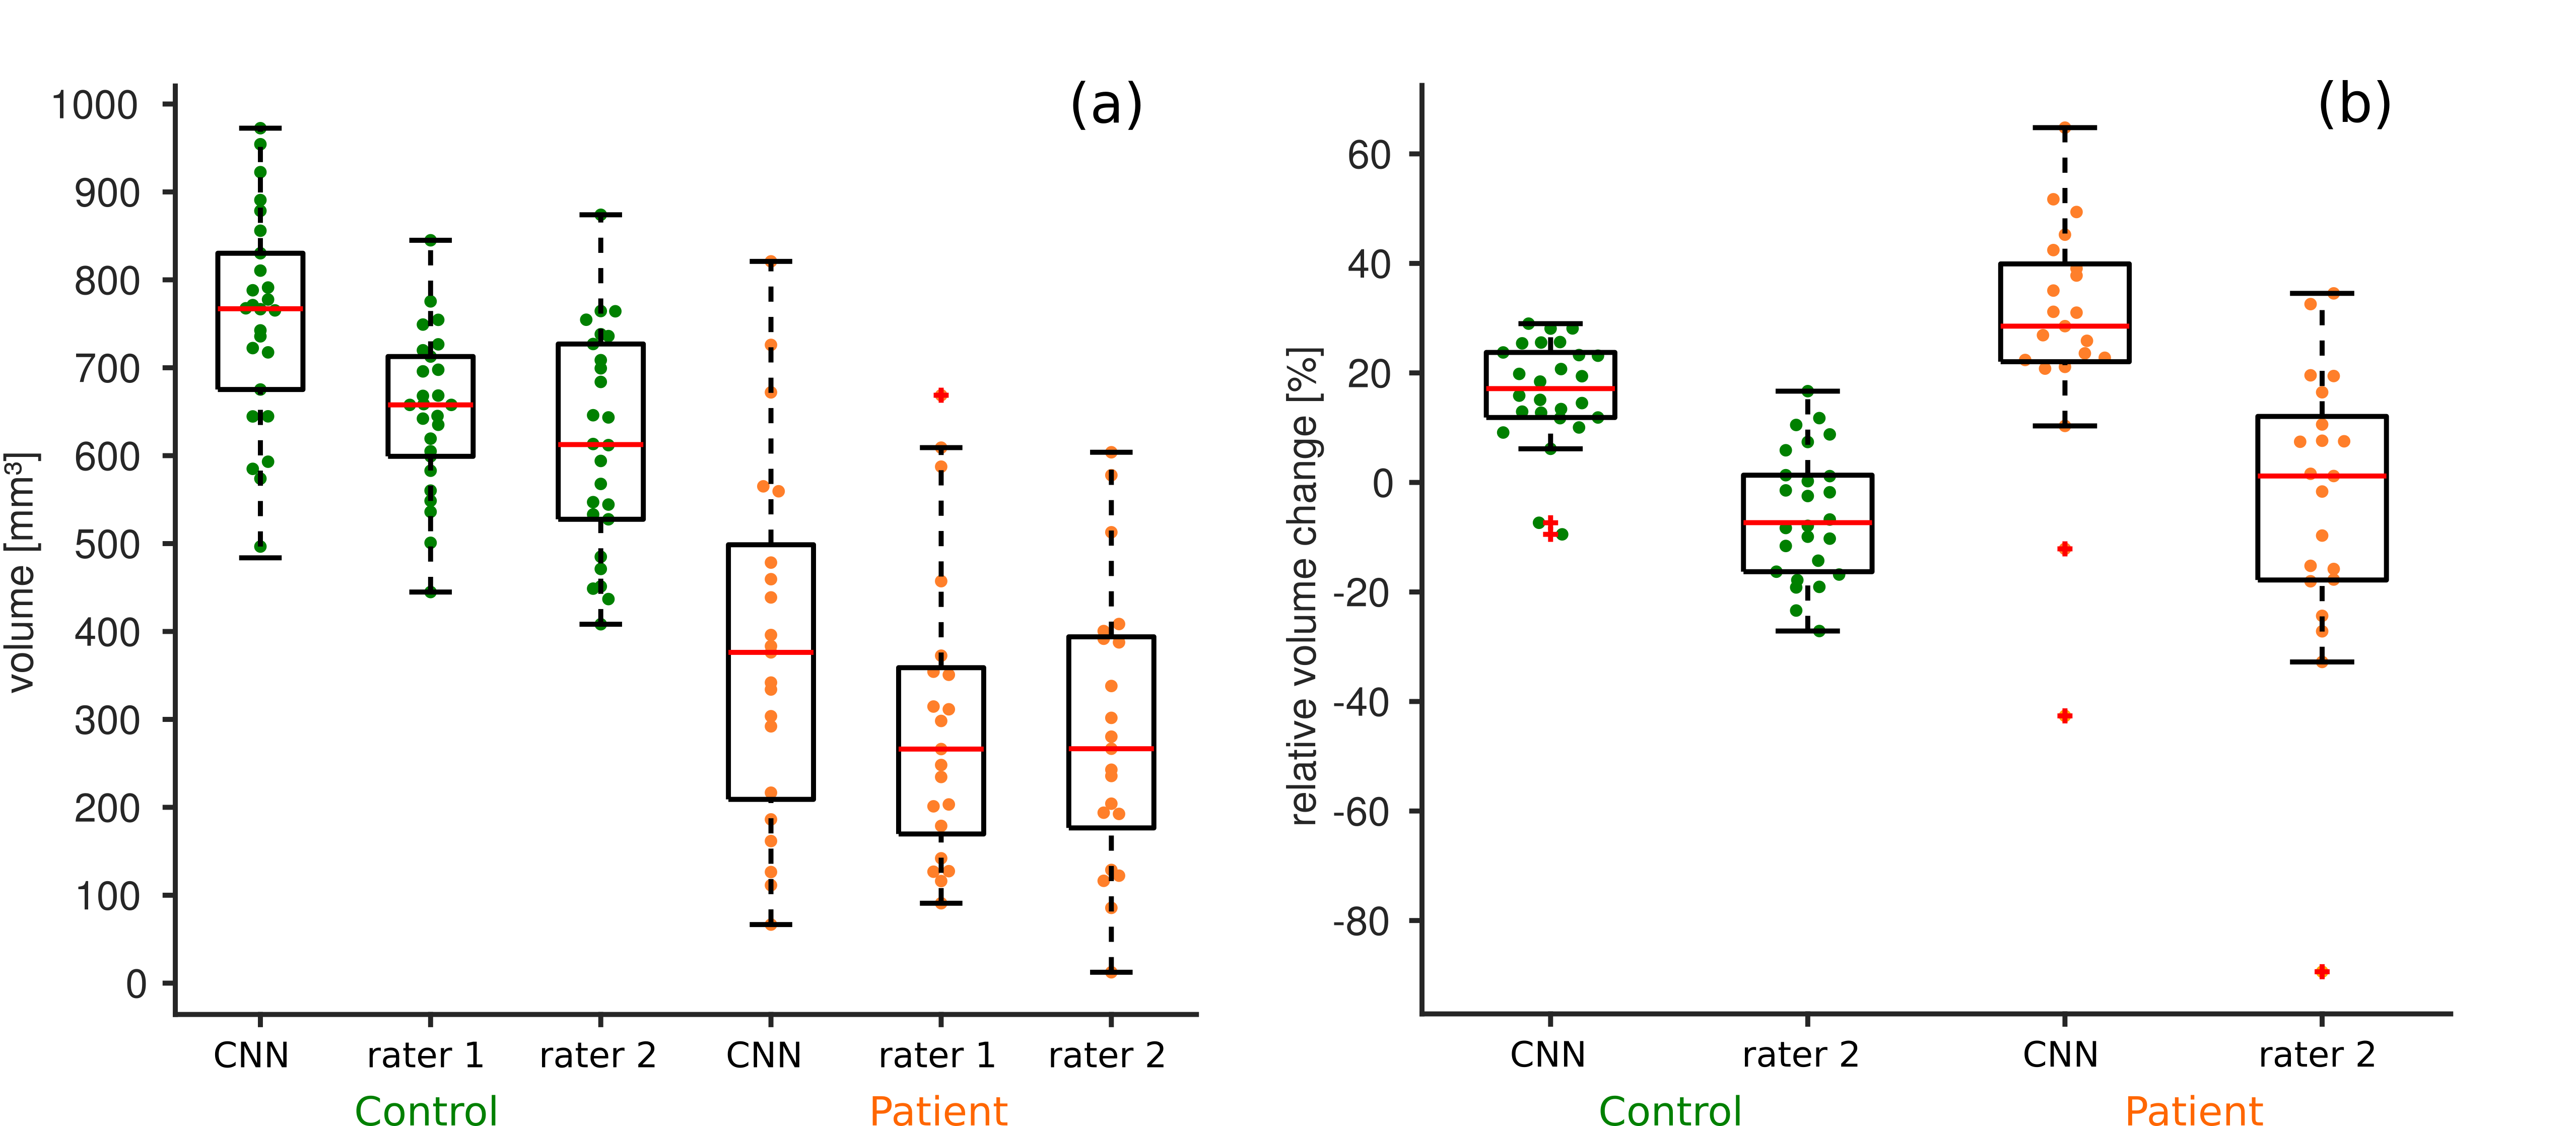
The segmentation outcome of the CNN, rater 1 and rater 2 are presented for two healthy controls and SCA6 patients with the highest and lowest DSC in Figures 1 and 2, respectively. While the visual appraisal of the dentate nuclei in some SCA6 patients was diminished (Fig. 2, row 3 and 4), the CNN was able to identify the dentate reasonably well in line within inter-rater variabilities. Compared to the manual delineations the CNN provides smoother edges due to an averaging effect learned by the network. Figure 3 displays the CNN segmentation performance and inter-rater variability for the dentate nuclei. Higher DSCs were achieved by the results of the CNN compared to both rater 1 (mean DSC controls: 65%±6%, mean DSC patients: 61%±7%) and 2 than between rater 1 and 2 (mean DSC controls: 51%±4, mean DSC patients: 49±10). As the CNN was trained with labels drawn by rater 1, we observed a bias toward higher DSC for this rater. In comparison to dice coefficients presented for multi-atlas dentate segmentation in controls (DSC about 55%),9 we observed slightly higher values (65%±6%). In line with manual delineations, our CNN-based delineation reveals substantially reduced volumes for the SCA6 patients compared to the controls (Fig. 4a). The CNN segmentations reveals volume increases compared to the manual delineations of rater 1 by about 25% most likely due to the fact that the CNN outcome is slightly smoother (Fig. 4b).Conclusion
Our proposed CNN is able to accurately delineate the dentate nuclei based on susceptibility maps in both healthy controls and SCA6 patients. As we trained the network with various patients, we are confident that it will be helpful to identify shape and volume changes in patients other than SCA6 (e.g. multiple sclerosis).Acknowledgements
We thank Beate Brol for manual delineation of the dentate nuclei. The study is funded by the German Research Foundation (DFG, DE 2516/1-1 and TI 239/17-1) and the Else Kröner-Fresenius-Stiftung (Essener Ausbildungsprogramm "Labor und Wissenschaft" für den ärztlichen Nachwuchs, ELAN, awarded to D. Jäschke).References
1. Tellmann S, Bludau S, Eickhoff S, Mohlberg H, Minnerop M, Amunts K. Cytoarchitectonic mapping of the human brain cerebellar nuclei in stereotaxic space and delineation of their co-activation patterns. Front Neuroanat. 2015;9:54.
2. Khadilkar S, Jaggi S, Patel B, Yadav R, Hanagandi P, Faria do Amaral LL. A practical approach to diseases affecting dentate nuclei. Clin Radiol. Jan 2016;71(1):107-119.
3. Haacke EM, Xu Y, Cheng YC, Reichenbach JR. Susceptibility weighted imaging (SWI). Magn Reson Med. Sep 2004;52(3):612-618.
4. Schweser F, Deistung A, Reichenbach JR. Foundations of MRI phase imaging and processing for Quantitative Susceptibility Mapping (QSM). Z Med Phys. Mar 2016;26(1):6-34.
5. Deistung A, Schweser F, Reichenbach JR. Overview of quantitative susceptibility mapping. NMR Biomed. Apr 2017;30(4).
6. Stefanescu MR, Dohnalek M, Maderwald S, et al. Structural and functional MRI abnormalities of cerebellar cortex and nuclei in SCA3, SCA6 and Friedreich's ataxia. Brain. May 2015;138(Pt 5):1182-1197.
7. Deistung A, Jäschke D, Göricke S, et al. Non-invasive Characterization of the Cerebellar Nuclei in Degenerative Cerebellar Ataxias (SCA3, SCA6) with Quantitative Susceptibility Mapping (QSM) at 3 Tesla. Paper presented at: Joint Annual Meeting ISMRM-ESMRMB2018; Paris, France.
8. Diedrichsen J, Maderwald S, Kuper M, et al. Imaging the deep cerebellar nuclei: a probabilistic atlas and normalization procedure. NeuroImage. Feb 1 2011;54(3):1786-1794.
9. Bazin P-L, Deistung A, Schäfer A, Turner R, Reichenbach J, Timmann D. Automated Segmentation of Cerebellar Nuclei from Ultra-High-Field Quantitative Susceptibility Maps with Multi-Atlas Shape Fusion. Paper presented at: Joint Annual Meeting ISMRM-ESMRMB2018; Paris, France.
10. Schweser F, Deistung A, Lehr BW, Reichenbach JR. Quantitative imaging of intrinsic magnetic tissue properties using MRI signal phase: an approach to in vivo brain iron metabolism? NeuroImage. Feb 14 2011;54(4):2789-2807.
11. Wu B, Li W, Guidon A, Liu C. Whole brain susceptibility mapping using compressed sensing. Magn Reson Med. Jan 2012;67(1):137-147.
12. Schweser F, Sommer K, Deistung A, Reichenbach JR. Quantitative susceptibility mapping for investigating subtle susceptibility variations in the human brain. NeuroImage. Sep 2012;62(3):2083-2100.
13. Jacobsen N, Deistung A, Timmann D, Reichenbach J, Güllmar D. Accurate Cerebellum segmentation using a 3D Convolutional Neural Network and fully connected CRF. Paper presented at: Joint Annual Meeting ISMRM-ESMRMB20182018; Paris, France.
14. Shah M, Xiao Y, Subbanna N, Francis S, Arnold DL, Collins DL, Arbel T. Evaluating intensity normalization on MRIs of human brain with multiple sclerosis. Medical Image Anal. 2011;15: 267–282.
15. Kamnitsas K, Ledig C, Newcombe VFJ, et al. Efficient multi-scale 3D CNN with fully connected CRF for accurate brain lesion segmentation. Med Image Anal. Feb 2017;36:61-78.
Figures