2824
Ultrafast Brain Segmentation using a 3D Fully Convolutional Neural Network for Risk Stratification of Cognitive Impairment and Dementia1Human Longevity, Inc., San Diego, CA, United States
Synopsis
Early detection and intervention has the potential for slowing disease progression of dementia. Brain segmentation of T1W structural MRI is an effective biomarker for assessing cognitive decline. However, automatic brain segmentation has required lengthy processing time and utilizes single structure for risk stratification. In this study, we developed a 3D fully convolutional neural network for ultrafast brain segmentation. Both qualitative and quantitative analysis demonstrated that our segmentation method has a strong generalization capability achieving promising experimental results. Furthermore, we utilized multiple regions in combination and defined a new biomarker to better differentiate early disease progression of normal versus MCI in addition to MCI versus Dementia. Our multi-region approach outperforms conventional single biomarkers.
Introduction
Dementia is a primary factor of disability globally affecting about 5-7% of individuals over 60 years. Early detection and intervention has the potential for slowing disease progression 1. Therefore, there is a widespread need to develop biomarkers that are measurable as long as possible before the disease occurrence. It is well known that T1 structural MRI of the brain is valuable for detection of dementia. However, the existing iterative or atlas-based approaches may require 3-12 hours to process a single individual’s brain making it more difficult to fit within clinical practice. Automatic brain segmentation is also challenging due to limited image contrast, resolution and volume coverage, especially for more regions. In this study, we developed a 3D fully convolutional neural network for ultrafast brain segmentation. Finally, we build upon current approaches for predicting risk of dementia which rely primarily on single measurement and/or biomarker to develop a new metric leveraging multiple structures. We utilized multiple regions in combination and defined a new biomarker to improve differentiation of the disease progression from MCI to Dementia and from normal to MCI.Methods
Approach
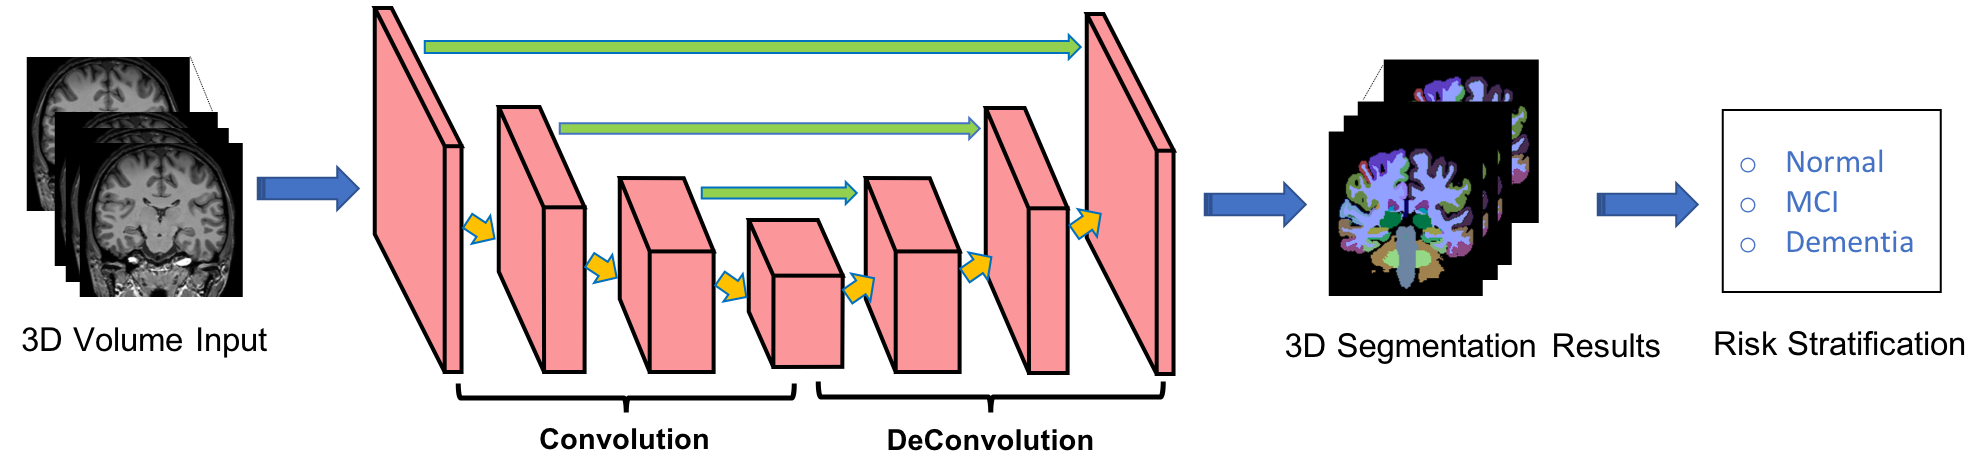
The overview of our approach is shown in Figure 1. Given a 3D patient data as input, the trained segmentation network model directly performs voxel-level prediction and effectively achieves multi-region segmentation (13 classes in this study). In detail, a 3D fully convolutional neural network based on a U-net model 2 was developed for brain segmentation. In order to deal with class imbalances between these thirteen classes and the background class, a Tversky loss 3 was introduced, which can achieve better trade-off between precision and recall in training 3D fully convolutional deep neural networks.
Model Training
The 3D fully convolutional neural network was developed with 450 training and 50 validation samples with representation of individuals diagnosed with dementia and mild cognitive impairment along with normal controls using from the ADNI 4.
Model Evaluation
The performance of the model was assessed using the Dice Coefficient by region on the hold-out validation set. Hold-out validation was also performed on images from the Health Nucleus, UK Biobank 5, and NACC 6 both qualitatively and quantitatively. Effect Size, measured with Cohen’s d, was used to evaluate the magnitude of differentiation between normal controls for each quantitative biomarker.
Multi-region Risk Score
In this study, a new biomarker was defined to effectively differentiate the disease progression from normal to both MCI and Dementia. We use the calculated effect sizes for all brain tissues as weights and sum up the volume of each tissue with the corresponding weight. The formula is defined as Risk = ∑wivi, where i denotes the ith tissue, wi is the weight associated with the ith tissue, and vi is the volume of the ith tissue.
Results
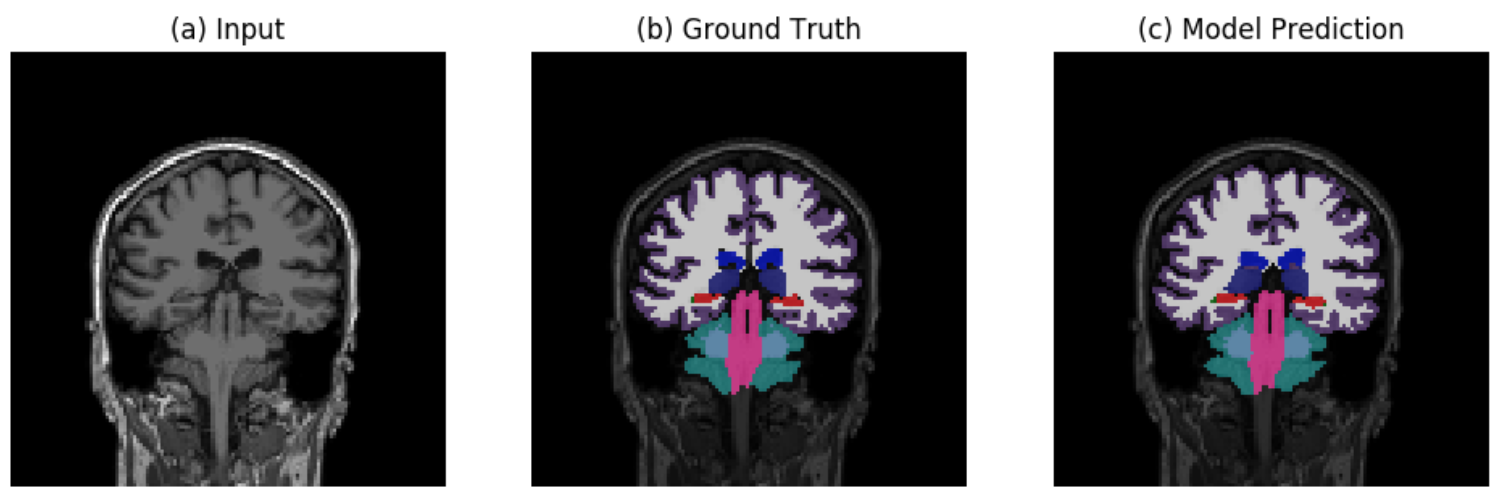
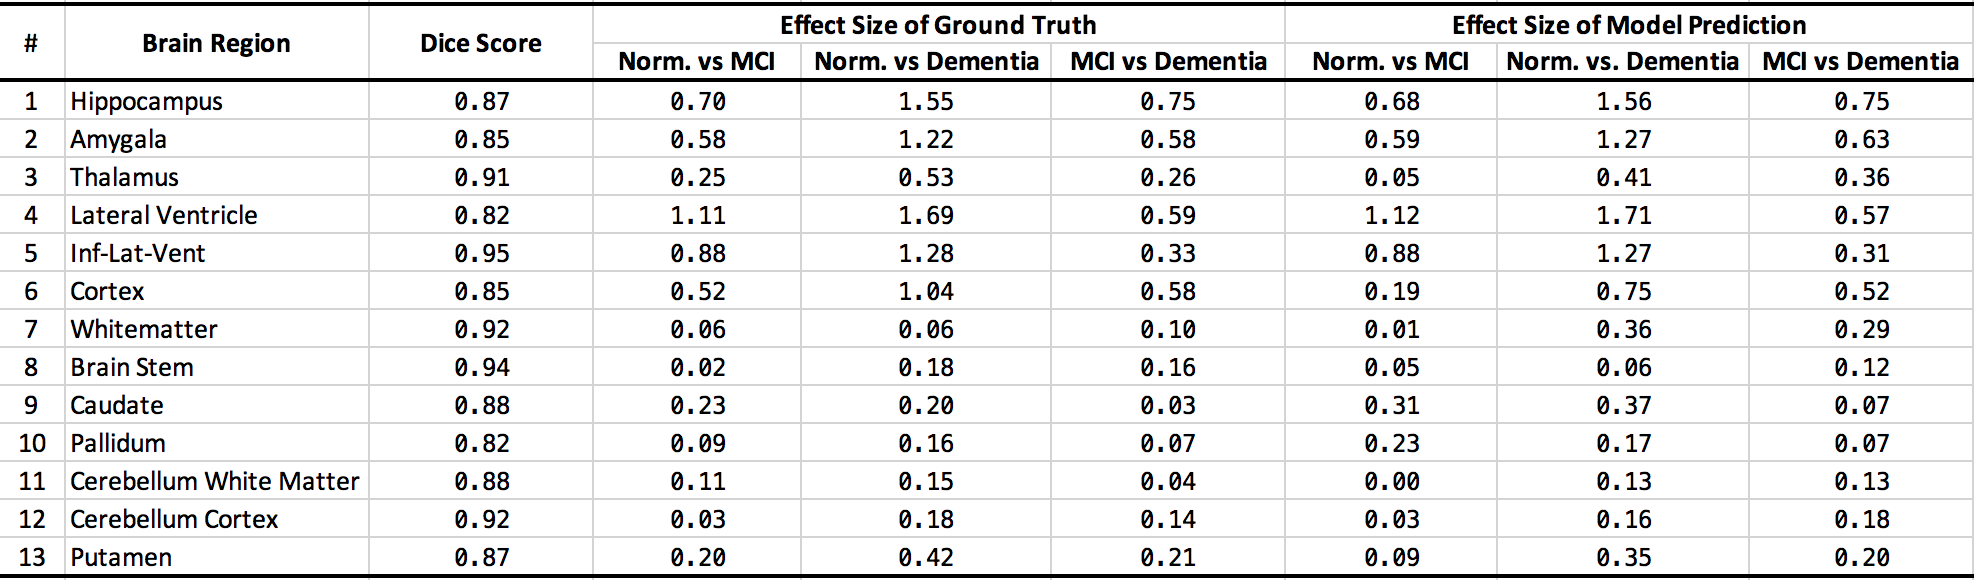
We employed 559 patient data from the Health Nucleus, UK Biobank and NACC as a testing set. We first visually investigated the segmentation results. Figure 2 shows that the segmentation results are qualitatively close to the ground truth. Then, we quantitively evaluated our segmentation method (Table 1). Our proposed method achieved an overall average dice score of 0.88. Also, we compared the effect sizes of model prediction with ground truth based on the volumes of brain regions. We found that the concordance of these two groups of data is strong, and the biomarkers calculated based on our segmentation should be predictive for risk stratification of cognitive impairment in addition to dementia.
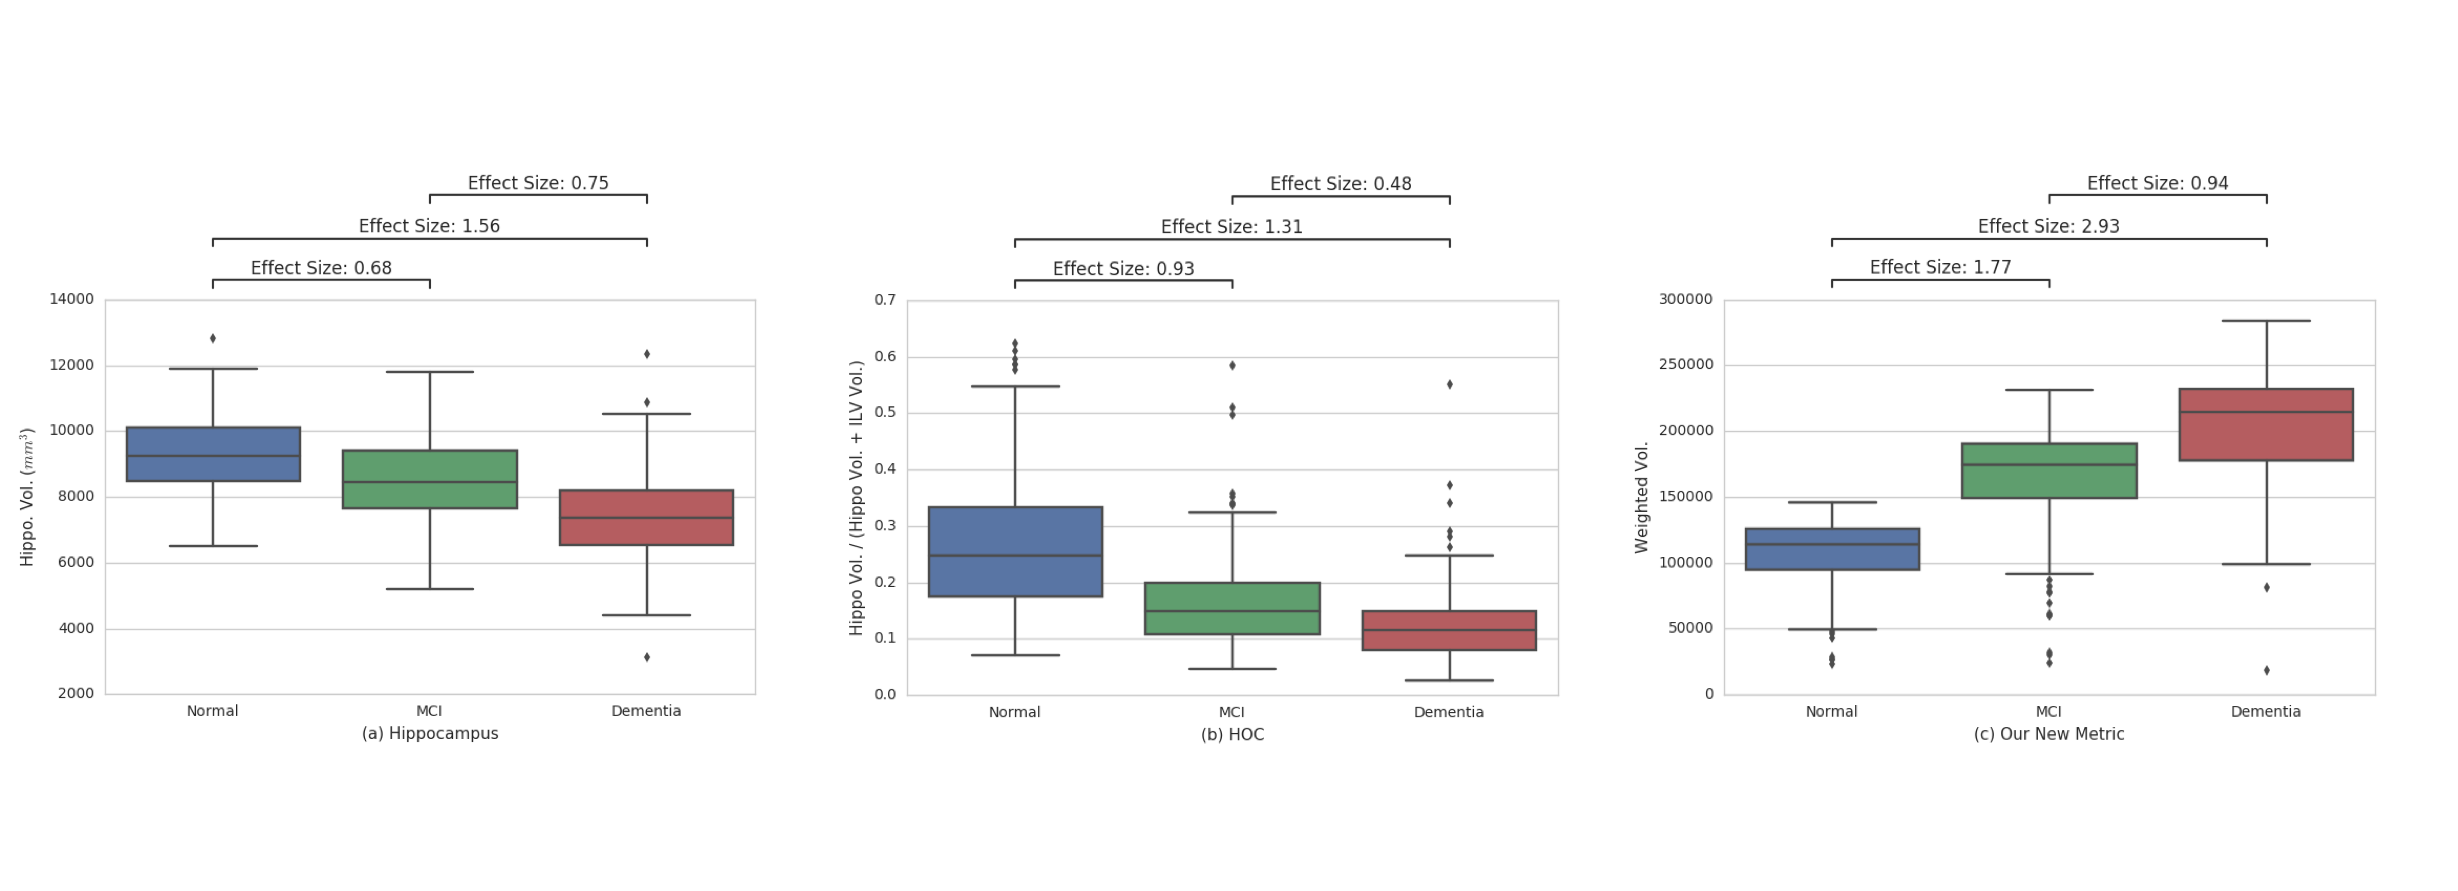
Furthermore, our method runs in ~1.7 sec on a V100 GPU and under 2 minutes on Intel Xeon. It is advantageous over widely used atlas-based and iterative approaches ensuring ultrafast segmentation for clinical scenarios. Most importantly, we investigated the performance our developed new multi-region biomarker. As shown in Figure 3, it shows the boxplots of three groups of populations using hippocampus volume, HOC and our new biomarker respectively. Our method achieves the effect sizes by Cohen’s d of (1.77, 2.93, 0.94) while (0.68, 1.55, 0.74) for Hippocampus and (0.93, 1.31, 0.48) for HOC.
Discussion/Conclusion
Here we show an ultrafast method for multi-region brain segmentation that it yields more predictive quantitative markers of disease. We evaluate the use of multiple regions predicted by our neural network in combination and show that our multi-region approach outperforms conventional single biomarkers. Specifically, we show improved differentiation of normal versus mild cognitive impairment in addition to MCI versus dementia. The use of these regions is being translated into clinical practice using integrated disease risk models that provide personalized assessments of individuals’ risks of developing dementia. In the work 7, we showcase the value of these regions with genetics to improve the short and long-term prediction of dementia cognitive decline.Acknowledgements
No acknowledgement found.References
1. Baumgart, M., Snyder, H.M., Carrillo, M.C., Fazio, S., Kim, H. and Johns, H., 2015. Summary of the evidence on modifiable risk factors for cognitive decline and dementia: a population-based perspective. Alzheimer's & Dementia, 11(6), pp.718-726.
2. Çiçek, Ö., Abdulkadir, A., Lienkamp, S.S., Brox, T. and Ronneberger, O., 2016, October. 3D U-Net: learning dense volumetric segmentation from sparse annotation. In International Conference on Medical Image Computing and Computer-Assisted Intervention (pp. 424-432). Springer, Cham.
3. Salehi, S.S.M., Erdogmus, D. and Gholipour, A., 2017, September. Tversky loss function for image segmentation using 3D fully convolutional deep networks. In International Workshop on Machine Learning in Medical Imaging (pp. 379-387). Springer, Cham.
4. http://adni.loni.usc.edu/
5. https://www.ukbiobank.ac.uk/
6. https://www.alz.washington.edu/
7. Schenker-Ahmed NM, Swisher CL, Huang L, et al. Multimodal models provide earlier prediction of dementia and cognitive decline and personalized actionability for risk mitigation for at-risk individuals. ISMRM 2019. Submitted.
Figures