2820
Quantitative Assessment of Treatment Efficacy in Acute Ischemia using Perfusion and Diffusion Weighted Imaging at 21.1-T1National High Magnetic Field Laboratory, Florida State University, Tallahassee, FL, United States, 2Chemical & Biomedical Engineering, FAMU-FSU College of Engineering, Tallahassee, FL, United States
Synopsis
This study employs perfusion and diffusion weighted imaging (PDWI) at 21.1 T to identify the pattern of potential recovery of cerebral blood flow (CBF) and apparent diffusion coefficient (ADC) in ischemic stroke with a novel stem cell therapy using dissociated aggregate human mesenchymal stem cells (d-hMSC) in a rodent stroke model. Spanning a week post ischemia, high field MRI was performed with the goal of quantitatively assessing treatment efficacy longitudinally. Results show longer term increase of ADC in the ischemic region and shorter term CBF stabilization in the contralateral region.
INTRODUCTION
Stroke incidence, a leading cause of death in the United States, is expected to rise with an aging population.1 Previous studies have demonstrated therapeutic potential for 2D cultured human mesenchymal stem cells (hMSC) for ischemic stroke2, and we have demonstrated that administration of intact 3D hMSC aggregates3,4 correlates with a reduced 23Na lesion volume over time as ionic homeostasis is restored. Perfusion and diffusion weighted imaging (PDWI) provide biomarkers, demonstrating pathological evidence for ischemia and quantifying extent of the ischemic penumbra. This study aims to utilize PDWI outcomes, with high spatial discrimination, applied to a rat stroke model to assess therapeutic efficacy of intra-arterial (IA) injections of hMSC dissociated from cultured 3D aggregates (d-hMSC). We hypothesize that d-hMSC will restore CBF and ADC values compared to control as measured by MRI at 21.1 T.METHODS
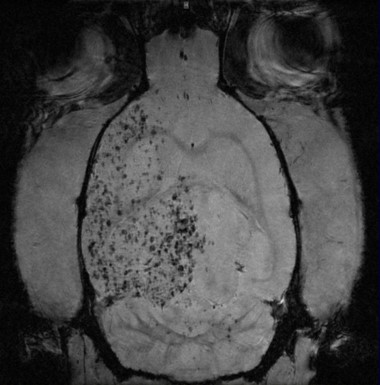
Animal Model: Male Sprague Dawley rats (220-250g) underwent 1-h transient middle cerebral arterial occlusion (MCAO) followed by immediate IA injection by microneedle of 1 million d-hMSC (n=3) or saline as control (n=3). Forty-eight hours prior to injection, 3D hMSC aggregates were trypsinized and replated in 2D. For 12 h, these d-hMSC were incubated with 7.47-µg/mL micron-sized particles of iron oxide (MPIO) overnight just prior to injection.
MR Techniques: Using the 21.1-T ultra-wide bore magnet at the US National High Magnetic Field Laboratory and a linear 1H/23Na birdcage coil, high resolution images were acquired at days 1, 3 and 7 post-MCAO/injection. Perfusion data were acquired with a resolution of 400x400x1500μm in three slices using a FAIR-RARE acquisition scheme in which tagging was performed on the imaging slices. A 14-ms hyperbolic secant inversion pulse with TE/TR/TIblood=16/5250/1140 ms was used with TIs of 50, 500, 1140, 2000 and 3000 ms for selective and non-selective labeling. Scan time was 10 min. DWI utilized a conventional spin echo over six effective b values (15-3000 s/mm2), matching FOV and resolution to perfusion scans using TE/TR=30/2250 ms. Scan time was 10 min. d-hMSC localization required a standard FLASH sequence: TE/TR=4/1000 ms, resolution=50x50x500μm, 21 slices. Scan time was 17 min.
Data Analysis: Data were analyzed using MATLAB for calculating pixel-by-pixel ADC (mm2/s) maps as well as CBF (mL/100mg/min) using a basic kinetic model to account for differential blood and tissue T1 values5. Resultant maps from D-1 acquisitions were segmented with ROIs corresponding to equivalently sized contra- and ipsilateral stroke regions. The same ROIs were replicated on data imaged on D-3,7 so that differences with respect to D-1 could be assessed. Statistical analysis was performed to determine significance longitudinally and between groups for each hemisphere.
RESULTS
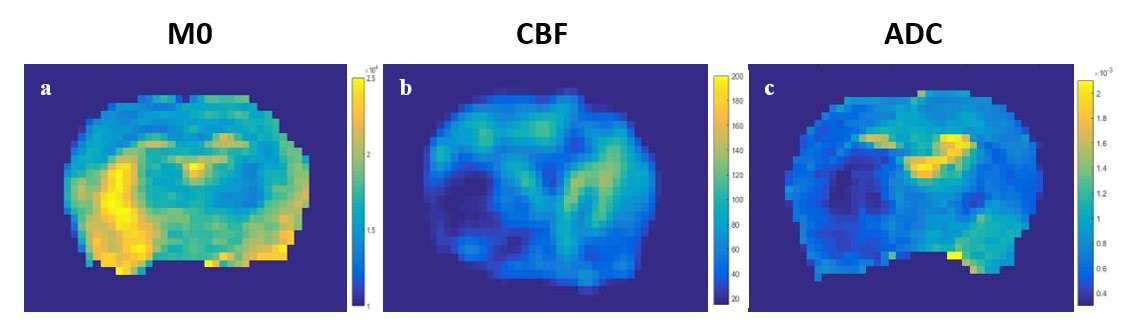
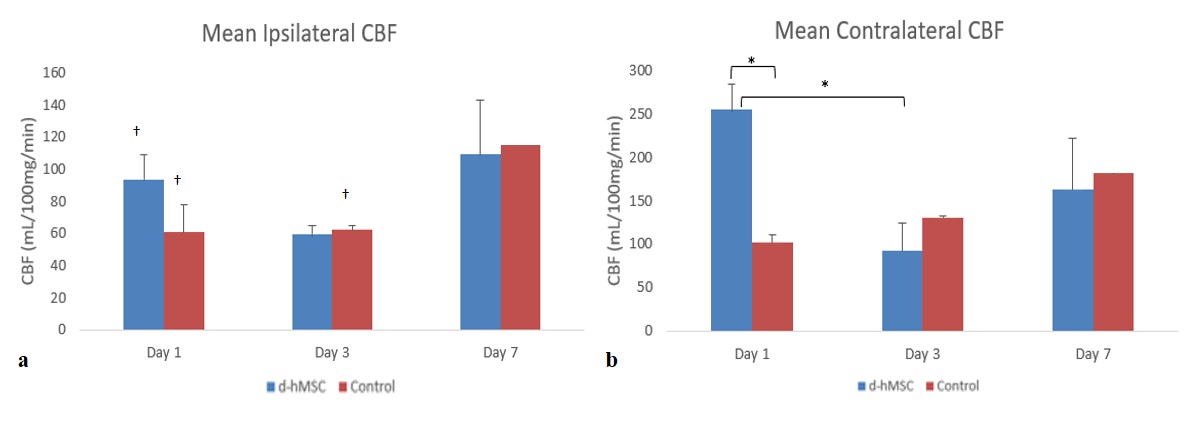
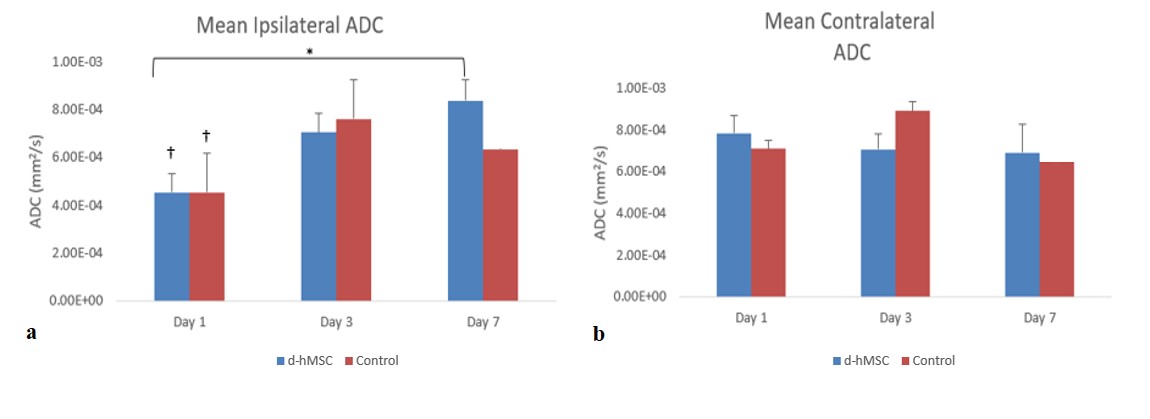
Successful IA d-hMSC injections were achieved (Fig.1). M0, CBF, and ADC maps were generated with clear delineation of the stroke (Fig.2). Significant differences in CBF with treatment were only observed at D-1 in the contralateral ROI (p<0.0001). Both injections showed significant hemispherical differences in CBF on D-1 (d-hMSC p<0.0001, control p=0.0319), as did control injection on D-3 (p=0.0216, Fig.3a). The d-hMSC group shows significant decreases in contralateral CBF from D-1 to D-3 (p=0.0001), indicating possible resistance to ischemic effects of swelling and blood vessel restriction early with stroke. This effect was not observed in the ipsilateral ROI, potentially indicating that ipsilateral CBF may be stabilizing across hemispheres with d-hMSC and at an earlier time than the control. There are significant changes in ADC from D-1 to D-7 for d-hMSC treatment on the ipsilateral side (p=0.0002), indicative of recovery and reduced cell swelling. ADC did not change significantly between hemispheric ROIs for either group except at D-1 (d-hMSC p=0.0009, control p=0.0070) (Fig4.a,b).DISCUSSION
Longitudinally, CBF tends to equalize for both d-hMSC and control (Fig.3b). CBF in the stroked penumbra, following d-hMSC injection, trend towards contralateral CBF over time (i.e. no difference between contra/ipsilateral CBF at D-3, 7). ADC increases significantly and longitudinally in the ipsilateral ROI after hMSC treatment, with contralateral ROIs not significantly changing with time or group (Fig.4a,b). Overall, d-hMSC appears to induce earlier reperfusion after MCAO, higher collateral flows and faster recovery of ADC restrictions.CONCLUSION
Our results explore CBF and ADC outcomes as biomarkers for ischemic stroke recovery related to IA d-hMSC treatment. These preliminary results show that d-hMSC may be impacting perfusion after MCAO, even in the contralateral hemisphere. Further, results show possible long-term ADC recovery in the ischemic hemisphere and potential short-term resistance to ischemic effects in the contralateral hemisphere when compared to controls.Acknowledgements
This work was supported by the NIH (RO1-NS102395). The National High Magnetic Field Laboratory is funded by the NSF (DMR-1644779) and the State of Florida.References
1. Benjamin EJ, et al. 2017. AMA, Statistics Committee and Stroke Statistics Subcommittee.
2. Wakabayashi K., et al. 2010. JNR. 88:1017-1025.
3. Ma T., et al. 2015. Tissue Eng Part A. 21(9-10):1705-1719.
4. Ma T., et al. 2014. Tissue Eng Part B Rev. 20(5):365-380.
5. Kwong, K. K. et al. MR Perfusion Studies with TI-Weighted Echo Planar Imaging. (1995).
Figures