2819
High Resolution MR Imaging of Amyloid Deposition in 5xFAD Mice Brains at 21.1 T1National High Magnetic Field Laboratory, Florida State University, Tallahassee, FL, United States, 2Chemical & Biomedical Engineering, FAMU-FSU College of Engineering, Tallahassee, FL, United States, 3Biomedical Engineering, Johns Hopkins University, Baltimore, MD, United States, 4Biomedical Engineering, Georgia Institute of Technology & Emory University School of Medicine, Atlanta, GA, United States
Synopsis
This study utilizes high resolution 3D images acquired at 21.1 T to display the presence of amyloid plaques, which temporally correlate with the progression of structural connectivity alterations in this transgenic preclinical model. As a function of phenotype, age and gender, high resolution scans were performed on APP/PS1 mouse brains and age-matched wild-type controls. Data indicate that plaques may be visible in mice as young as 4 months without the use of any magnetic contrast agents.
Introduction
Alzheimer’s disease (AD) is the most common form of dementia, characterized by memory loss and changes in behavior1. The most prevalent preclinical model of is the double transgenic mouse expressing human genes for amyloid precursor protein (APP) and presenilin-1 (PS1). Clinically, MRI is used to diagnose AD by means of volumetrics, mainly focusing on hippocampal atrophy2. In this study, ultra-high field, high resolution susceptibility-weighted 3D imaging was used to identify β-amyloid plaque deposition in the 5xFAD variant of APP/PS1 as a function of age and sex at early time points in the pathological progression without the use of any magnetic contrast agents at 500MHz (11.75T) and 900MHz (21.1T).Methods
Image datasets were acquired using preserved mouse brains (4% paraformaldehyde) from male and female specimens either expressing the APP/PS1 phenotype or an age-matched wild-type. Brains were harvested at 1, 2, 4 and 6 months (N=5 per age, gender and phenotype). Using both 900- and 500-MHz magnets (21.1 T and 11.75 T), image datasets were acquired using a true 3D gradient-recalled echo sequence with a repetition time of 100 ms and two echo times, 7.5 and 15 ms. T2* values were calculated using these two echo times. Scans were acquired at a 50-μm isotropic resolution on both magnets and 25-μm isotropic resolution on the 21.1 T. Isotropic resolutions at 21.1 T were provided by matrix sizes of 600x370x370 for 25-μm and 300x150x150 for 50-μm and resulted in acquisition times of 7.5hrs and 1hr, respectively. At 11.75 T, three brains were imaged simultaneously using a 25-mm proton tuned birdcage coil. Images were reconstructed with no zero filling or filters. SNR was used to provide individual threshold values using a 3σ approach. The threshold values were used to determine the void volume of each sample by subtracting the thresholded volume from the total interior volume of the sample. Whole brain volumetrics were done in AMIRA by determining 3σ threshold values from the average signal to provide a minimum threshold used to exclude dark regions possibly containing plaques.Results & Discussion
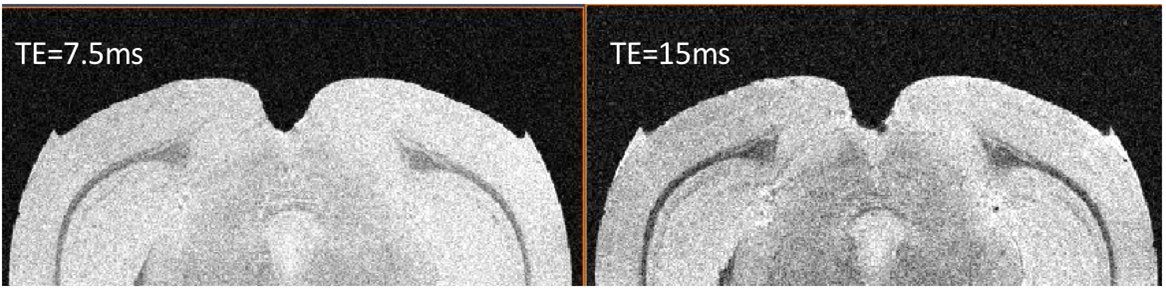
While the lower
TE=7.5 ms provided a higher SNR, the higher TE=15 ms provided a better contrast
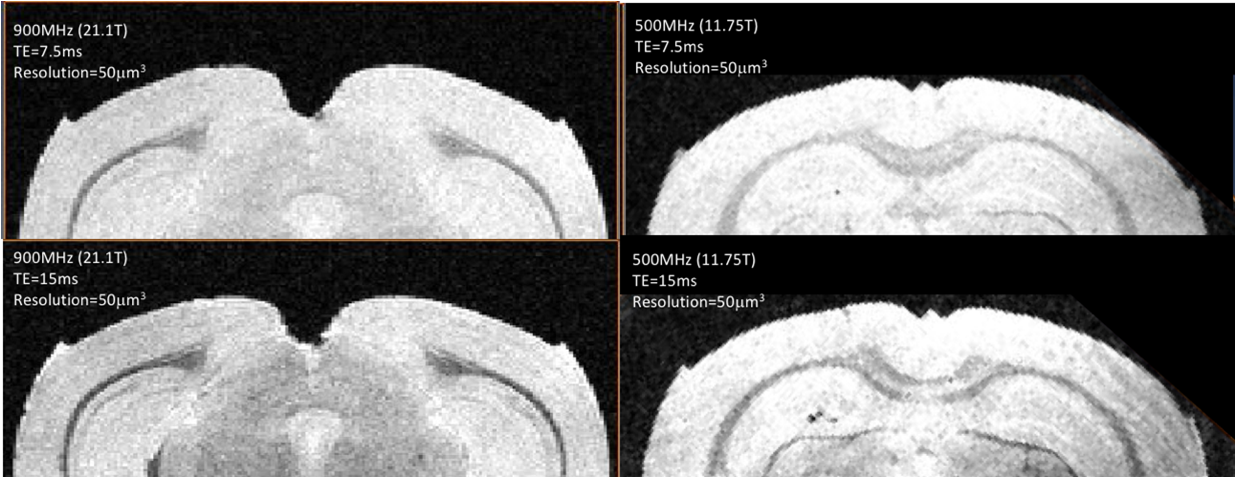
for visualizing the areas where plaques may be present [FIGURE 1]. Additionally, the visual resolution of scans acquired on
both the 11.75 T and 21.1 T at 50-μm
was well below what was required to identify plaques. Volume averaging and
signal increases at 50-μm limited our ability
to pick out dark plaque regions as well [FIGURE
2].
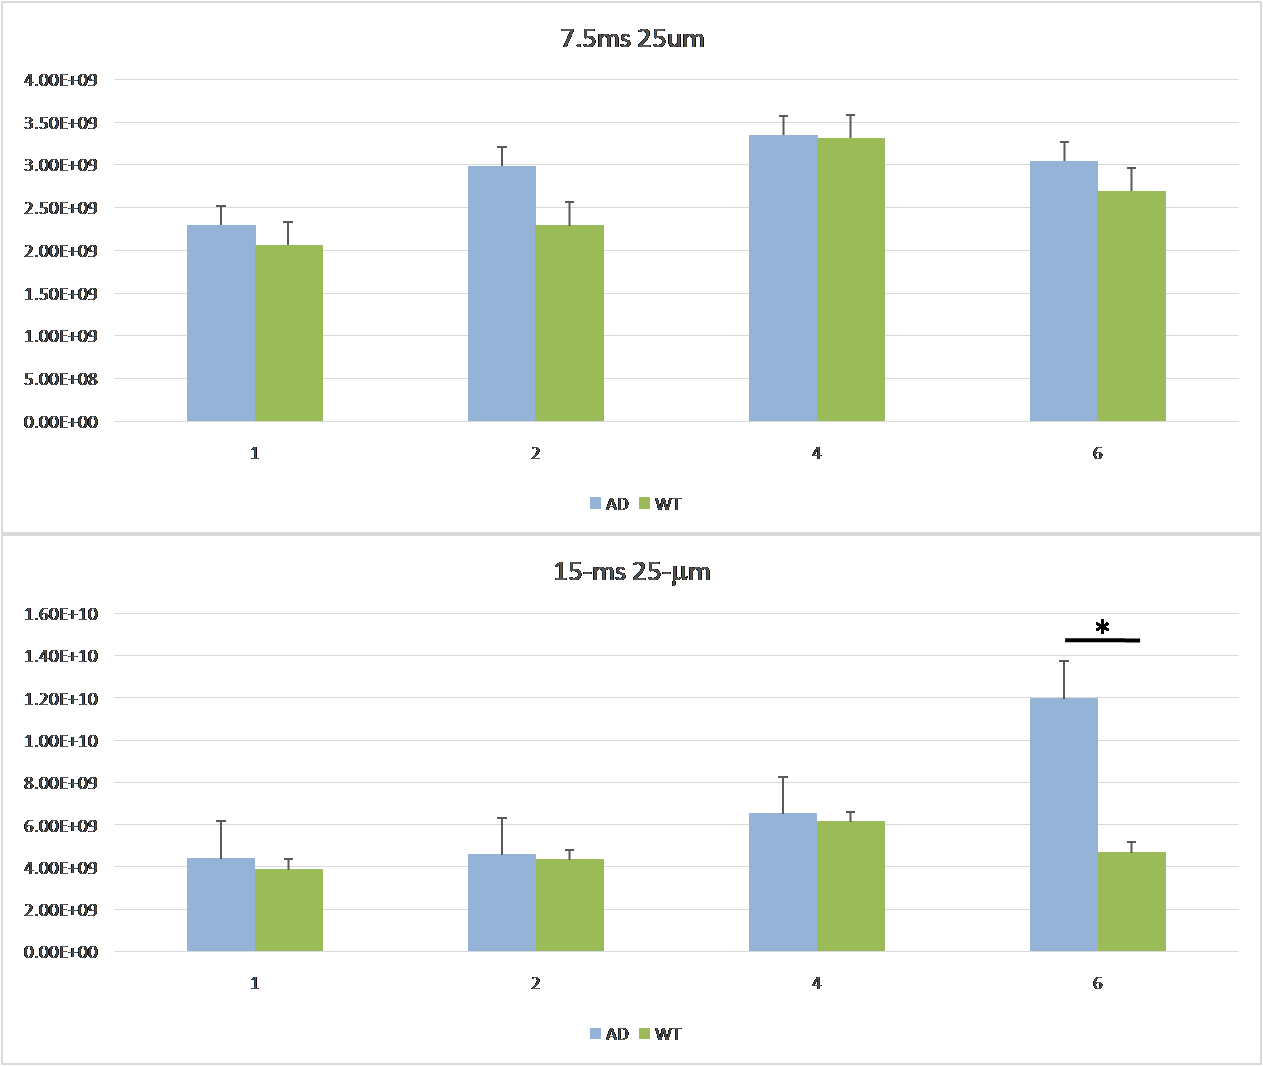
Void volumes longitudinally
increased with age [FIGURE 3]. Although
TE=7.5ms data displays an increasing trend overall with age, it was not
possible to discriminate between 5xFAD and wild-type void volumes at any specific
age. The TE=15ms data provided enough contrast to delineate between wild-type
and 5xFAD void volumes, but only at the 6 month age (p-value=0.0294).
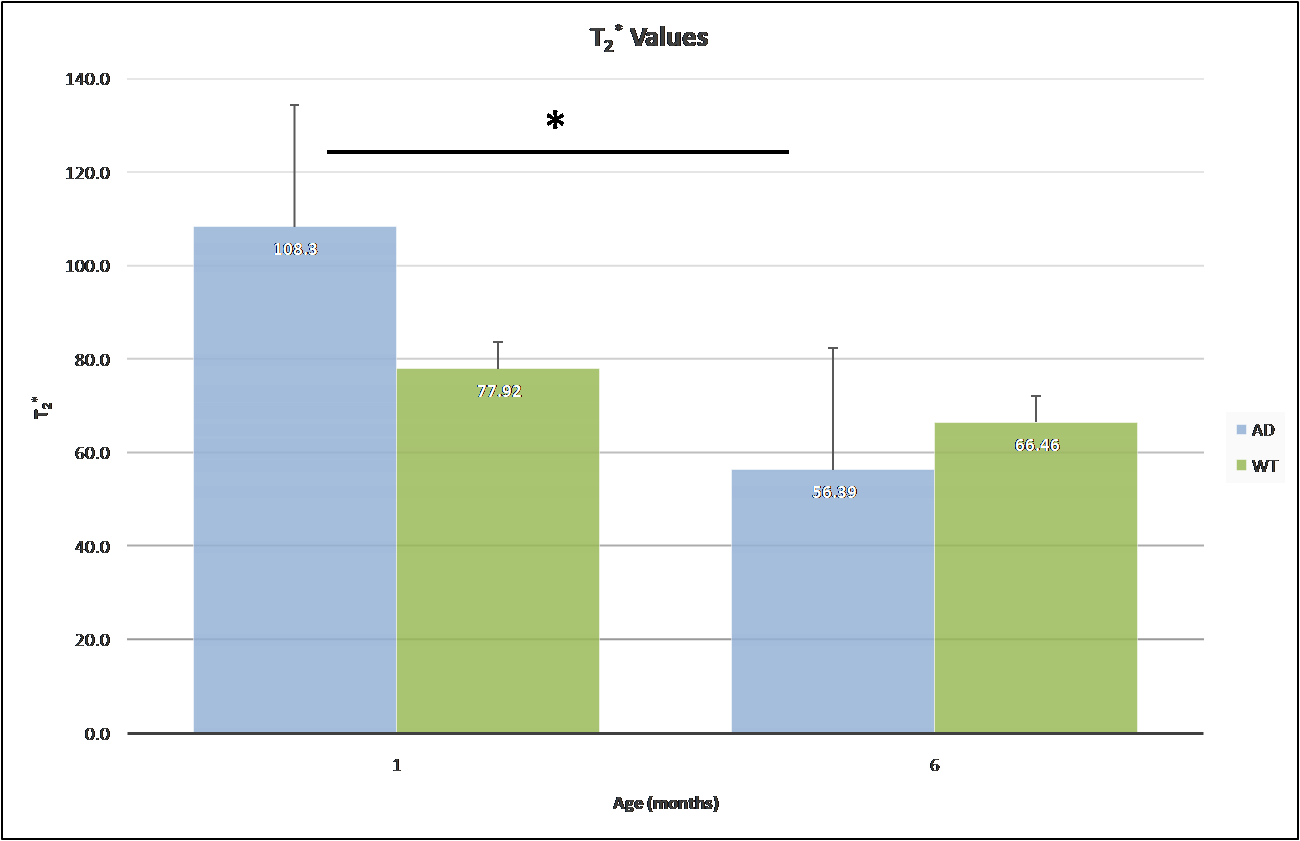
Quantitative T2* maps
and T2* values based on ROIs placed it the piriform area
(where plaque burden appeared highest) demonstrated reductions in regional T2*
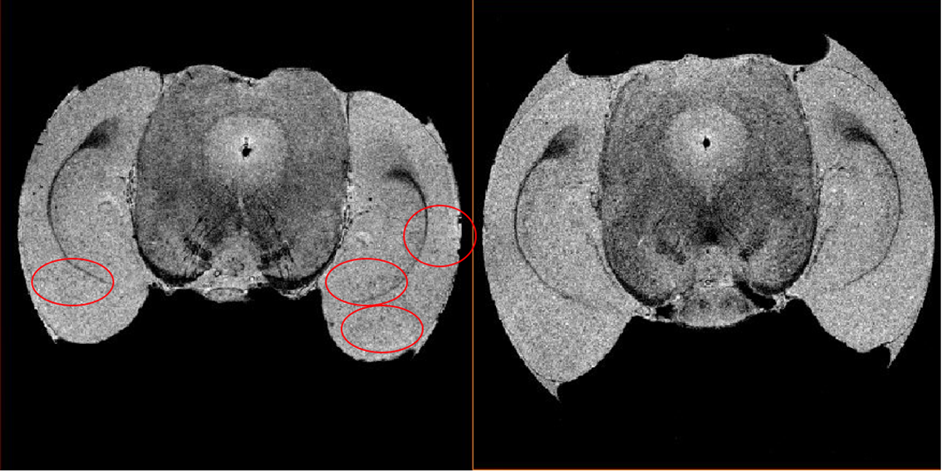
between 1 and 6 months only for the 5xFAD specimen [FIGURE 4]. Generally, areas of expected plaque deposition demonstrated
higher contrast [FIGURE 5], supporting
the contention that plaques, or metals co-localized with the plaques, are in
fact being detected by this method. Immunohistochemistry to confirm plaque
distribution is underway.Conclusion
These results propose that high-field MR techniques could detect AD based on the presence of plaques using endogenous susceptibility, i.e. without use of external contrast agents. This work could expand the application of SWI at high fields as a means of visualizing other aggregates or metal depositions in a noninvasive manner.Acknowledgements
This work was funded by NSF (DMR-1157490 & DMR-1644779), the State of Florida, the National High Magnetic Field Laboratory User Collaborations Grant Program, and NIH (R01 NS102395).References
1. U.S Department of Health & Human Services.www.alzheimers.gov.
2. Tang, X., Qin, Y., Wu, J., Zhang, M., Zhu, W., & Miller, M. I. 2016. Shape and diffusion tensor imaging based integrative analysis of the hippocampus and the amygdala in Alzheimer's disease.Magnetic resonance imaging.34(8):1087-1099.
Figures