2818
Improvement of R2* mapping in Alzheimer’s Disease at 9.4T through reduction of B0 fluctuation-induced image artifacts using Navigator Echoes1High Magnetic Field, Max Planck Institute for Biological Cybernetics, Tuebingen, Germany, 2Institute for Biomedical Magnetic Resonance, Eberhard Karl’s University, Tübingen and University Hospital Tübingen, Tuebingen, Germany, 3Department of Psychiatry and Psychotherapy, Eberhard Karl’s University, Tübingen and University Hospital Tübingen, Germany, Tuebingen, Germany, 4Department of Psychiatry and Psychotherapy, Eberhard Karl’s University, Tübingen and University Hospital Tübingen, Tuebingen, Germany
Synopsis
Ultra-High-Field (UHF) MRI provides a potential non-invasive means to investigate Alzheimer’s Disease (AD). R2* map is one of the most established MRI techniques to detect iron concentration in the brain. However, image quality can be substantially affected by B0 fluctuation-related-artifacts at UHF. In this study we showed an improvement of the quality of R2* maps in AD at 9.4T using Navigator Echos approach.
Purpose
Quantitative MRI at Ultra-High Field (UHF) hold promise to investigate AD, which is characterized by an alteration of iron concentration. The effective transverse relaxation rate (R2*) have been shown to be highly sensitive to B0 inhomogeneities generated by iron concentration1,2. However, B0 fluctuation induced by the increase in susceptibility-induced-field variations at UHF, can heavily degradate image quality by introducing artifacts such as ghosting and blurring. This study aimed to improve the quality of the R2* maps in AD at UHF using Navigator Echos approach.Methods and materials
Five patients with Alzheimer’s Disease (age > 64 years) and six healthy controls (45 to 56 years) were scanned at 9.4T using a multi-echo (N=6) 3D-GRE sequence (0.375x0.375x0.8mm3 voxel size, TR=42ms; TE=6 to 30ms in steps of 6ms, TA=9min, FOV=192x174x70.4mm3, matrix size=512x464x88). An FID navigator was acquired before the phase-encoding and readout pre-winding gradients, with no gradients applied in the readout direction during the acquisition of the navigator. For each phase-encoding step the navigator was then used to recover the phase offset, which was successively subtracted from the corresponding k-space data in a corresponding echo. The phases in each echo were adjusted using the timing of each echo-readout, with respect to the excitation time. T2*-weighted images used to calculate R2* maps were reconstructed with and without the navigators. R2* mapping was evaluated assuming a mono-exponential decay of the signal by non-linear fitting of the T2* at the 6 TE, reconstructed with and without navigators. ROI (Region Of Interest) based analyisis was also performed with and without navigators on AD patients and on five healthy controls (HC) using the Harvard-Oxford Atlas.Results
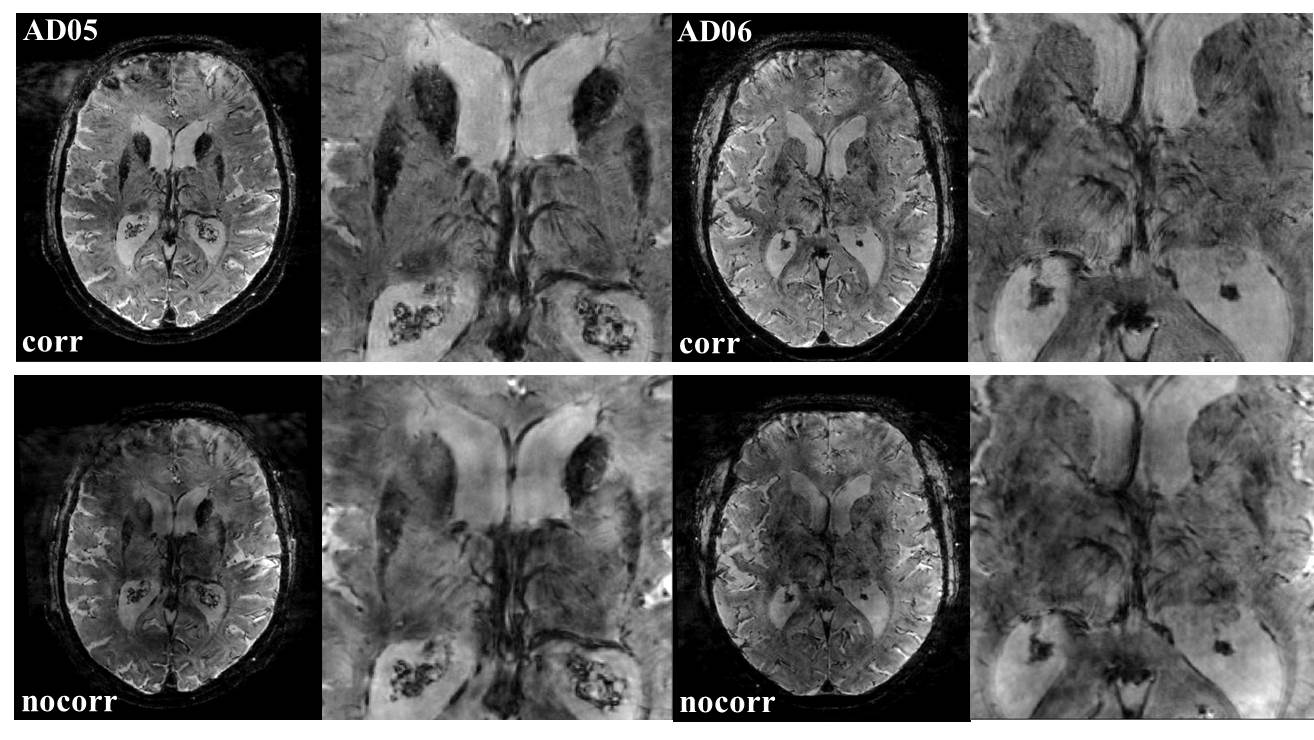
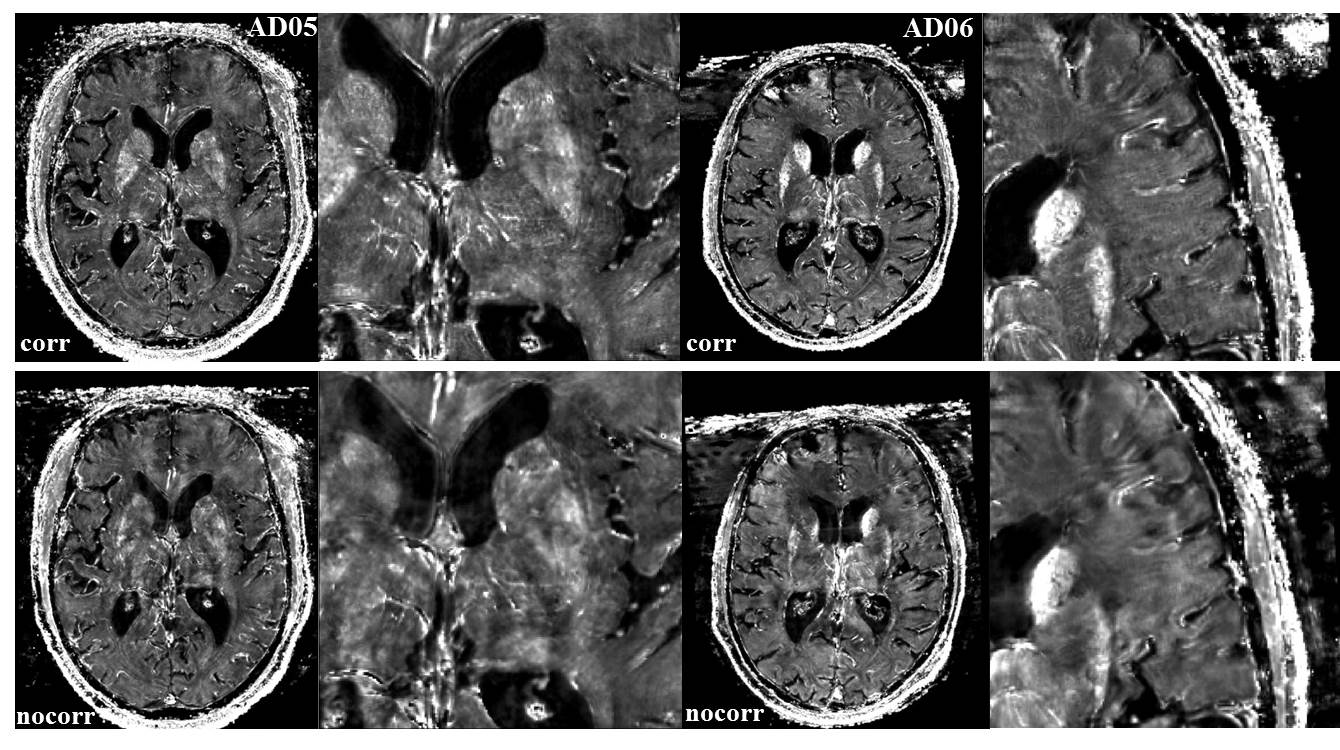
Fig. 1 shows T2*-weighted images of two AD patients (AD05 and AD06, respectively). The top row shows the images reconstructed with navigator correction. The bottom row shows the same slices of the images reconstructed without navigator correction. A substantial reduction of the artifacts after navigator echo correction is clearly evident (evidenced by the zoomed images), including blurring and ghosting artifacts. Figure 2 shows R2* mapping of the same patients, using T2* images reconstructed with navigator (top row) and without navigator correction (bottom row). Significantly, also areas with a strong magnetic field inhomogeneity, as the frontal brain, showed improvements, as shown in the zoomed image of the AD06 patient. From ROI-based analysis we found a significative difference (p<0.05) in the covariance of R2* values obtained with and without navigators within nine ROIs from the Harvard-Oxford Atlas: Inferior Frontal Gyrus pars opercularis, Superior Temporal Gyrus anterior division, Superior Temporal Gyrus posterior division, Middle Temporal Gyrus temporo occipital part, Precuneous, Parahippocampal Gyrus anterior division, Frontal Operculum Cortex Heschl's Gyrus, Accumbens. In seven out of these ROIS a decreased covariance was found using navigators compared to the approach without navigators. However, compared to healthy controls, covariance was significantly bigger using both approaches.Conclusion
R2* maps provide a potential means for investigating Alzheimer’s Disease, by detecting small signal changes due to the variation of iron concentration. Although a higher SNR can be achieved at ultra high field, challenges arise from the greater inhomogeneity of B0 field. In this study we showed that the quality of the T2*-weighted images and R2* maps were substantially improved by using the navigator echoes approach, even in areas with strong magnetic field inhomogeneity. ROI-based analysis showed a significative difference (p<0.05) in the covariance of R2* values between the two approaches in nine regions of interests. Covariance was found decreased in seven out of nine areas using Navigators, and among these areas was Precuneus. This result is particularly crucial since Precuneus is one of the areas affected by atrophy in early-onset Alzheimer’s disease3. Furthermore, it has been shown that loss of grey matter connectivity is related to β-amyloid load in elderly HC4. Therefore, reducing fluctuations in such a crucial area is of pivotal importance for the study of Alzheimer’s Disease.Acknowledgements
Funding from EULAC-HEALTH T01-0118 is gratefully acknowledgedReferences
1. Langkammer, C., Krebs, N., Goessler, W., Scheurer, E., Ebner, F., Yen, K., ... & Ropele, S. (2010). Quantitative MR imaging of brain iron: a postmortem validation study. Radiology, 257(2), 455-462.
2. Stueber, C., Morawski, M., Schäfer, A., Labadie, C., Wähnert, M., Leuze, C., ... & Spemann, D. (2014). Myelin and iron concentration in the human brain: a quantitative study of MRI contrast. Neuroimage, 93, 95-106.
3. Giorgos Karas, Philip Scheltens, Serge Rombouts, Ronald van Schijndel, Martin Klein, Bethany Jones , Wiesje van der Flier, Hugo Vrenken, Frederik Barkhof, (2007). Precuneus atrophy in early-onset Alzheimer’s disease: a morphometric structural MRI study. Neuroradiology, 49:967–976
4.Tijms, B. M., Dicks, E., Scheltens, P., Barkhof, F., & Van der Flier, W. M. (2018). LOSS OF GREY MATTER CONNECTIVITY IN THE PRECUNEUS IS ASSOCIATED WITH FASTER ATROPHY RATES IN PRECLINICAL ALZHEIMER’S DISEASE. Alzheimer's & Dementia: The Journal of the Alzheimer's Association, 14(7), P13.
Figures