2817
Comparison of Perivenular Perivascular Spaces at 7 Tesla in Relapsing-Remitting Multiple Sclerosis Patients and Healthy Controls1Department of Medical Education, Icahn School of Medicine at Mount Sinai, New York, NY, United States, 2Corinne Goldsmith Dickinson Center for Multiple Sclerosis, Icahn School of Medicine at Mount Sinai, New York, NY, United States, 3Translational and Molecular Imaging Institute, Icahn School of Medicine at Mount Sinai, New York, NY, United States, 4Department of Radiology, Icahn School of Medicine at Mount Sinai, New York, NY, United States
Synopsis
Multiple sclerosis (MS) is a CNS autoimmune disease of unknown etiology. Prior MS studies have characterized an inflammatory process involving the perivascular spaces (PVSs) of a central vein, but have reported conflicting results regarding which aspects of PVS anatomy correlate to clinical aspects of the disease. This preliminary study compared percentages of manually marked perivenular and non-perivenular PVSs in relapsing-remitting MS patients and healthy controls, and detected a higher rate of vein-coincident PVSs in the former group. We posit that perivenular PVSs have potential as a candidate imaging marker for MS diagnosis, disease activity, and treatment efficacy.
Introduction
Multiple sclerosis (MS) is a chronic demyelinating condition that affects over 2 million people worldwide,1 and is the predominant cause of non-traumatic neurological disability in young adults.2 Given the highly variable and often nonspecific clinical presentation of MS, magnetic resonance imaging (MRI) has facilitated earlier diagnosis of both symptomatic and non-symptomatic patients.1 The characteristic appearance, location, and dynamic formation of T2 hyperintense lesions on MRI are currently used to diagnose MS and monitor for disease activity. More sensitive markers of disease activity may contribute to earlier diagnosis and/or more effective disease surveillance.3 In MS patients, immune cells are observed to congregate within perivascular spaces (PVSs) around central veins.4,5 Animal models have shown that the signals received by immune cells within PVSs precipitate their entry into the CNS; the extent of this infiltration corresponds to the magnitude of clinical disability.6,7 Clinical-strength (1.5 and 3T) imaging studies comparing PVS anatomy in MS patients and healthy controls have yielded conflicting results.8-13 Furthermore, these studies do not differentiate between perivenular and non-perivenular PVSs, an anatomical distinction of critical pathophysiological importance.13 This preliminary study employs ultra-high-field 7T imaging to compare the proportions of perivenular and non-perivenular PVSs in relapsing-remitting multiple sclerosis (RRMS) patients with those of healthy controls (HC), and demonstrates the feasibility of further exploring perivenular PVSs as a novel candidate imaging marker for MS diagnosis and disease activity.Methods
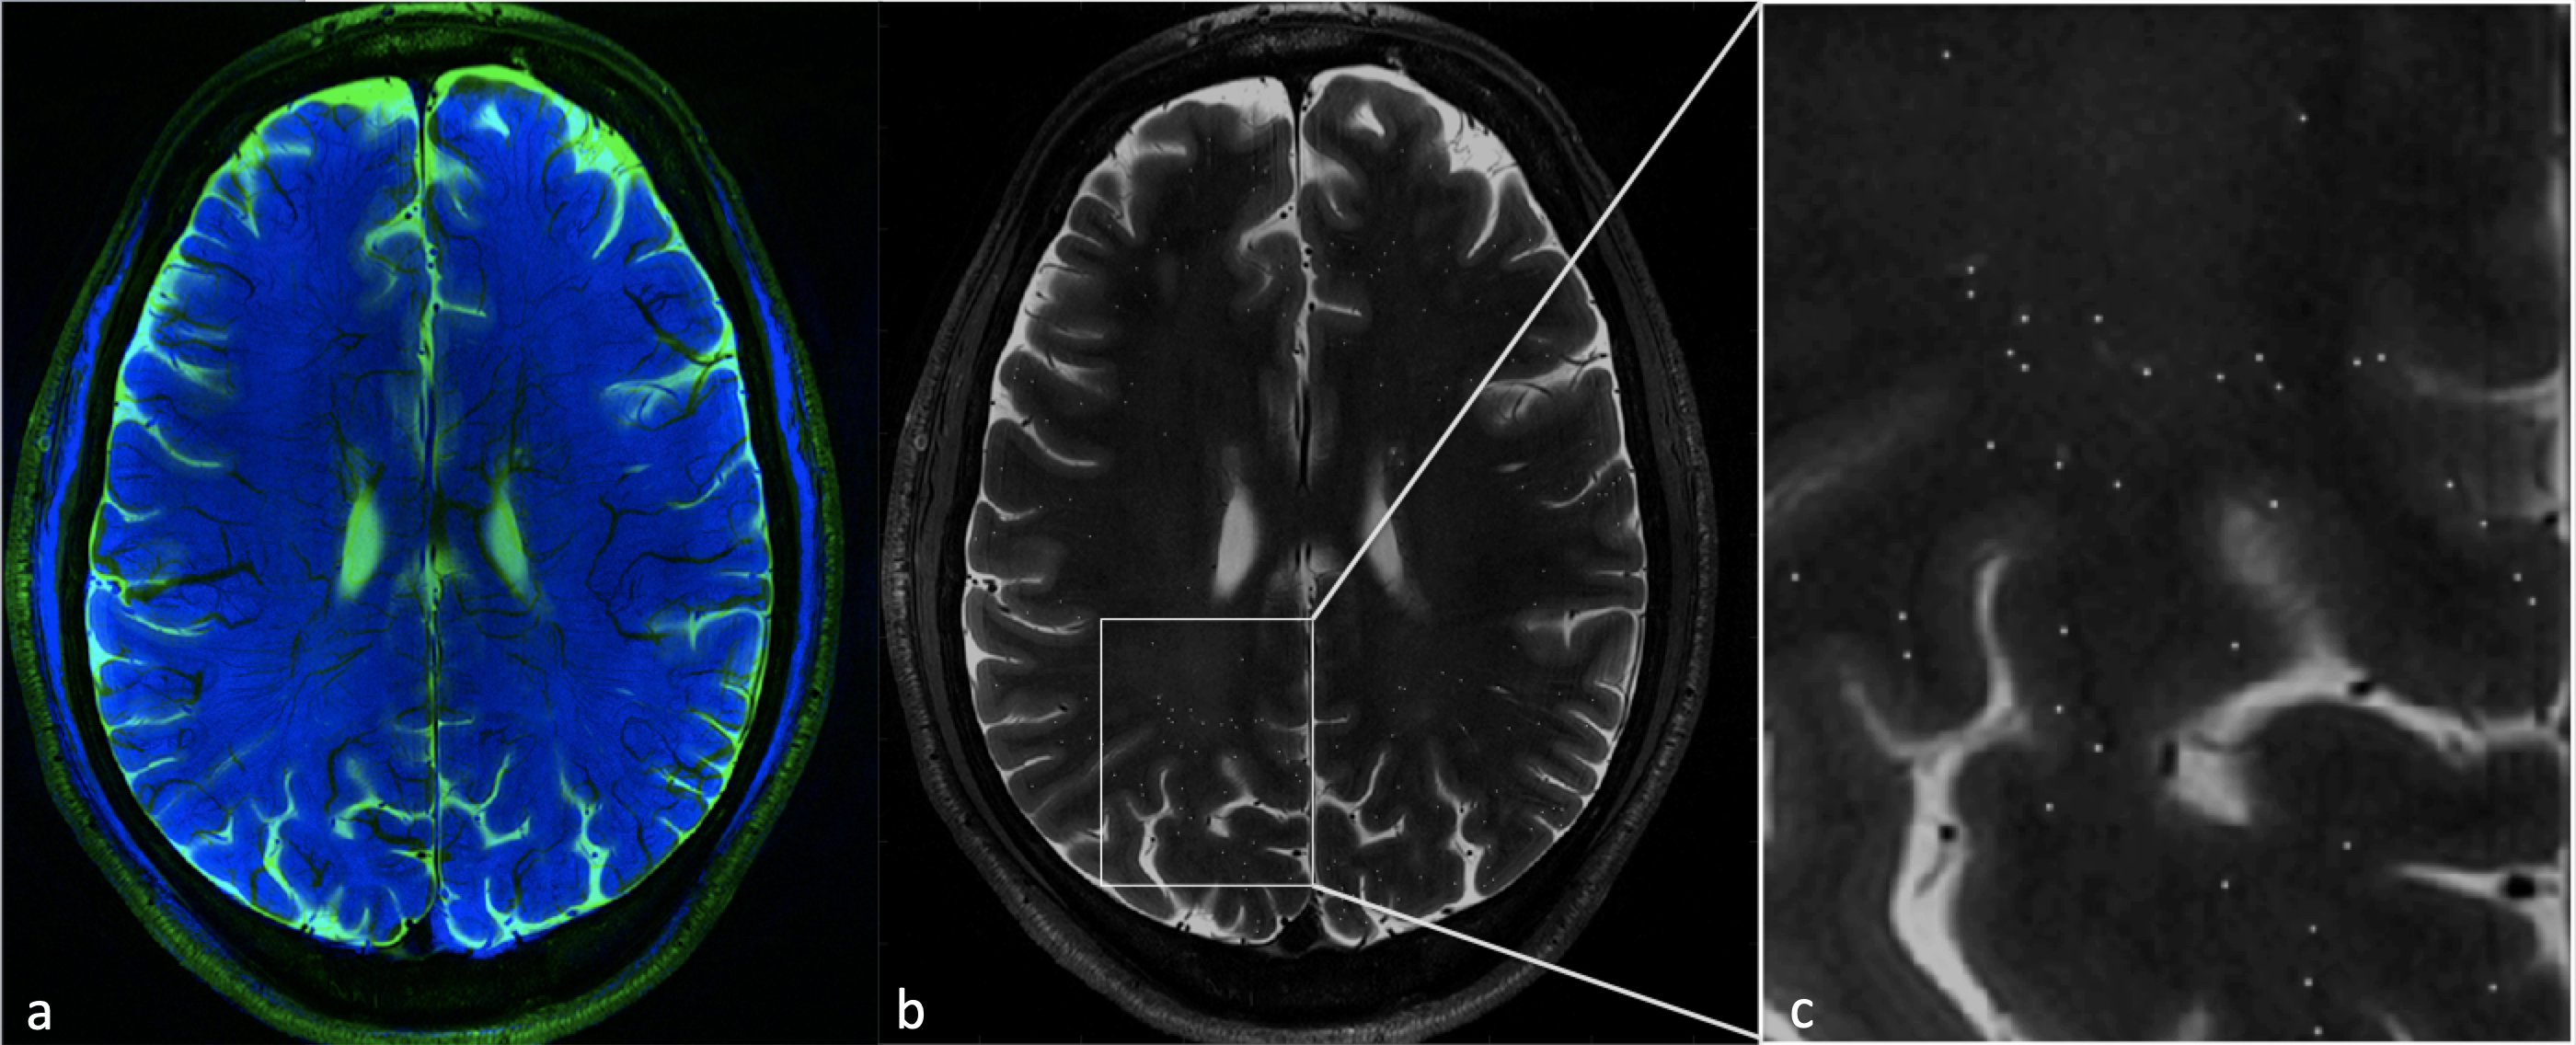
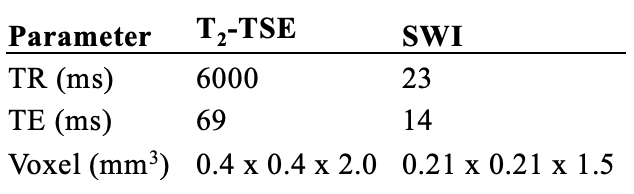
T2-TSE and susceptibility-weighted images (SWI) were acquired at 7 Tesla for three RRMS patients and three age-matched HCs. The RRMS patient and HC cohorts were each comprised of two males and one female; mean age was 35 ± 1 year for both groups. PVSs residing in the white matter of all subjects were manually marked on OsiriX version 9.0.2 (Pixmeo, Switzerland). PVSs were thresholded at >0.5 mm to account for partial volume averaging, and inter-reader reliability was confirmed. SWI images were processed with a Hessian filter using an 18-connected neighborhood to identify venous structures.14 PVS markings were coregistered with corresponding SWI data using custom-built software in MATLAB (Mathworks, Inc, USA). See Table 1 for key sequence parameters. Vein-coincident PVSs were counted as perivenular perivascular spaces (pPVS), and the percentage of pPVSs relative to the total number of PVSs was calculated. The mean percentage of pPVSs and standard deviation were calculated for healthy controls and RRMS patients. Groups were compared using Mood’s median test. For any subject marked by both raters, an average of the percentage of pPVSs was taken.Results/Discussion
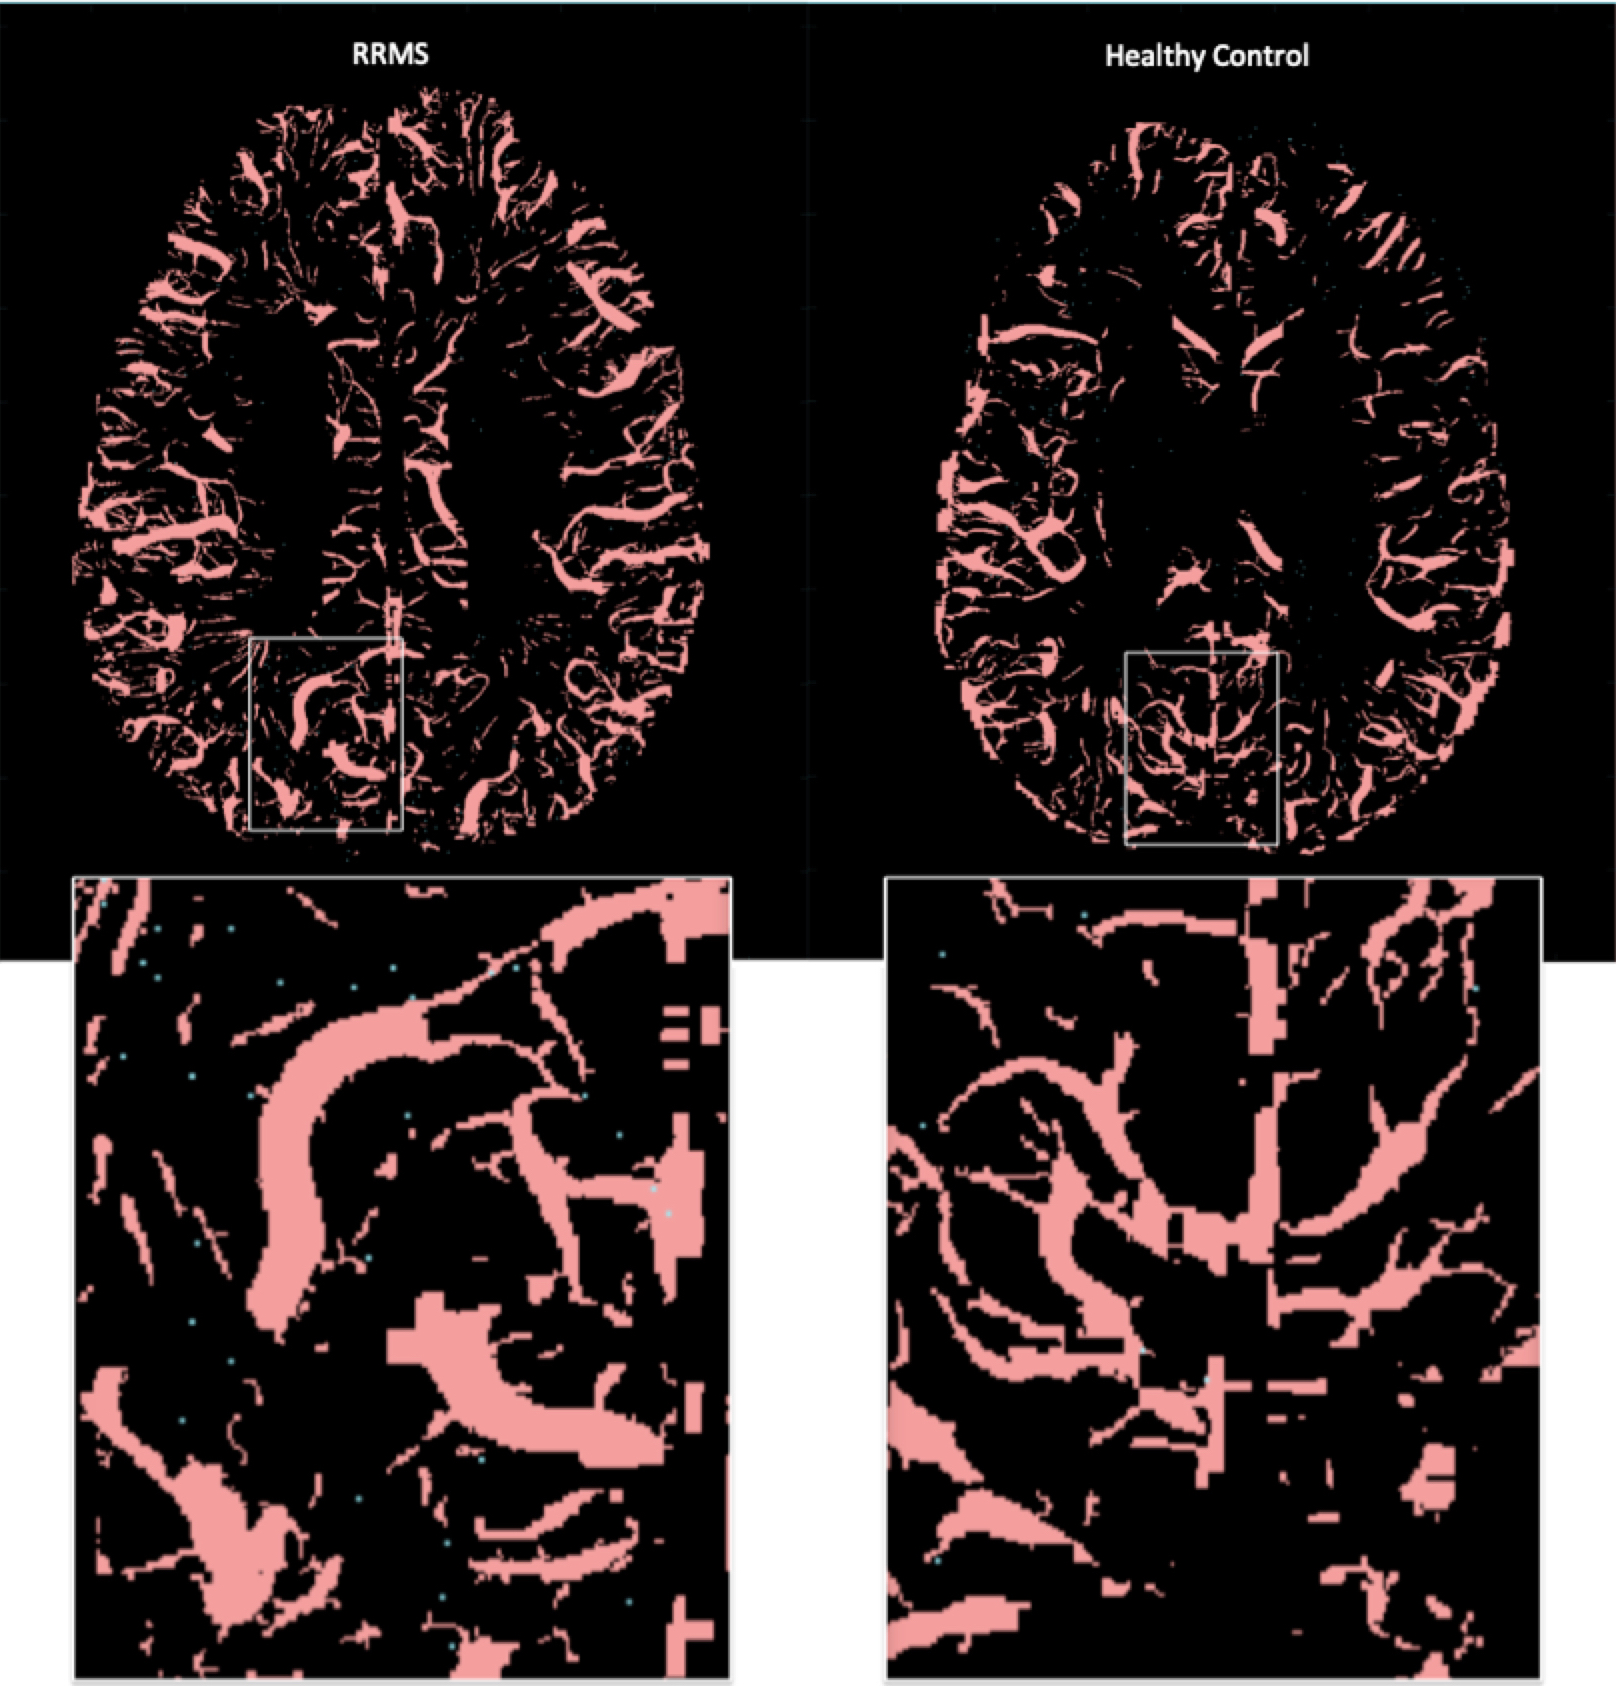
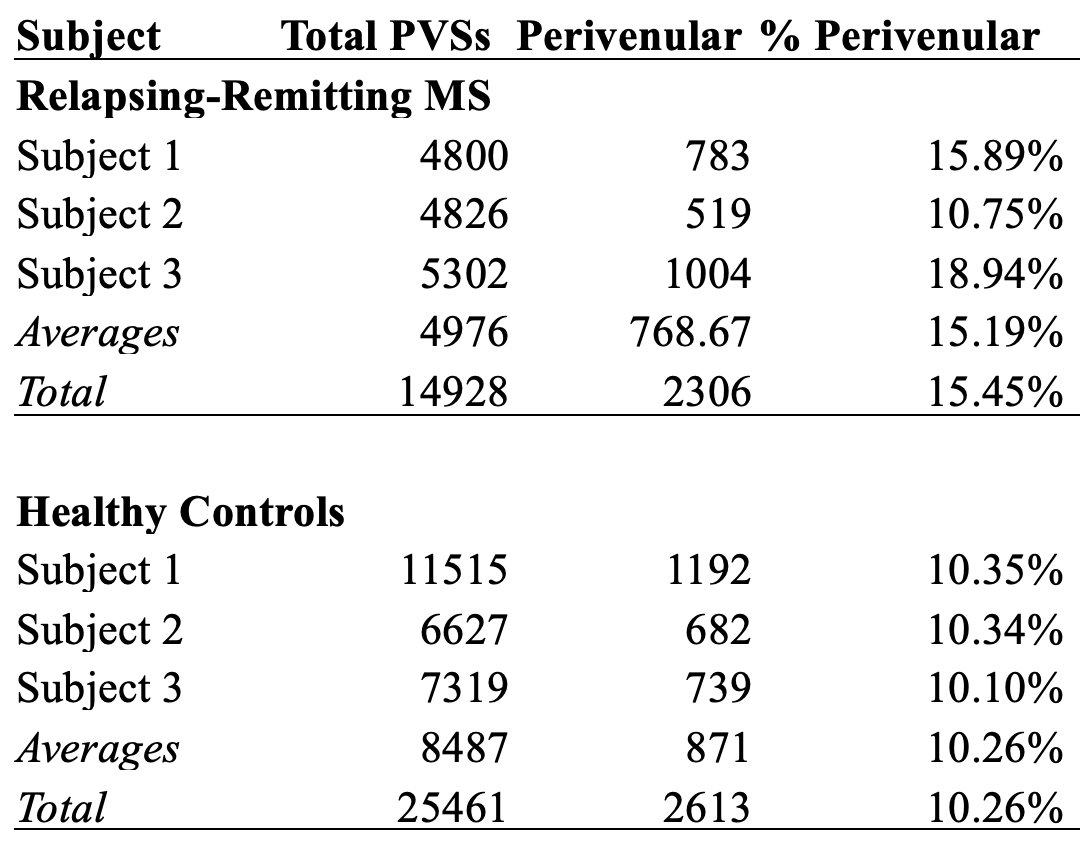
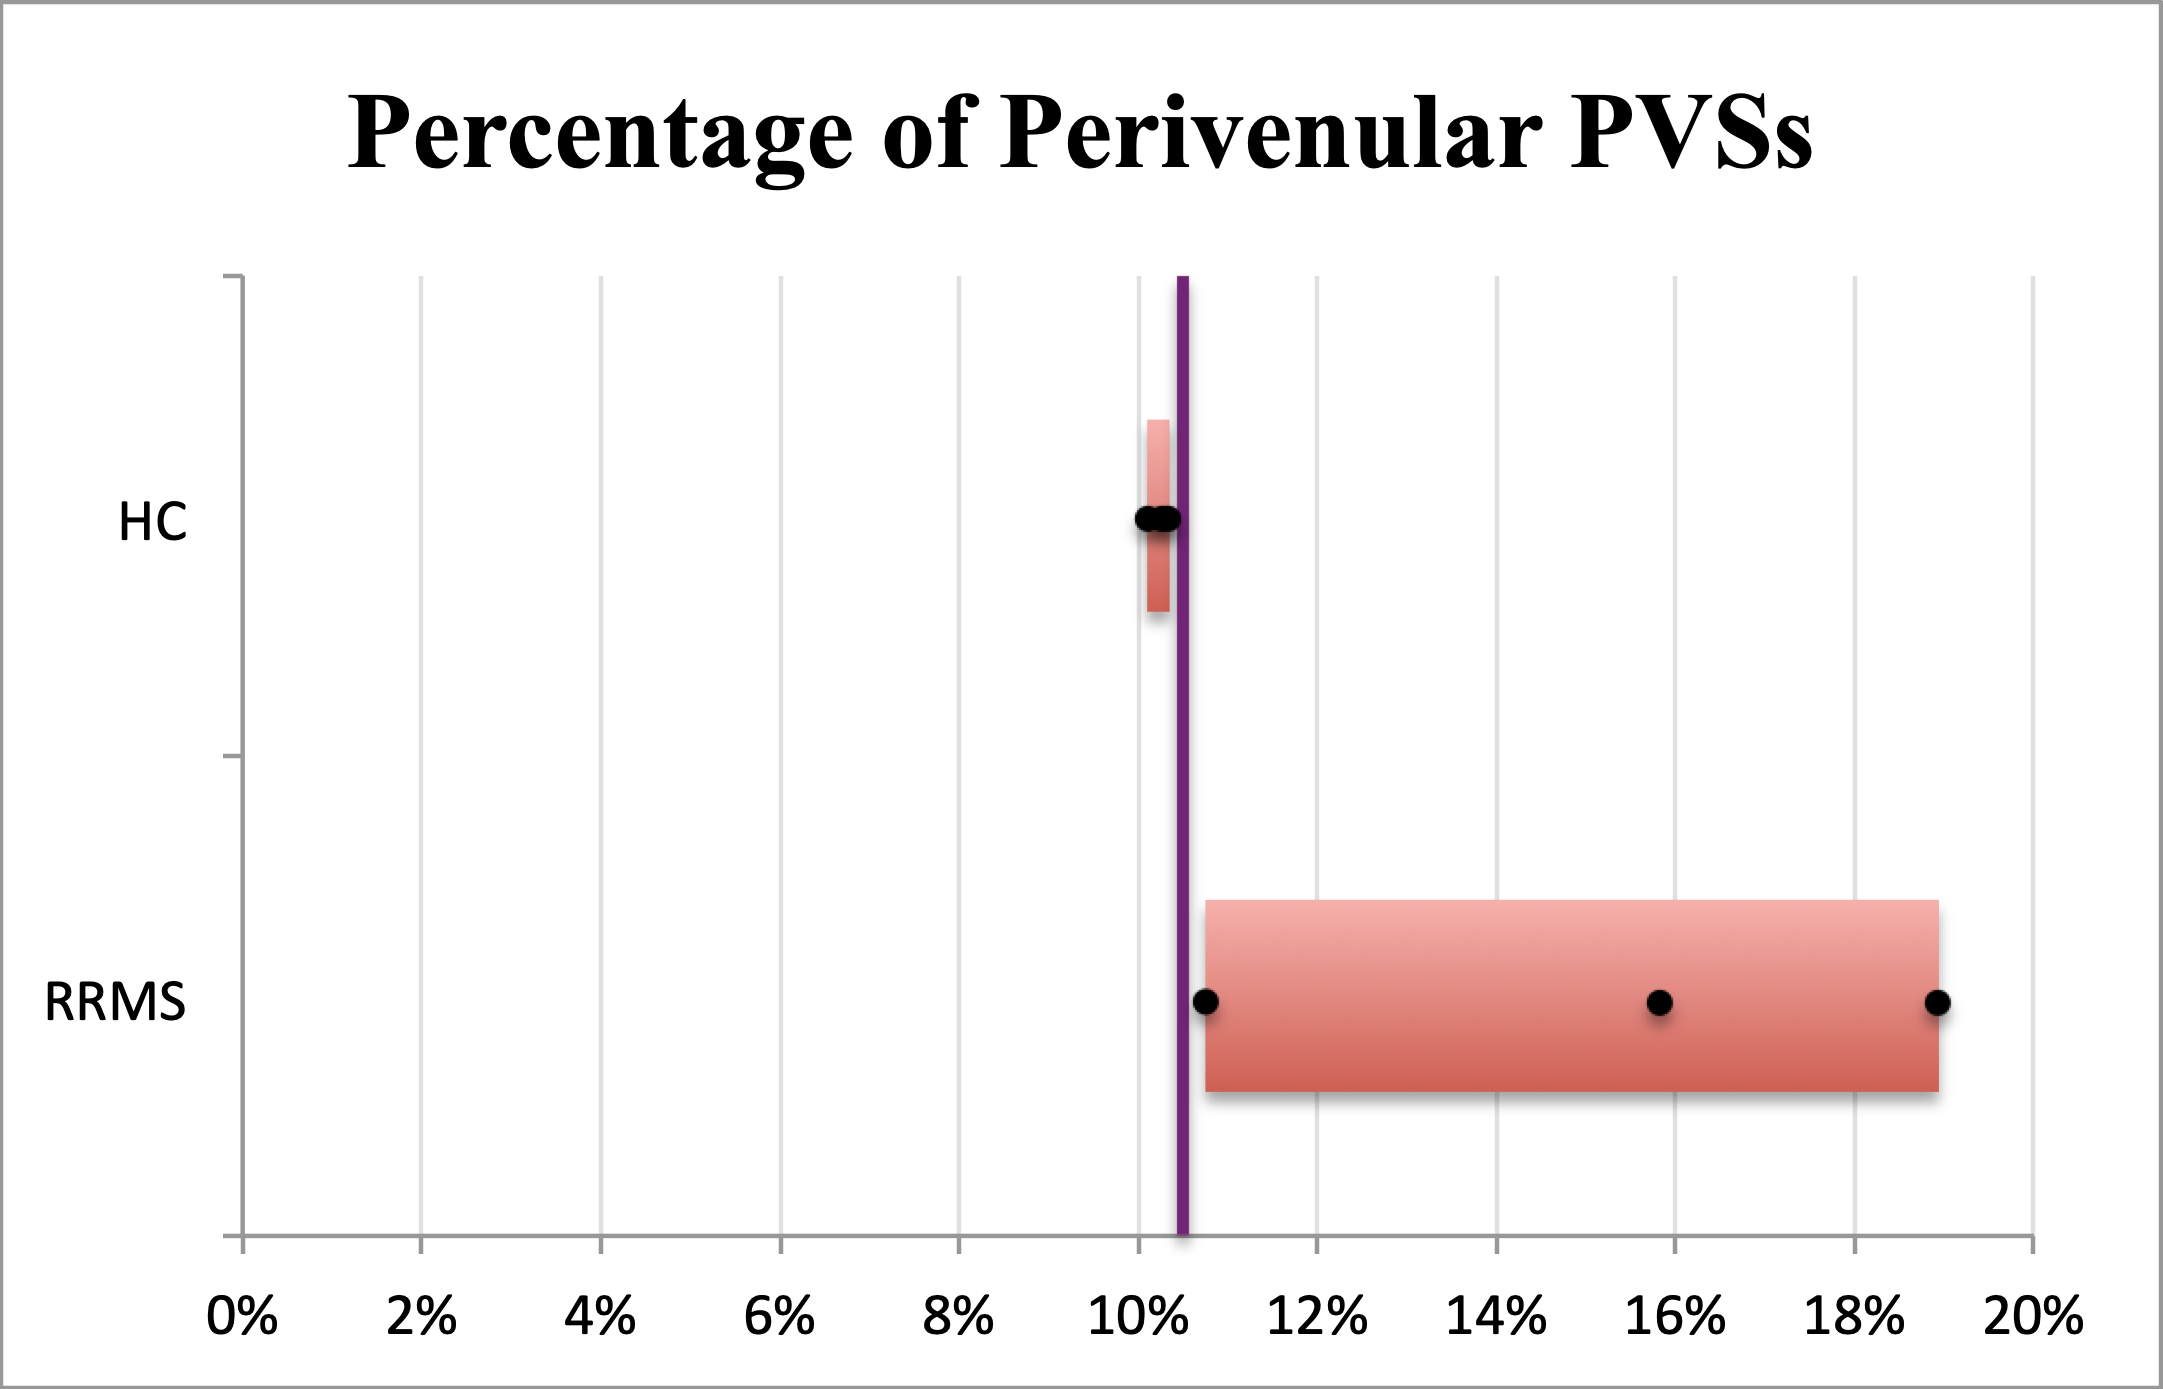
40,389 PVSs were manually marked across all six subjects, including 14,928 (36.96%) PVSs in RRMS patients and 25,461 (63.04%) in HCs. The average number of PVSs detected in RRMS and HCs were 4,976 and 8,487, respectively. 4,919 pPVSs were marked, 46.87% of which resided in the white matter of RRMS patients. On average, 15.19% of PVSs coincided with veins in RRMS patients, while only 10.26% of PVSs were perivenular in HCs. All RRMS patients individually exhibited a higher percentage of pPVSs than did those in the healthy control group (P=0.014; see Table 2 for more details).
To the authors’ knowledge, the present study is the first to demonstrate an increase in the proportion of detectable pPVSs in RRMS patients when compared to HCs. While all vessels are bordered by perivascular spaces, an abundance of PVSs remain indiscernible on MRI unless distended as a consequence of inflammatory activity.10,15 Our findings suggest that pPVSs are expanded in RRMS patients, a process which may precede the onset of lesion formation around a central vein.13,16 Perivenular PVSs hold potential as a novel candidate imaging marker for MS diagnosis, disease activity, treatment efficacy, and perhaps even progressive disease. These differences were detected in a preliminary set of three patients and three controls, and we intend to apply an automated PVS detection algorithm to a larger cohort in order to fully validate this novel candidate biomarker. Although clinical applications of 7T ultra-high-field imaging are expanding, the translation of this technique to 3T as a low-field biomarker is an area of active investigation within our group.
Conclusions
Our results indicate that there is a larger proportion of detectable perivenular PVSs in RRMS patients than in HCs. Areas of future study include the characterization of anatomical differences between perivenular and non-perivenular PVSs, and exploration of the utility of pPVSs as a candidate imaging marker for MS diagnosis, disease activity, response to treatment, and the presence of or predisposition to progressive disease.Acknowledgements
NIH R00 NS070821, NIH R01 MH109544, Icahn School of Medicine Capital Campaign, and the Translational and Molecular Imaging Institute.
References
1. Hersh CF, RJ. Multiple Sclerosis. Disease Management 2018; http://www.clevelandclinicmeded.com/medicalpubs/diseasemanagement/neurology/multiple_sclerosis/ - bib5. Accessed 10/31/2018, 2018.
2. Dutta R, Trapp BD. Mechanisms of neuronal dysfunction and degeneration in multiple sclerosis. Prog Neurobiol. 2011;93(1):1-12.
3. Magnetic Resonance Imaging. 2018; https://www.nationalmssociety.org/Symptoms-Diagnosis/Diagnosing-Tools/MRI - section-5, 2018.
4. Frischer JM, Weigand SD, Guo Y, et al. Clinical and pathological insights into the dynamic nature of the white matter multiple sclerosis plaque. Ann Neurol. 2015;78(5):710-721.
5. Reich DS, Lucchinetti CF, Calabresi PA. Multiple Sclerosis. N Engl J Med. 2018;378(2):169-180.
6. Song J, Wu C, Korpos E, et al. Focal MMP-2 and MMP-9 activity at the blood-brain barrier promotes chemokine-induced leukocyte migration. Cell Rep. 2015;10(7):1040-1054.
7. Agrawal S, Anderson P, Durbeej M, et al. Dystroglycan is selectively cleaved at the parenchymal basement membrane at sites of leukocyte extravasation in experimental autoimmune encephalomyelitis. J Exp Med. 2006;203(4):1007-1019.
8. Cavallari M, Egorova S, Healy BC, et al. Evaluating the Association between Enlarged Perivascular Spaces and Disease Worsening in Multiple Sclerosis. J Neuroimaging. 2018;28(3):273-277.
9. Etemadifar M, Hekmatnia A, Tayari N, et al. Features of Virchow-Robin spaces in newly diagnosed multiple sclerosis patients. Eur J Radiol. 2011;80(2):e104-108.
10. Wuerfel J, Haertle M, Waiczies H, et al. Perivascular spaces--MRI marker of inflammatory activity in the brain? Brain.2008;131(Pt 9):2332-2340.
11. Conforti R, Cirillo M, Sardaro A, et al. Dilated perivascular spaces and fatigue: is there a link? Magnetic resonance retrospective 3Tesla study. Neuroradiology. 2016;58(9):859-866.
12. Conforti R, Cirillo M, Saturnino PP, et al. Dilated Virchow-Robin spaces and multiple sclerosis: 3 T magnetic resonance study. Radiol Med. 2014;119(6):408-414.
13. Ge Y, Law M, Herbert J, Grossman RI. Prominent perivenular spaces in multiple sclerosis as a sign of perivascular inflammation in primary demyelination. AJNR Am J Neuroradiol. 2005;26(9):2316-2319.
14. Feldman RR, AL; Marcuse, LV; Rutland, JW; Fields, MC; Delman, BN; Balchandani, P. Quanti. International Society for Magnetic Resonance in Medicine 2018 Annual Meeting. 2018.
15. Ding J, Sigurethsson S, Jonsson PV, et al. Large Perivascular Spaces Visible on Magnetic Resonance Imaging, Cerebral Small Vessel Disease Progression, and Risk of Dementia: The Age, Gene/Environment Susceptibility-Reykjavik Study. JAMA Neurol. 2017;74(9):1105-1112.
16. Sati P, Oh J, Constable RT, et al. The central vein sign and its clinical evaluation for the diagnosis of multiple sclerosis: a consensus statement from the North American Imaging in Multiple Sclerosis Cooperative. Nat Rev Neurol. 2016;12(12):714-722.
Figures