2813
7T MRS of neurometabolites and associations with cognitive deficits in mild cognitive impairment1Russell H. Morgan Department of Radiology and Radiological Science, The Johns Hopkins University School of Medicine, Baltimore, MD, United States, 2F. M. Kirby Research Center for Functional Brain Imaging, Kennedy Krieger Institute, Baltimore, MD, United States, 3Neuroimaging Research Program, Maryland Psychiatric Research Center, Department of Psychiatry, University of Maryland School of Medicine, Baltimore, MD, United States, 4Department of Psychiatry and Behavioral Sciences, The Johns Hopkins University School of Medicine, Baltimore, MD, United States
Synopsis
Mild cognitive impairment (MCI) is associated with increased risk of developing Alzheimer’s Disease (AD). Here, levels of multiple brain metabolites in healthy controls and MCI patients using 7T magnetic resonance spectroscopy in the anterior (ACC) and posterior (PCC) cingulate cortex were studied. MCI patients showed decreased GABA/tCr (ACC, PCC), Glu/tCr (PCC), NAA/tCr (PCC), and increased mI/tCr (ACC). Worse episodic verbal memory performance correlated with lower Glu/tCr (PCC), lower NAA/tCr (PCC), and higher mI/tCr (ACC, PCC). Worse verbal fluency performance correlated with lower GSH/tCr (PCC). In summary, MCI is associated with decreased GABA and glutamate, most consistently in the PCC.
Introduction
Alzheimer’s disease (AD) is the most common neurodegenerative disease, with potentially devastating consequences for healthcare systems and societies1–3. The pathophysiology of AD and its early stages such as mild cognitive impairment (MCI) is not fully understood, but is thought to involve protein deposition, oxidative stress and mitochondrial dysfunction, which may lead to disruptions in neurotransmitter systems causing cognitive decline. Magnetic resonance spectroscopy (MRS) at 7T permits the assessment of biochemically important molecules, including the neurotransmitters GABA and glutamate (Glu), the antioxidant glutathione (GSH), the neuromodulator N-acetylaspartylglutamate (NAAG), the neuronal marker N-acetylaspartate (NAA) and the osmolyte and glial marker myo-inositol (mI).Methods
13 healthy controls (HC, 7F, 63.6 ± 7.8 y) and 13 MCI patients (3F; 69.6 ± 7.7 y) were enrolled. All participants underwent a structured clinical interview by a clinical psychologist (SCID)4, Clinical Dementia Rating (CDR)5, Mini-Mental State Examination (MMSE)6, the letter fluency test included in the Delis-Kaplan Executive Function System (D-KEFS) test7, and the California Verbal Learning Test (CVLT)8.
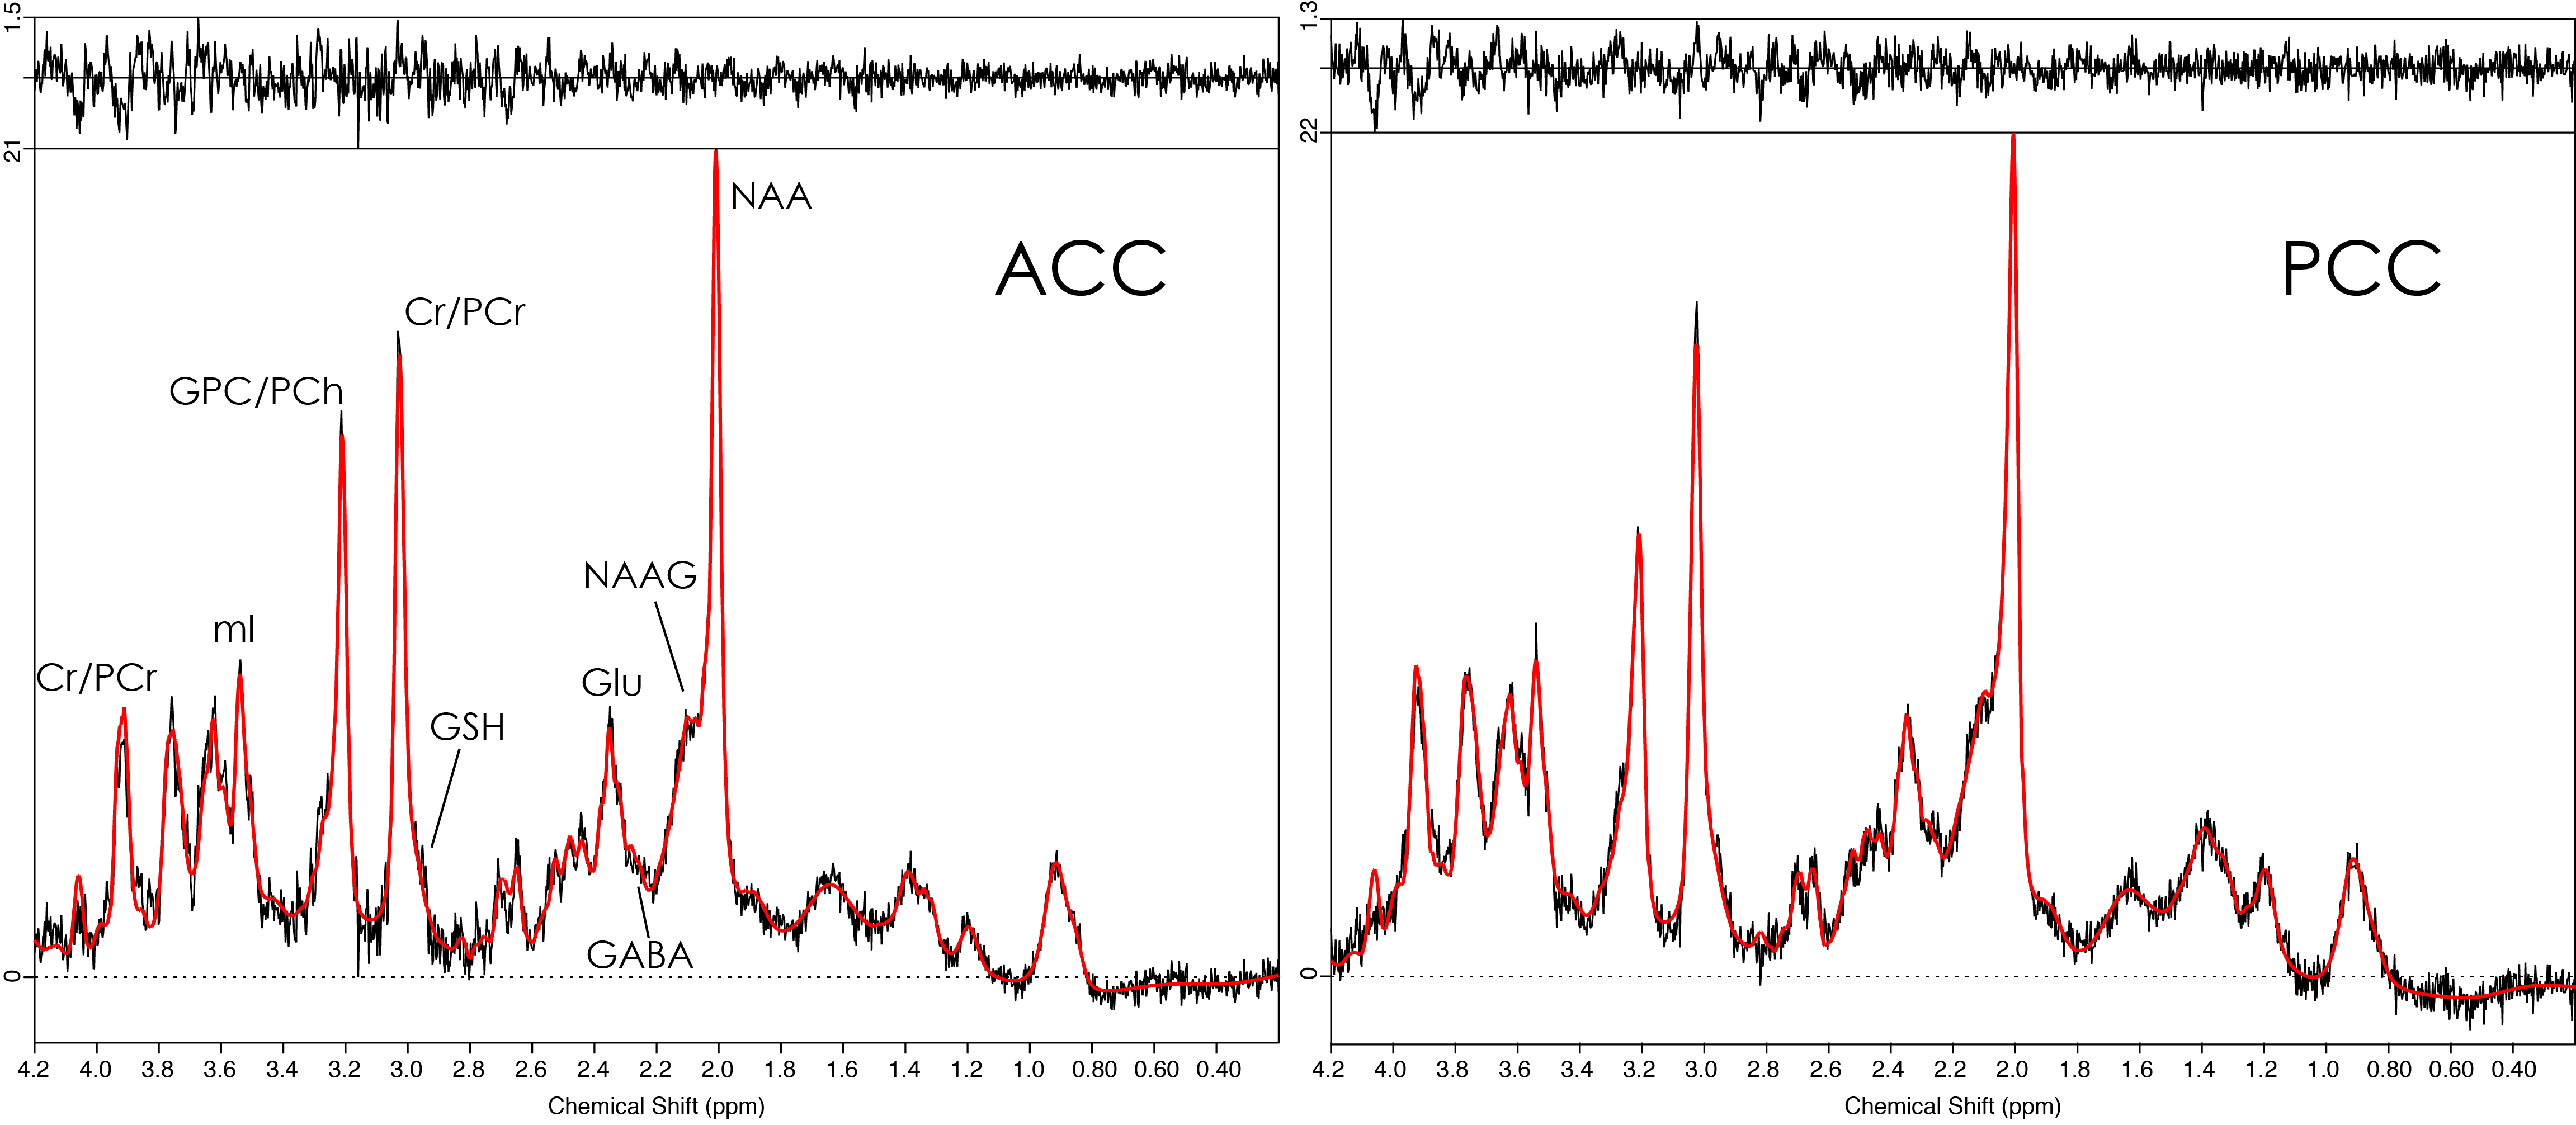
All MR data were acquired on a 7T Philips Achieva scanner with a 32-channel head coil. MRS voxels (28 × 16 × 20 mm3) were prescribed in a T1-weighted MP-RAGE image (0.96 mm isotropic) in the anterior (ACC) and posterior cingulate cortex (PCC, Fig. 1) to acquire STEAM data (TE ~14 ms (ACC/PCC); TR 3000 ms; 96 averages; VAPOR9 water suppression; 4 water reference averages). MRS data were analyzed with LCModel10,11. Metabolite levels (estimated relative to total creatine, tCr) of GABA, Glu, GSH, NAA, NAAG, and mI were included in statistical analyses. Voxels were co-registered to the structural images to determine tissue composition (GM/WM/CSF), based on SPM12 segmentation.
For each metabolite, a two-way ANCOVA was performed with metabolite levels as dependent variables, and subject group and brain region as independent variables. Post-hoc pairwise Tukey-adjusted comparisons between HC and MCI groups were performed to investigate effects of group. Relationships between metabolite levels and cognitive scores were assessed with linear regression analyses. For all tests, age was included as a covariate, and the single-test α-level was 0.05.
Results
Representative spectra and LCModel fits for ACC and PCC are shown in Fig. 2, indicating good SNR and low linewidth.
Group comparisons between the HC and MCI groups revealed significant differences in metabolite-to-tCr ratios (Table 1). MCI patients had significantly lower levels of GABA/tCr (ACC and PCC, p < 0.01 each), Glu/tCr (PCC, p < 0.05) and NAA/tCr (PCC, p < 0.05), and significantly higher levels of mI/tCr (ACC, p < 0.01).
MMSE scores were negatively correlated with mI/tCr in the ACC (p < 0.01) and the PCC (p < 0.05). D-KEFS scores were positively correlated with GSH/tCr in the PCC (p < 0.01). CVLT scores were positively correlated with Glu/tCr (PCC, p < 0.05) and NAA/tCr (PCC, p < 0.05), and negatively correlated with mI/tCr (ACC and PCC, p < 0.05 each) (Table 2).
Discussion
A key finding of this study is a reduction of ~16% in both ACC and PCC GABA/tCr levels in MCI patients. Decreased posterior GABA levels are in line with previous studies of MCI and AD patients12,13. Our finding of decreased GABA in ACC suggests that disturbed GABA homeostasis in MCI may also occur more extensively, with potential impact on cognitive function.
Reduced PCC Glu levels and their correlation with CVLT scores may suggest that disturbed Glu neurotransmission is at least partly contributing to memory impairment in MCI. The results are in line with reports of reduced PCC Glu/Glx levels in MCI14,15 and AD16.
Links between decreased prefrontal GSH and cognitive scores17, and associations between decreased temporal and parietal GSH levels and local PiB uptake measures have previously been found18. Together with these findings, our results may indicate links between oxidative stress, amyloidosis, and cognitive decline.
Decreased NAA and increased mI in MCI/AD have been long established19,20. It is notable that mI was the only metabolite to be associated with the MMSE score in this study, suggesting that it may serve as a functionally unspecific indicator of disease severity.
Conclusion
Results of this 7T MRS study revealed several region-specific effects of MCI on brain metabolite levels. Interactions between metabolite levels and cognitive scores were observed for specific brain regions. This suggests that key mechanisms in MCI/AD pathophysiology, such as oxidative stress and disturbed neurotransmission, may contribute to cognitive deficits in a region- and function-specific manner.Acknowledgements
This work was supported by National Institute of Health grants 2P50AG005146, AG038893, AG041633, UL1 TR 001079, and P41EB015909. RAEE and GO received salary support from R01EB016089, R01EB023963, R01MH106564, and R21MH098228.References
1. Reitz C, Brayne C, Mayeux R. Epidemiology of Alzheimer disease. Nat Rev Neurol. 2011;7(3):137-152. doi:10.1038/nrneurol.2011.2.
2. Brookmeyer R, Johnson E, Ziegler-Graham K, Arrighi HM. Forecasting the global burden of Alzheimer’s disease. Alzheimer’s Dement. 2007;3(3):186-191. doi:10.1016/j.jalz.2007.04.381.
3. Alzheimer's Association. 2015 Alzheimer’s disease facts and figures. Alzheimer’s Dement. 2015;11(3):332-384. doi:10.1016/J.JALZ.2015.02.003.
4. First M, Gibbon M, Spitzer R, Benjamin L. User’s guide for the structured clinical interview for DSM-IV axis II personality disorders: SCID-II. 1997.
5. Morris J. The Clinical Dementia Rating (CDR): current version and scoring rules. Neurology. 1993. http://psycnet.apa.org/psycinfo/1994-19989-001.
6. Folstein MF, Folstein SE, McHugh PR. “Mini-mental state”. A practical method for grading the cognitive state of patients for the clinician. J Psychiatr Res. 1975;12(3):189-198. doi:10.1016/0022-3956(75)90026-6.
7. Delis DC, Kaplan E, Kramer JH. Delis-Kaplan Executive Function System®(D-KEFS®): Examiner’s Manual: Flexibility of Thinking, Concept Formation, Problem Solving, Planning, Creativity, Impluse Control, Inhibition. Pearson; 2001.
8. Delis DC, Kramer JH, Kaplan E, Ober BA. CVLT-II: California Verbal Learning Test: Adult Version. Psychological Corporation; 2000.
9. Tkac I, Starcuk Z, Choi IY, Gruetter R. In vivo 1H NMR spectroscopy of rat brain at 1 ms echo time. Magn Reson Med. 1999;41(4):649-656. doi:10.1002/(SICI)1522-2594(199904)41:4<649::AID-MRM2>3.0.CO;2-G [pii].
10. Provencher SW. Estimation of metabolite concentrations from localized in vivo proton NMR spectra. Magn Reson Med. 1993;30(6):672-679.
11. Provencher SW. Automatic quantitation of localized in vivo 1H spectra with LCModel. NMR Biomed. 2001;14(4):260-264.
12. Riese F, Gietl A, Zölch N, et al. Posterior cingulate γ-aminobutyric acid and glutamate/glutamine are reduced in amnestic mild cognitive impairment and are unrelated to amyloid deposition and apolipoprotein E genotype. Neurobiol Aging. 2015;36(1):53-59. doi:10.1016/j.neurobiolaging.2014.07.030.
13. Bai X, Edden RA, Gao F, et al. Decreased gamma-aminobutyric acid levels in the parietal region of patients with Alzheimer’s disease. J Magn Reson Imaging. 2014. doi:10.1002/jmri.24665.
14. Zeydan B, Deelchand DK, Tosakulwong N, et al. Decreased Glutamate Levels in Patients with Amnestic Mild Cognitive Impairment: An sLASER Proton MR Spectroscopy and PiB-PET Study. J Neuroimaging. June 2017. doi:10.1111/jon.12454.
15. Hattori N, Abe K, Sakoda S, Sawada T. Proton MR spectroscopic study at 3 Tesla on glutamate/glutamine in Alzheimer’s disease. Neuroreport. 2002;13(1):183-186. doi:10.1097/00001756-200201210-00041.
16. Fayed N, Modrego PJ, Rojas-Salinas G, Aguilar K. Brain Glutamate Levels Are Decreased in Alzheimer’s Disease. Am J Alzheimer’s Dis Other Dementiasr. 2011;26(6):450-456. doi:10.1177/1533317511421780.
17. Mandal PK, Saharan S, Tripathi M, Murari G. Brain Glutathione Levels – A Novel Biomarker for Mild Cognitive Impairment and Alzheimer’s Disease. Biol Psychiatry. 2015;78(10):702-710. doi:10.1016/J.BIOPSYCH.2015.04.005.
18. Chiang GC, Mao X, Kang G, et al. Relationships among cortical glutathione levels, brain amyloidosis, and memory in healthy older adults investigated in vivo with 1H-MRS and Pittsburgh compound-B PET. Am J Neuroradiol. 2017;38(6):1130-1137. doi:10.3174/ajnr.A5143.
19. Gao F, Barker PB. Various MRS Application Tools for Alzheimer Disease and Mild Cognitive Impairment. Am J Neuroradiol. 2014;35(6 suppl). http://www.ajnr.org/content/35/6_suppl/S4.long.
20. Waragai M, Moriya M, Nojo T. Decreased N-Acetyl Aspartate/Myo-Inositol Ratio in the Posterior Cingulate Cortex Shown by Magnetic Resonance Spectroscopy May Be One of the Risk Markers of Preclinical Alzheimer’s Disease: A 7-Year Follow-Up Study. J Alzheimers Dis. 2017;60(4):1411-1427. doi:10.3233/JAD-170450.
Figures