2812
Inter-site, inter-subject and inter-session variability of B1+ and B0 in the human brain at 7 tesla.1Wellcome Centre for Integrative Neuroimaging, FMRIB, NDCN, University of Oxford, Oxford, United Kingdom, 2Sir Peter Mansfield Imaging Centre, School of Physics and Astronomy, University of Nottingham, Nottingham, United Kingdom, 3Cardiff University Brain Research Imaging Centre, School of Psychology, Cardiff University, Cardiff, United Kingdom, 4Wolfson Brain Imaging Centre, Department of Clinical Neurosciences, University of Cambridge, Cambridge, United Kingdom, 5Imaging Centre of Excellence, University of Glasgow, Glasgow, United Kingdom
Synopsis
At ultra-high field strengths, e.g. 7 tesla, the homogeneity of the transmit B1+-field and the B0-field decreases compared to lower fields. This can strongly affect the contrast in images especially when imaging large volumes, such as the whole brain.
In this work we measure the mean and variance of B1+- and B0-fields in whole brain images acquired on four, whole-body human 7T scanners. We demonstrate that inter-subject differences dominate over inter-site differences in explaining the observed B0- and B1+-field variability. Inter-session differences are not significant.
Introduction
At ultra-high field strengths, e.g. 7 tesla, the homogeneity of the transmit B1+-field and the B0-field decreases compared to lower fields. In addition, the dependence of the magnitude of the transmit B1+-field on the subject-specific coil-loading increases compared with lower field systems.1 Both these factors affect the ability of scanners to effectively homogenize and calibrate the fields to a desired target.2
The contrast of many pulse sequences depends on the local B1+- and B0-fields, so this degradation compared to operation at lower fields can reduce or completely remove contrast from images.3 This is apparent when imaging whole organs (e.g. the brain), which experience significant inhomogeneity of B1+ and B0 across their volume.4
In this work we measure the means and variances of B1+- and B0-fields in whole brain images acquired on four whole-body human 7T scanners in order to characterise contributions to their variability.
Methods
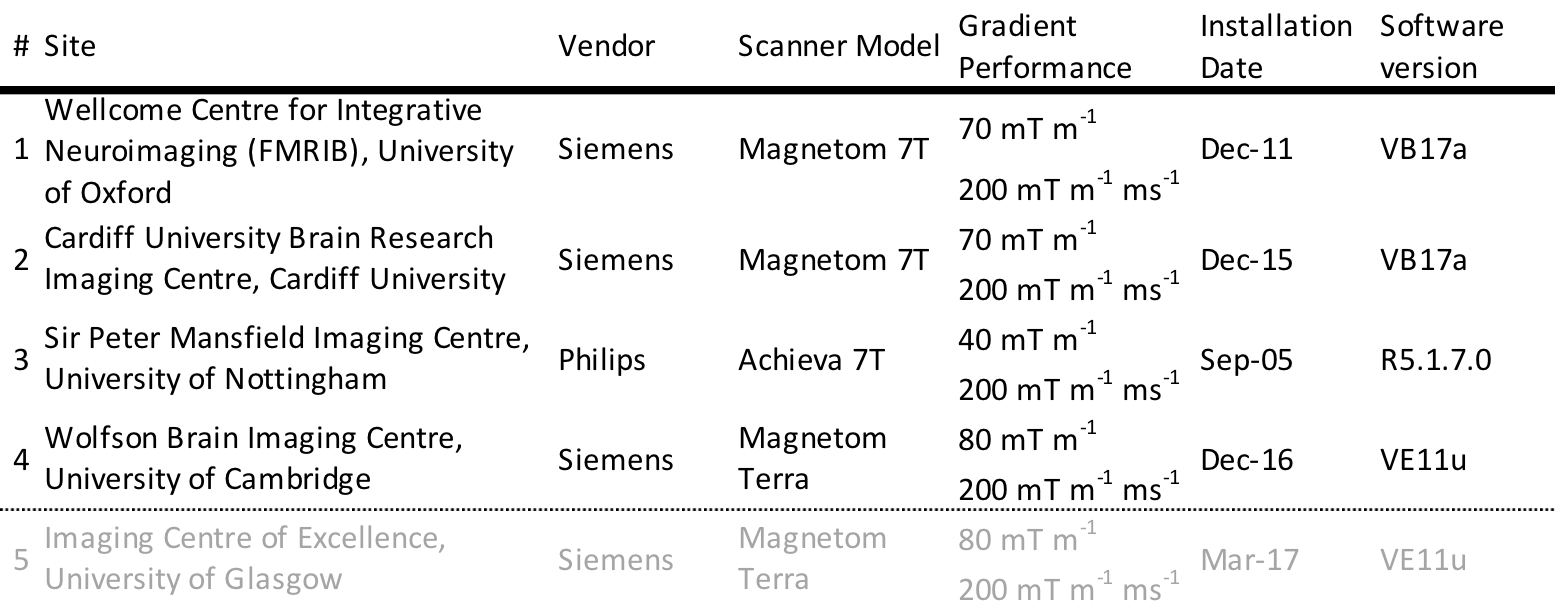
The data in this work was collected as part of the UK7T Network’s “Travelling Heads Study”.5 Ten subjects (7 male, 69.8±12.3 kg, 32.0±5.9 years) underwent structural and functional neuroimaging scans at the five 7T-capable UK sites. In this work a subset of this data from Sites 1-4 is used. Each subject was scanned at each site, and a further four times at their designated home site (nine scans in total per subject). The hardware specifications for each site are given in Table 1.
At each site, as part of the scanning protocol and after applying the vendor’s transmit calibration process, the transmit B1+-field was mapped using a 3D DREAM flip-angle mapping sequence.6,7 Subsequently, after applying the vendor’s own automatic B0 shimming process, the B0-field was mapped using a dual-echo GRE sequence.
The resulting flip-angle and B0-maps were masked by applying brain masks created by FSL BET from concurrently acquired MPRAGE images.8 The B1+-field values were normalized to the target value and are therefore expressed as a unitless ratio. The mean and standard deviation (SD) of the masked B1+- and B0-fields, and the per-subject and per-site field distributions were plotted in Matlab.
Analysis of variance (ANOVA) was carried out separately on the mean and SD of each measured field for 3 factors: site, subject and session (repeated home site scans).
When implementing the structural and anatomical scans in the travelling heads study, the B1+-field was recalibrated based on the mean value of the measured DREAM flip-angle map. This factor was reapplied to the DREAM maps in MATLAB to scale them to the final scan-time values, and the 3-way ANOVA analysis was repeated.
Results
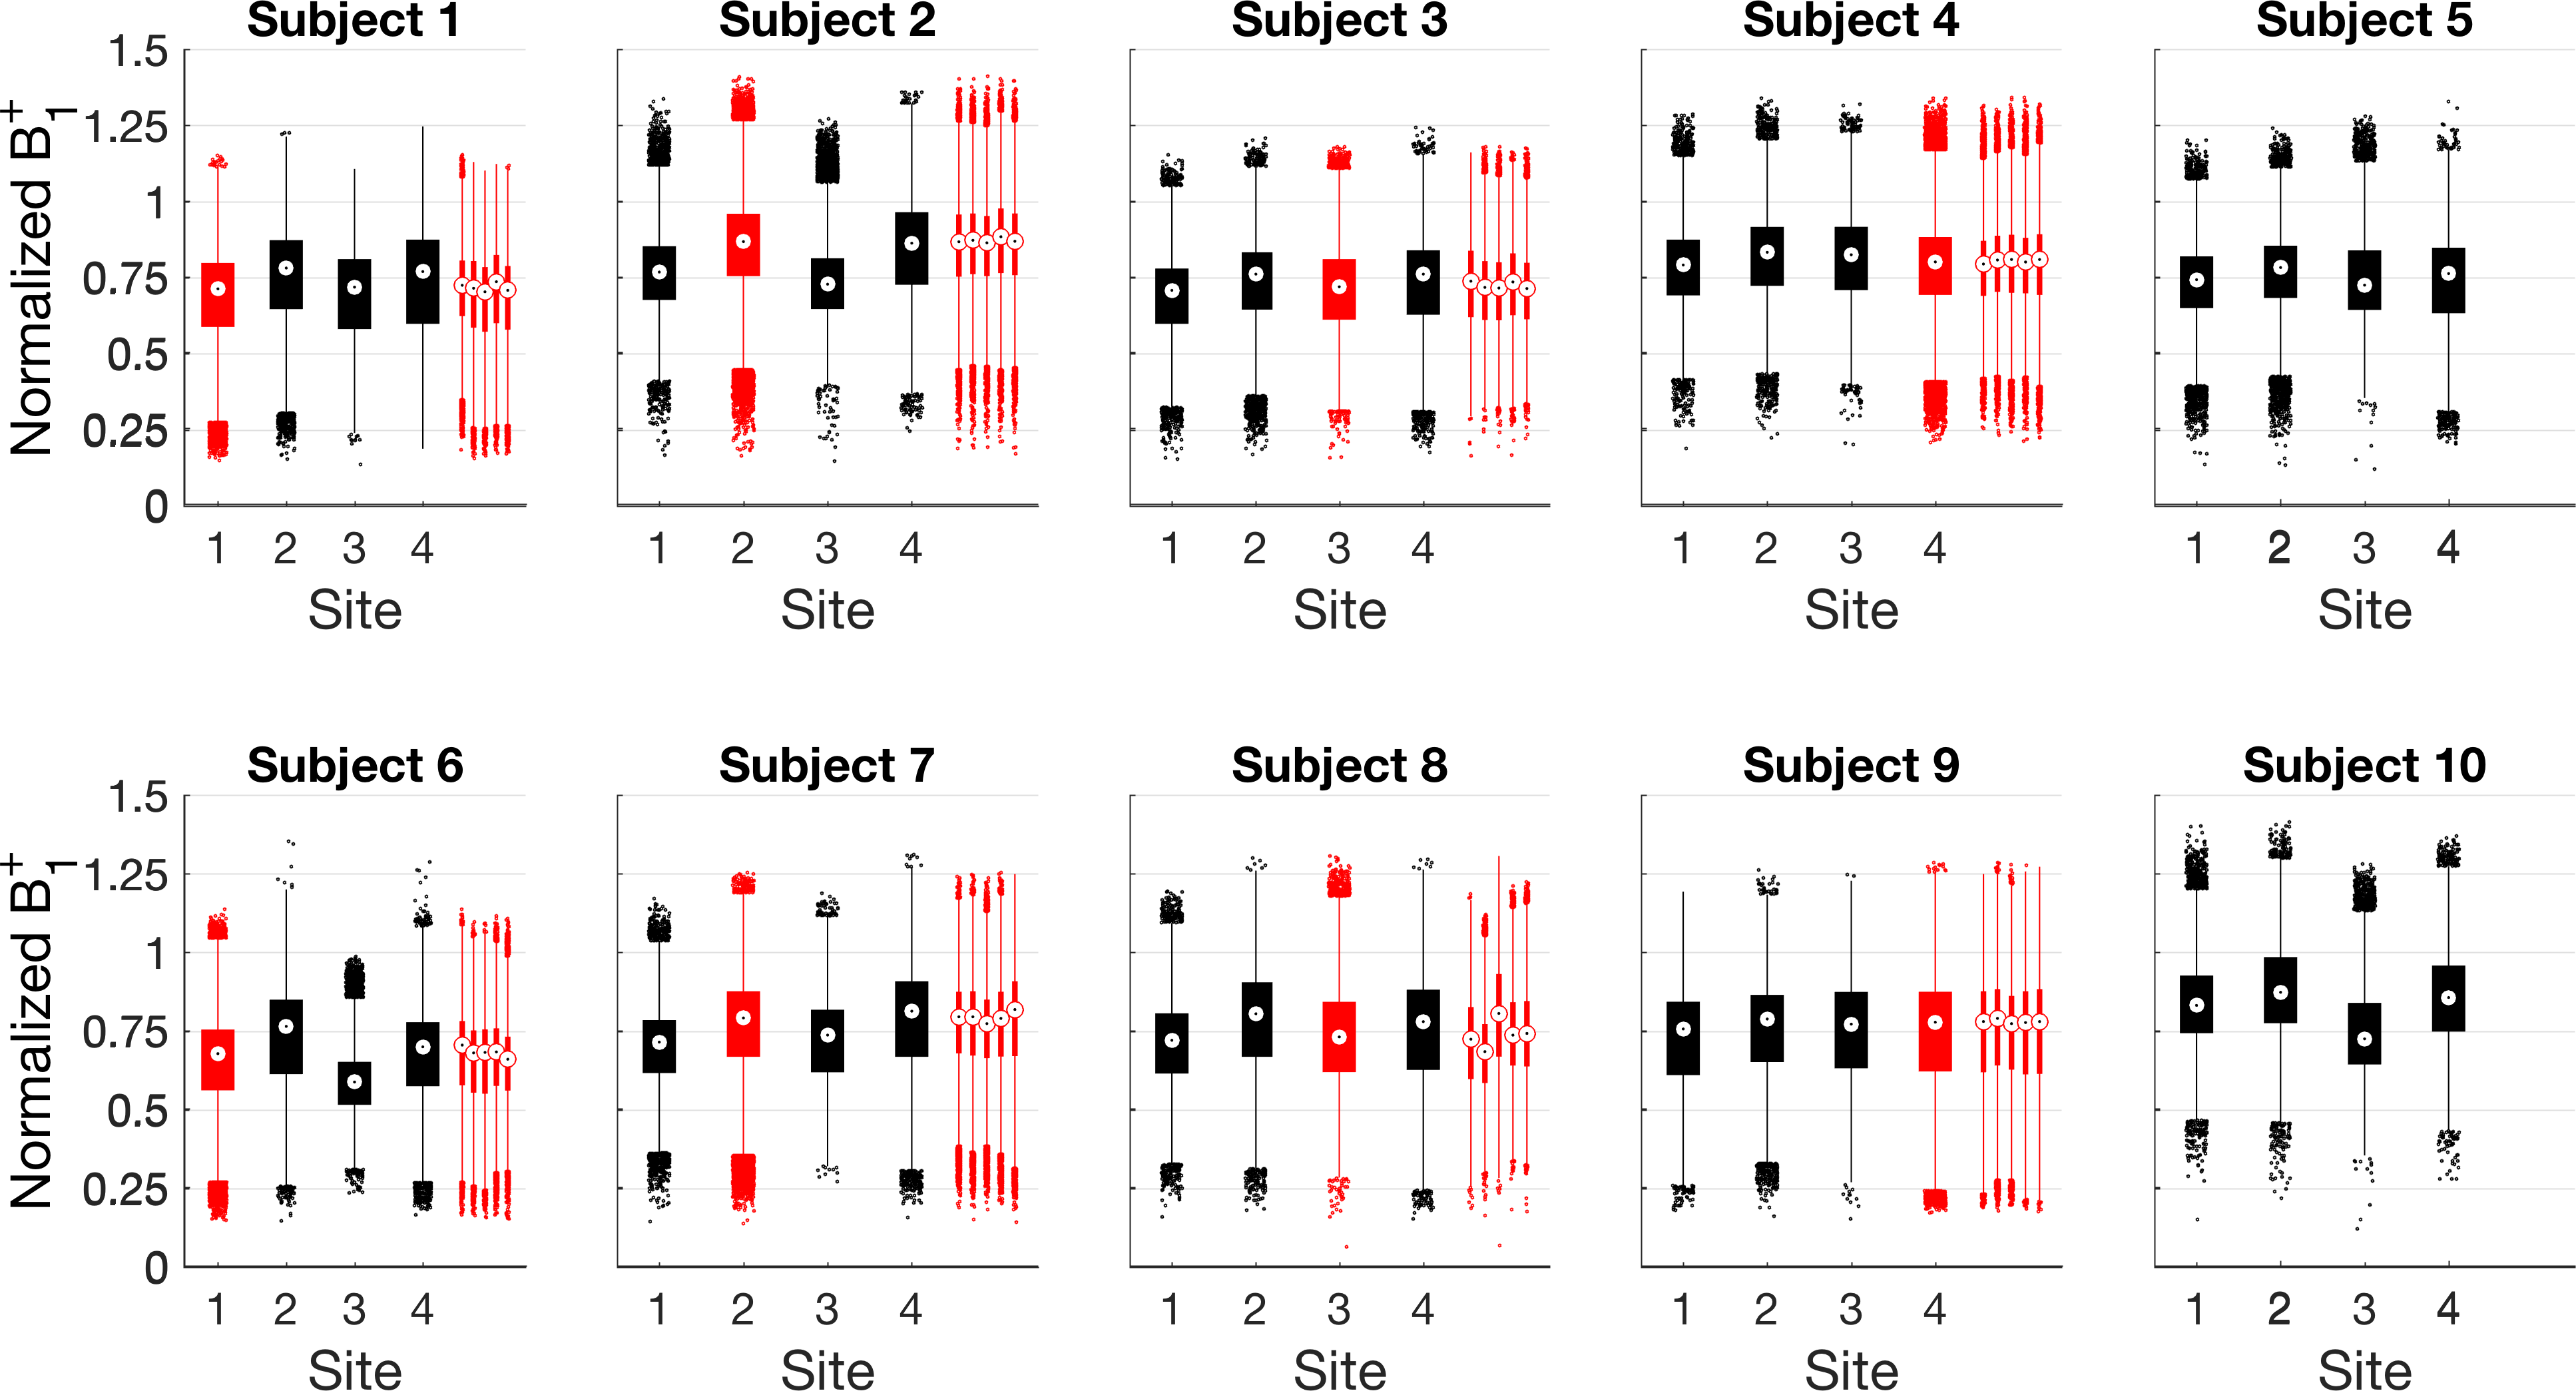
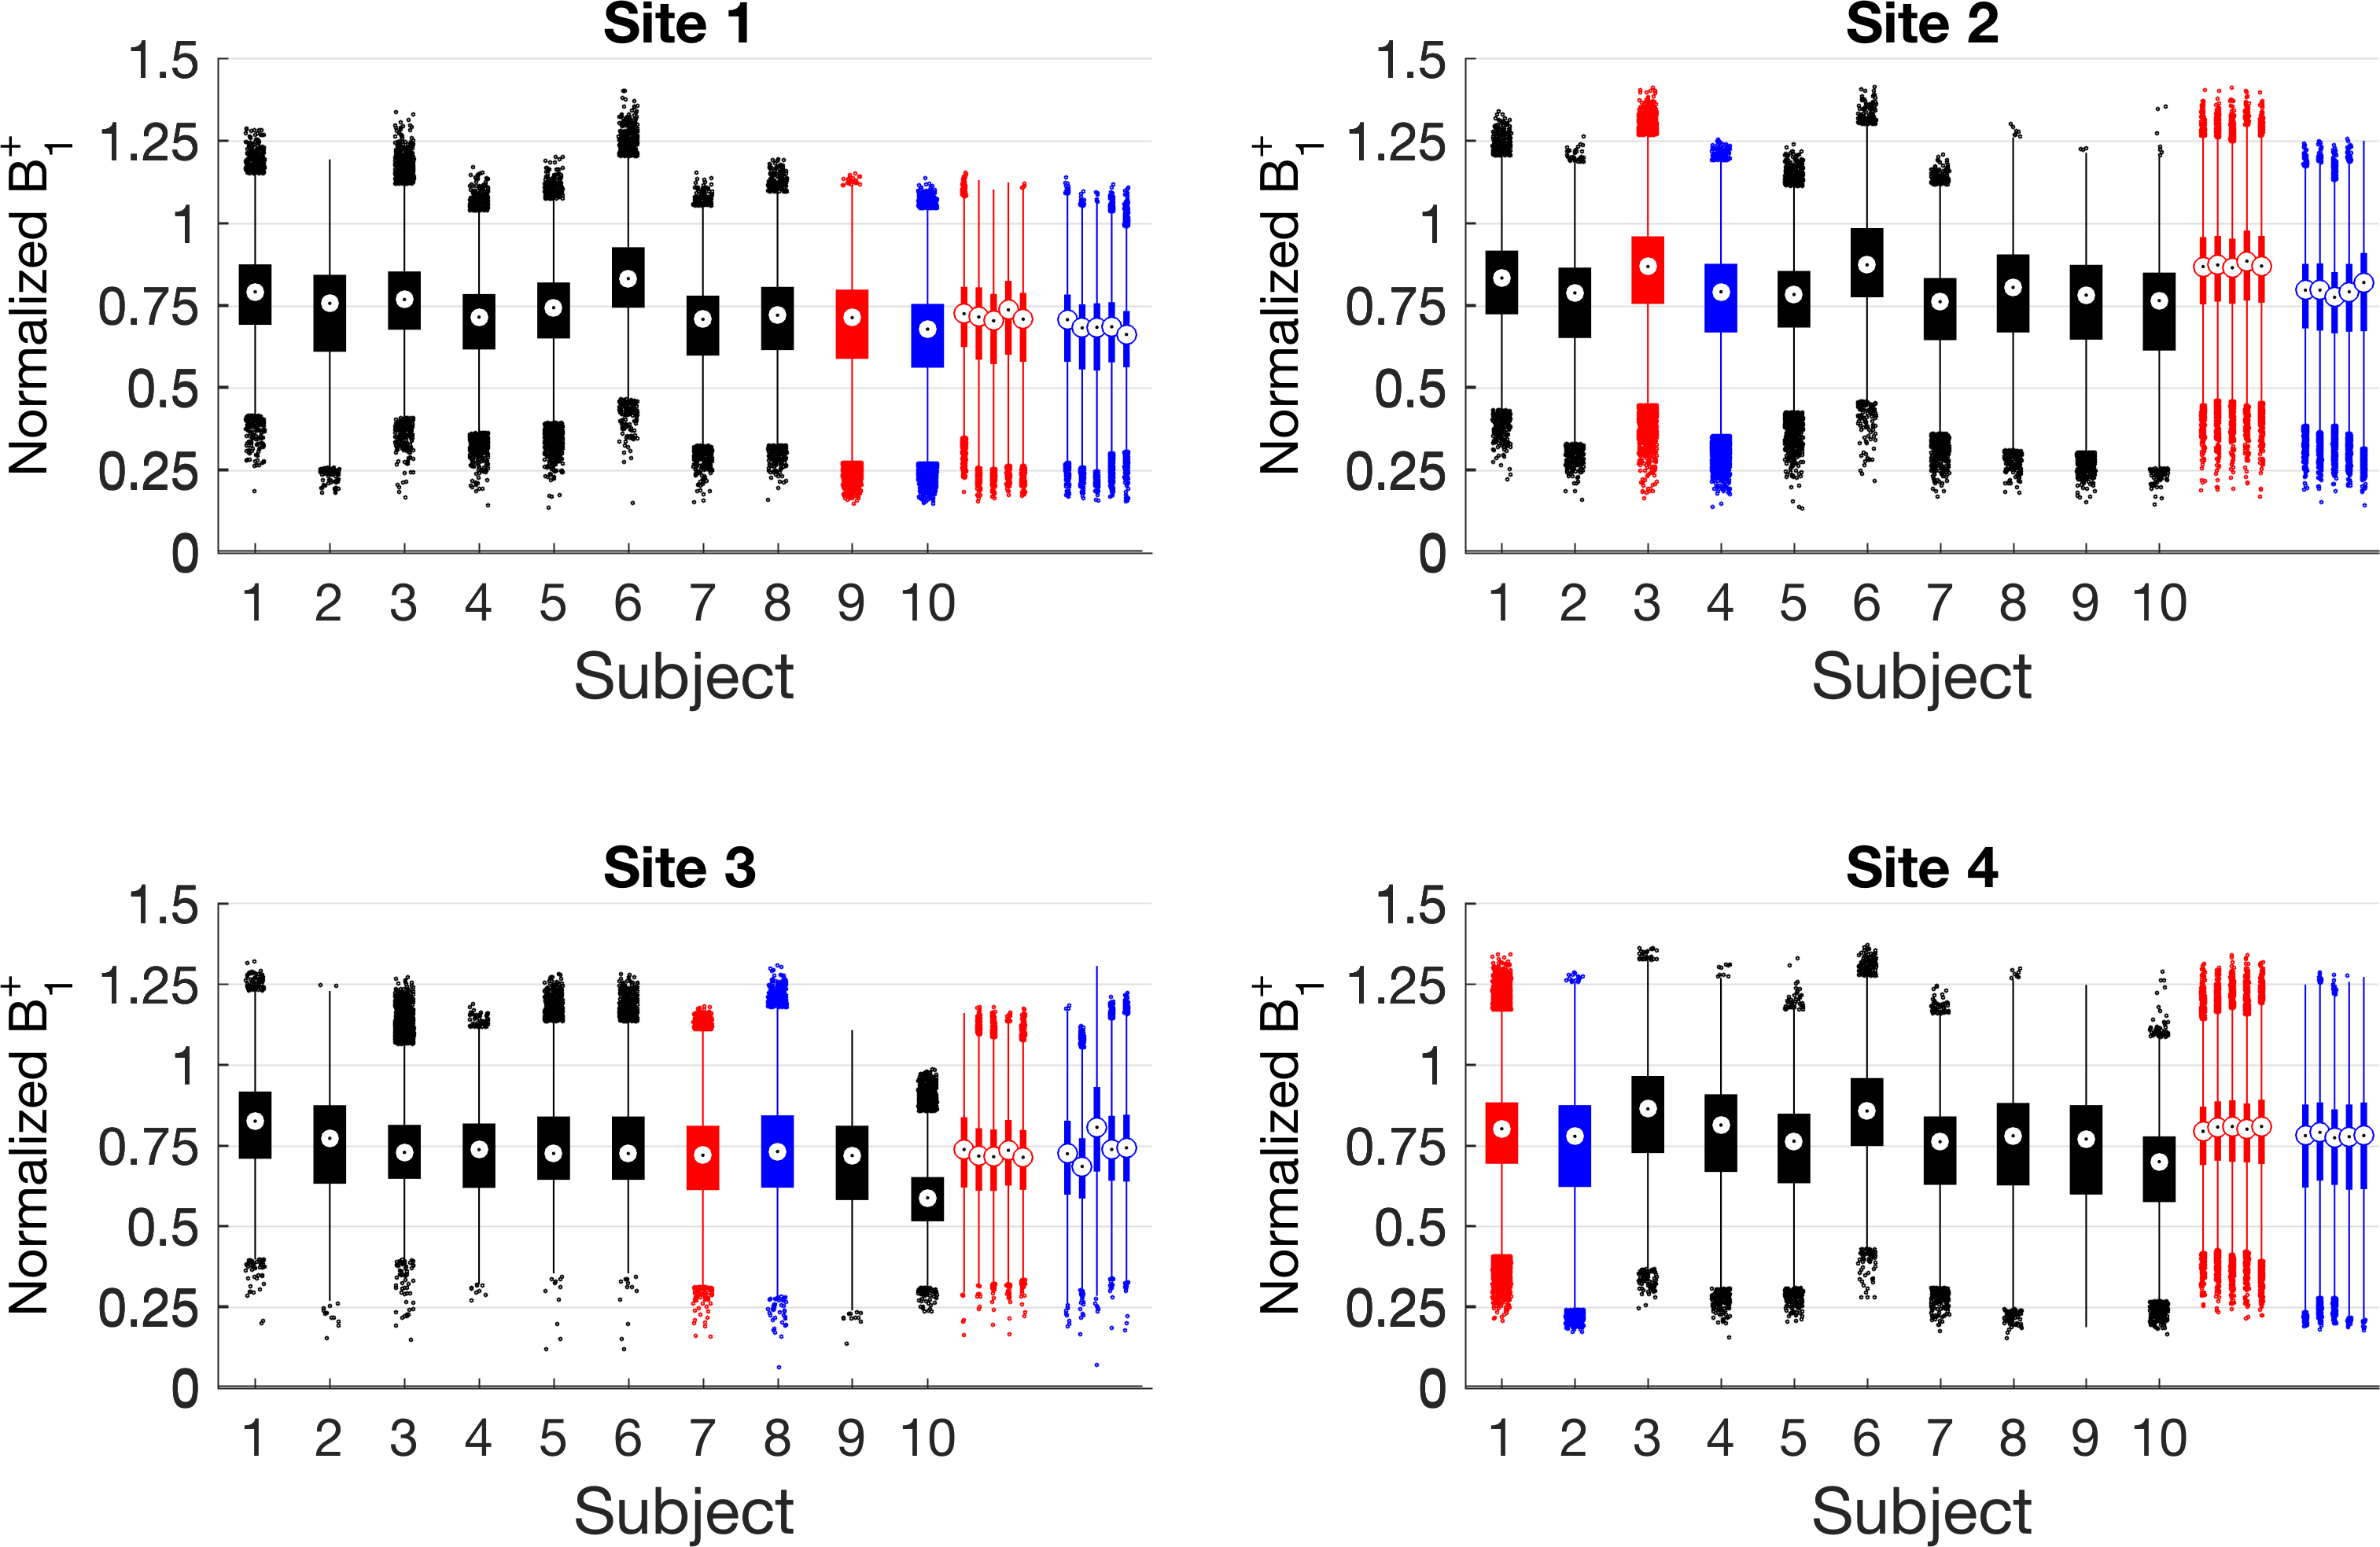
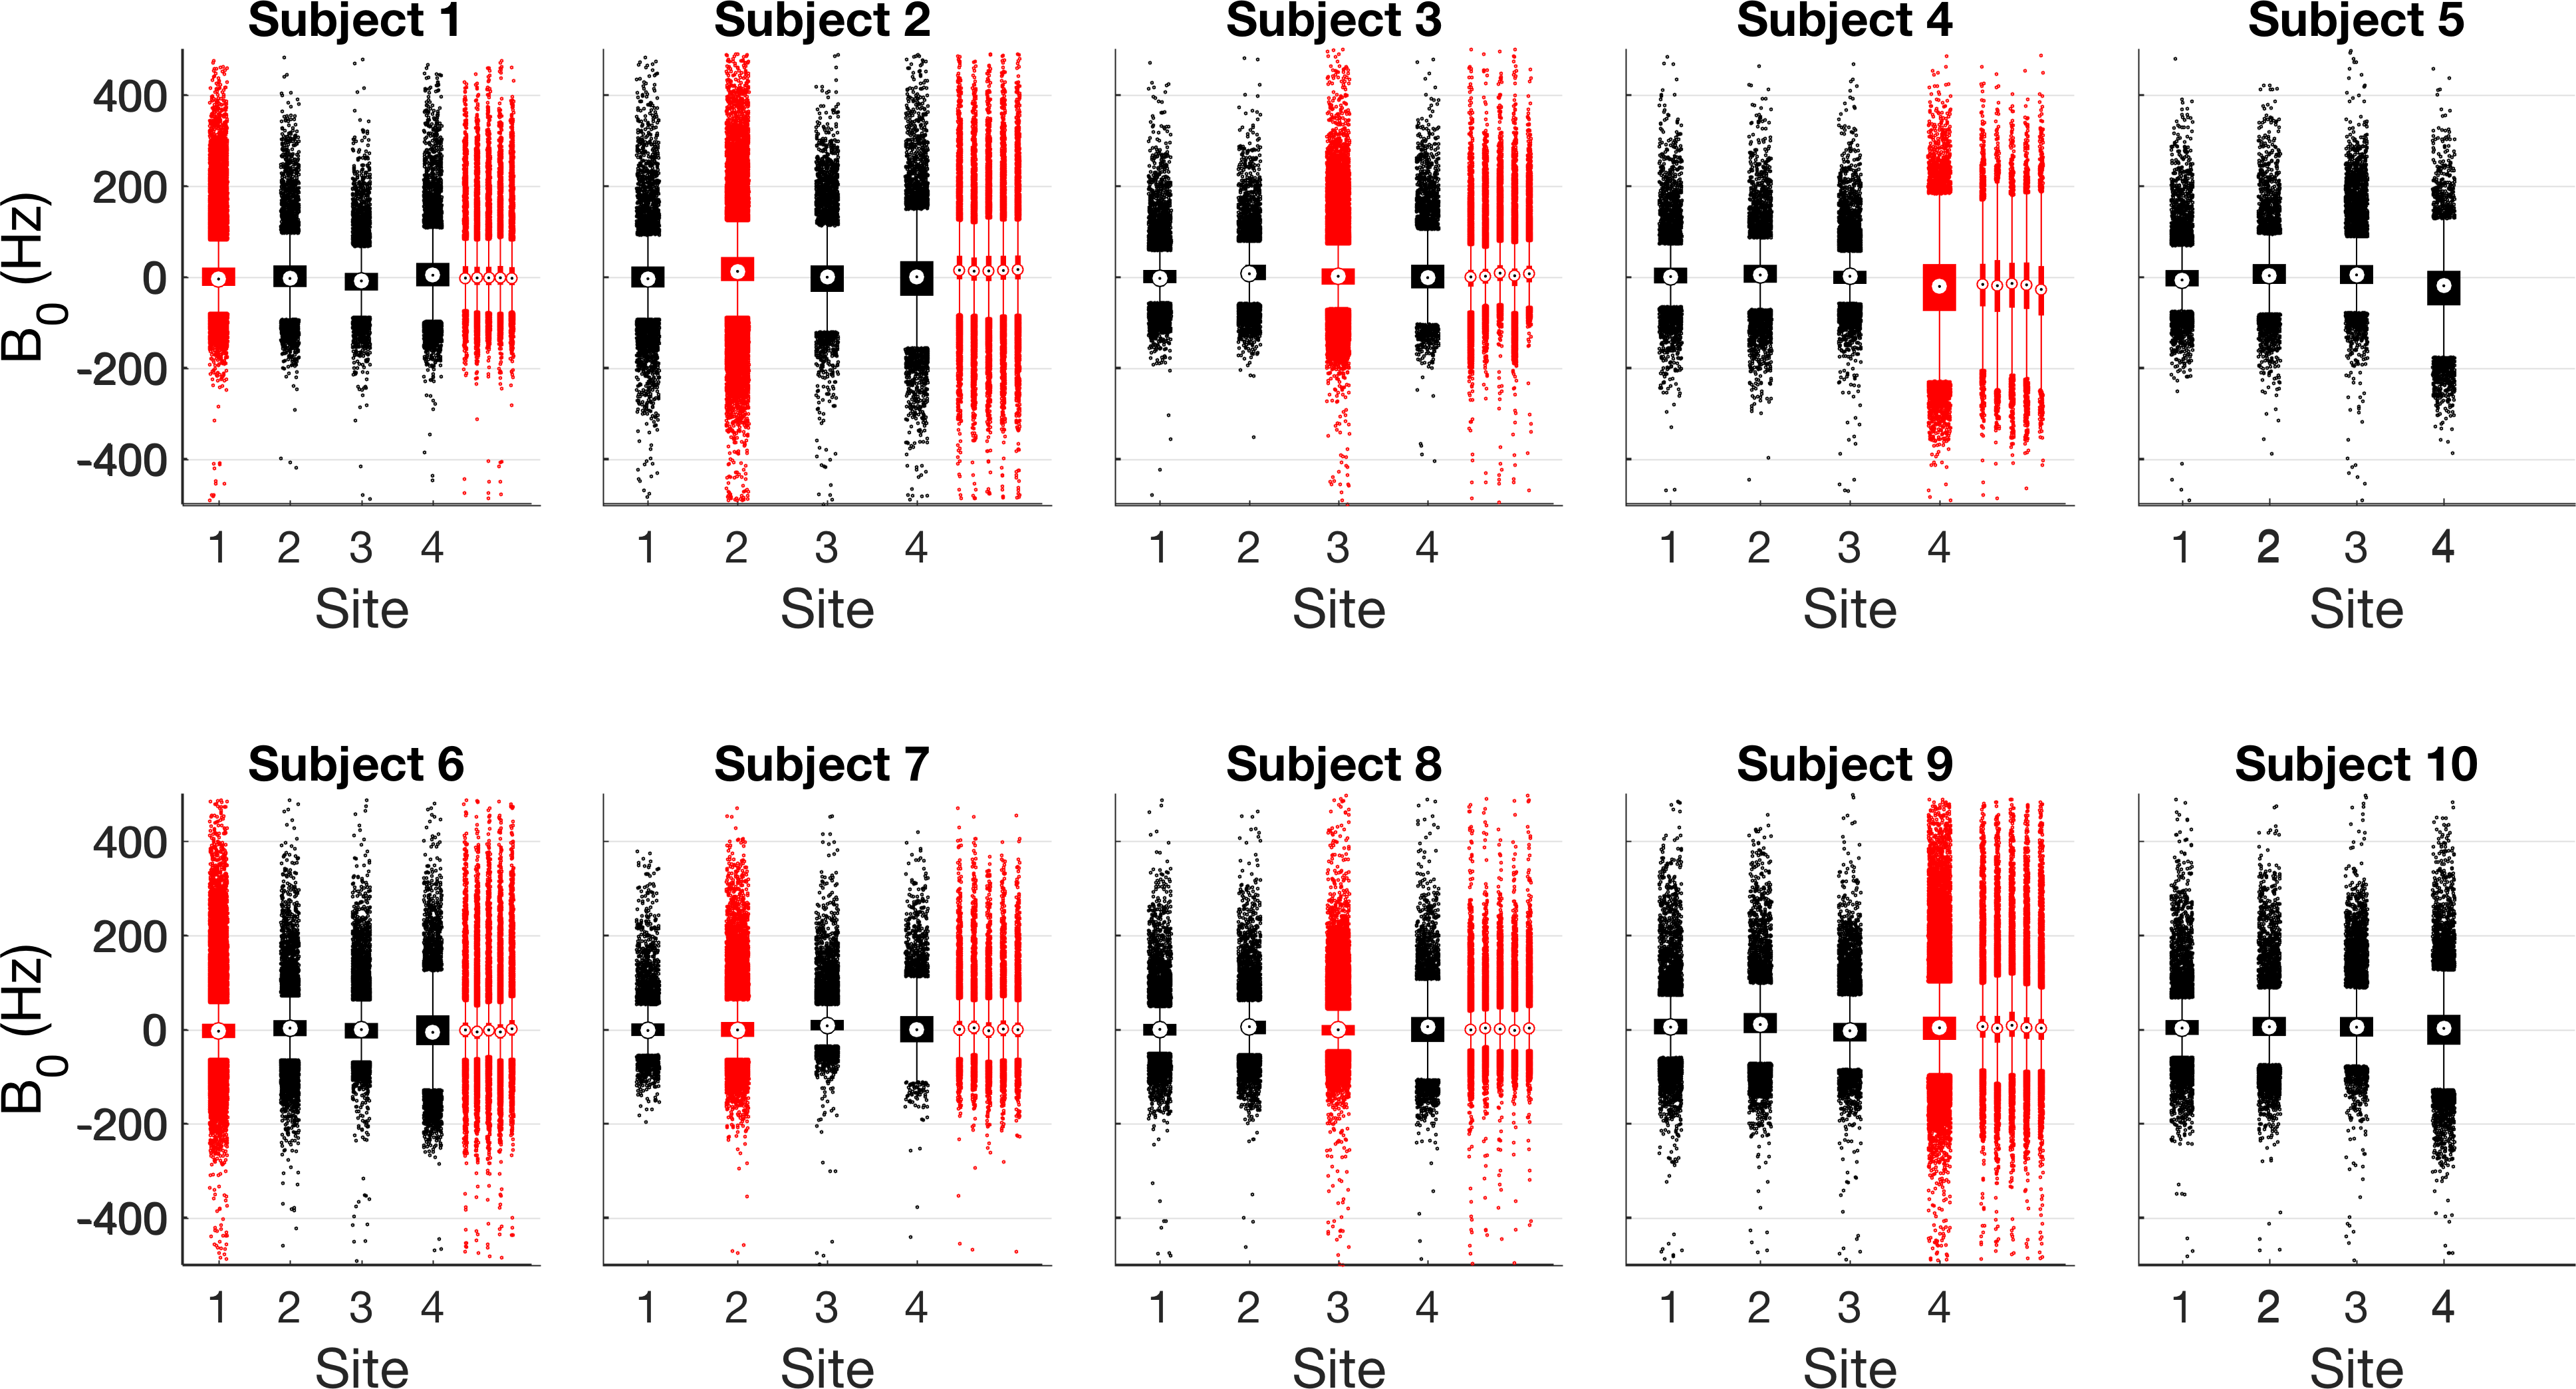
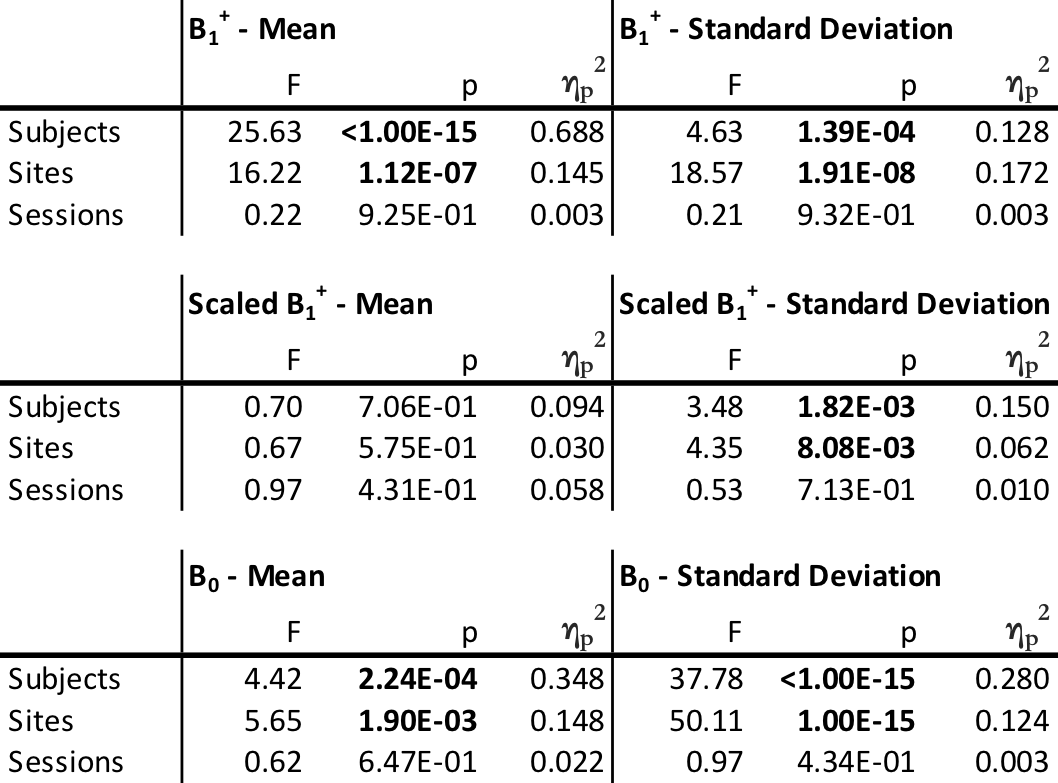
Figure 1 shows, per-subject, the site-wise distributions of the voxel-wise normalized B1+-fields. Figure 2 shows the same data plot subject-wise, per-site. Figure 3 shows, per-subject, the site-wise distributions of the voxel-wise normalized B0-field. The results of the ANOVA tests are presented in Table 2.
The mean (± SD) B0-field standard deviation across all scans was 53±12 Hz. The mean (± SD) B1+-field mean across all scans was 0.75±0.06, after scaling this was 1.00±0.08. The mean (± SD) B1+-field standard deviation across all scans was 0.17±0.02, after scaling this was 0.23±0.03.
Discussion
The ANOVA tests show significant variance (p<<0.05) due to site and subject differences on all measures except the means of the scaled B1+-fields. Furthermore, the tests show that for both B1+- and B0-fields inter-subject differences account for more variance in means and standard deviations than inter-site (and inter-session) variance. Inter-session variance was not significant in all tests.
After rescaling the B1+-fields so that the mean B1+-field of each subject was 1.00 there was no significant variance of the mean explained by inter-subject, site or session effects. The scaling increased the mean standard deviation of the B1+-field across all scans, as in all cases the scanner’s own calibration underestimated the mean value across the whole brain. ANOVA on the standard deviation of the scaled B1+-field values retained significance for the effect of sites and subjects, though the variance explained (ηp2) by inter-site effects was decreased (from 0.172 to 0.062) to below variance explained by inter-subject effects (from 0.128 to 0.150).
Conclusion
The B1+- and B0-fields at 7 tesla in the human brain have been characterized in a multi-centre travelling heads study. Analysis of variance shows that inter-subject differences typically dominate the variance of both B1+- and B0-fields. After applying manual scaling of the transmit gain, inter-subject and inter-site variability of mean B1+-fields are not significant. Inter-session differences at the same site and with the same subject are not statistically significant.Acknowledgements
The UK7T Network and this work was funded by the UK's Medical Research Council (MRC). [MR/N008537/1]. The Wellcome Centre for Integrative Neuroimaging is supported by core funding from the Wellcome Trust (203139/Z/16/Z). CTR is funded by a Sir Henry Dale Fellowship from the Welcome Trust and the Royal Society [098436/Z/12/B].
We thank David Porter for supporting the UK7T Network in using the scanner and facilities at ICE, University of Glasgow.
References
1. Vaughan JT, Garwood M, Collins CM, Liu W, DelaBarre L, Adriany G, Andersen P, Merkle H, Goebel R, Smith MB, Ugurbil K. 7T vs. 4T: RF power, homogeneity, and signal-to-noise comparison in head images. Magn Reson Med 2001;46(1):24-30.
2. Clarke WT, Mougin O, Driver ID, Rua C, Francis S, Wise R, Carpenter A, Muir K, Bowtell RW, Clare S. Variability of B1+ and B0 fields in the human brain at 7T. Proc Intl Soc Mag Reson Med 26 2018:4199.
3. Balchandani P, Naidich TP. Ultra-High-Field MR Neuroimaging. AJNR Am J Neuroradiol 2015;36(7):1204-1215.
4. Zwanenburg JJ, Hendrikse J, Visser F, Takahara T, Luijten PR. Fluid attenuated inversion recovery (FLAIR) MRI at 7.0 Tesla: comparison with 1.5 and 3.0 Tesla. Eur Radiol 2010;20(4):915-922.
5. Clarke WT, Mougin O, Driver ID, Rua C, Morgan AT, Clare S, Francis S, Wise R, Carpenter A, Muir K, Bowtell RW. The UK7T Network – optimized design of a multi-site, multi-vendor travelling heads study. Proc Intl Soc Mag Reson Med 26 2018:317.
6. Brenner D, Tse DHY, Pracht ED, Feiweier T, Stirnberg R, Stöcker T. 3DREAM – A Three-Dimensional Variant of the DREAM Sequence. Proc Intl Soc Mag Reson Med 22. 2014; Milan, Italy. p 1455.
7.Nehrke K, Bornert P. DREAM--a novel approach for robust, ultrafast, multislice B(1) mapping. Magn Reson Med 2012;68(5):1517-1526.
8. Smith SM. Fast robust automated brain extraction. Hum Brain Mapp 2002;17(3):143-155.
Figures