2811
Reduction of power deposition using VERSE RF pulses to decrease acquisition time in pulsed ASL sequence at high field.1Centre for Functional and Metabolic Mapping, Univ. of Western Ontario, london, ON, Canada, 2Medical Biophysics, Univ. of Western Ontario, london, ON, Canada
Synopsis
The use of Arterial spin labelling at high field, allow for a gain in sensitivity in brain perfusion images. However, this necessitates an increase in acquisition time due to SAR limits. To address this problem, the conventional selective RF pulses used for saturation of the blood in the PICORE Q2TIPS tagging technique of the Pulsed ASL sequence were replaced by their corresponding VERSE RF pulses, to achieve the same task with less power. As a result, perfusion images were obtained in a shorter acquisition time allowing for an increase of both the number of acquisitions and SNR.
Introduction:
Arterial spin labelling (ASL) is used for the measurement of the cerebral blood flow (CBF). Nevertheless, the utilization ofASL is limited by the low signal-to-noise ratio (SNR) 1. This problem is generally addressed when using ASL at high field (7 T and higher), where an increase in SNR was obtained 2,3. However, this advantage comes at the cost of the specific absorption rate (SAR) constraints making some ASL techniques, such as pseudo-continuous ASL (pCASL), impractical at 7 T. As a consequence, to remain within SAR limits, the Pulsed ASL (PASL) sequences are usually used to acquire perfusion images with longer acquisition time. This may make their use for other imaging modes (e.g, fMRI) difficult to achieve 4. To overcome this problem, the conventional selective RF pulses (with sinc shapes) used for periodic saturation in the PICORE Q2TIPS labeling scheme of the 2D EPI PASL sequence, were replaced by their equivalent variable-rate selective-excitation (VERSE) pulses, generated using an analytic scaling function 5, which require less power to achieve the same task, and therefore allow for SAR reduction and a decrease in acquisition time.Material and Methods:
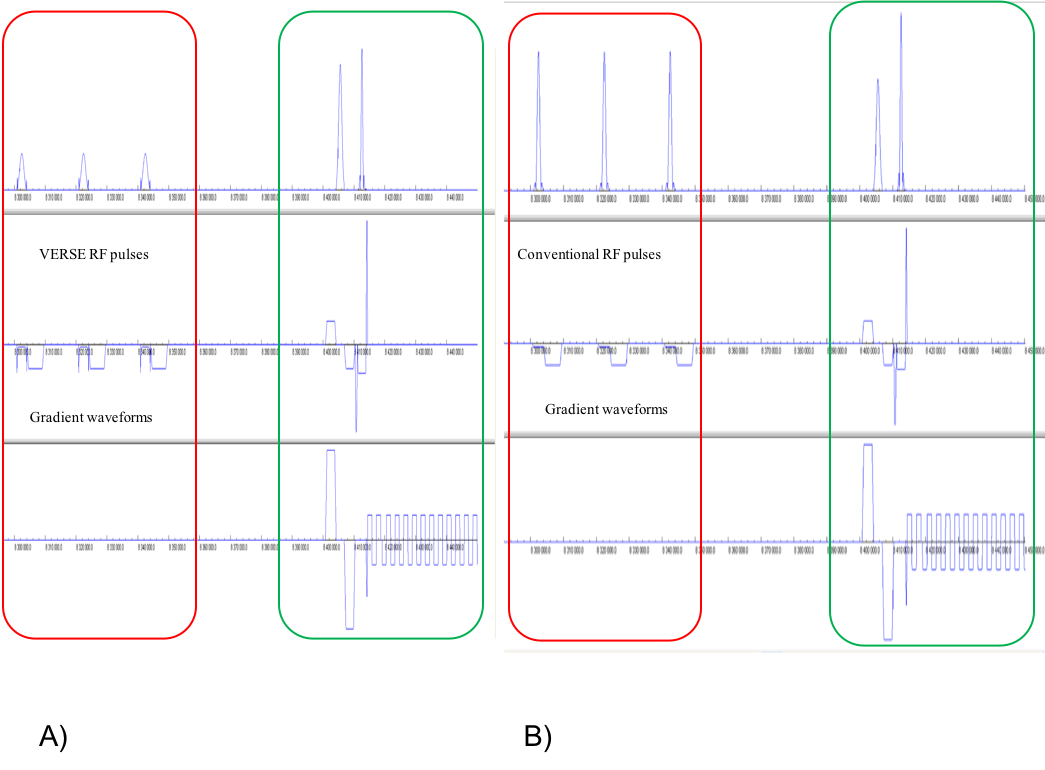
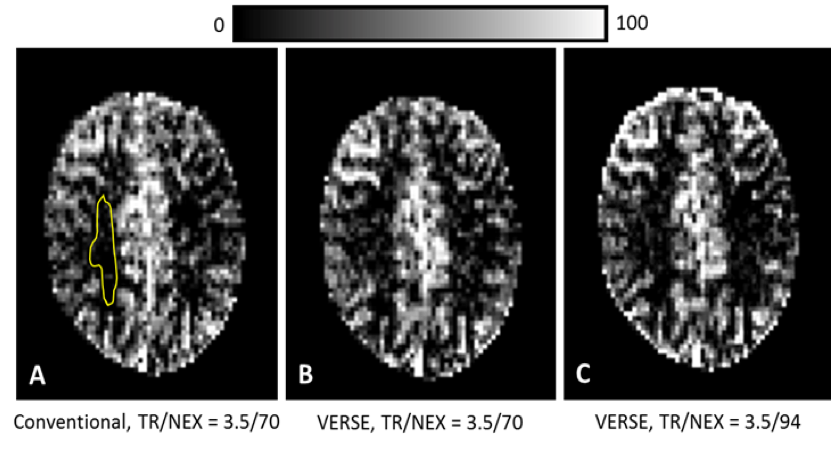
Perfusion ASL data from three healthy volunteers were acquired on a 7T head-only Siemens Magnetom Step 2.3 system equipped with parallel-transmit capabilities, using a 2D EPI-based PASL sequence combined with the PICORE Q2TIPS scheme for the blood labelling 6. Two types of periodic saturation RF pulses used in the Q2TIPS block were played: i) selective RF pulse with 3.2 msec duration and Time-Bandwidth product of 4; and ii) its equivalent VERSE RF type generated using an analytic scaling function 5. The acquisition parameters were TE=9.5ms, flip-angle=70o, 12 slices with voxel size=2.5x2.5x2.5mm3, 20% inter-slice distance, and TI1/TI2=700/1800ms for magnetization preparation resulting in 36 consecutive RF pulses (conventional and VERSE) of the Q2TIPS block played to saturate the distal edge (20 mm) of the 100 mm tagged region (Fig. 1) 6. The imaging slab was oriented at about -26o to achieve good coverage of the visual cortex region. Phantom studies were conducted to measure the percentage reduction in power deposition using VERSE pulse. Consequently, the minimum TR value, found to be 3.5 sec for a maximum number of repetitions (NEX) of 70 (split into 35 tag/control images) using the conventional RF pulse, was reduced to 3.2 sec using the VERSE RF pulse. Furthermore, with a TR of 3.5 sec, using VERSE, the maximum number of repetitions was extended to 94 (split into 47 tag/control images). Therefore, four data sets were acquired using the following pairs (TR (sec)/NEX = 3.5/70, using conventional RF pulse), and (TR/NEX = 3.2/70, 3.5/70, 3.5/94 , using VERSE pulse). Perfusion maps were generated from the tag-control difference images and the CBF values were obtained using the labeling efficiency of 0.98 7. The perfusion tSNR (temporal signal to noise ratio ) was computed by dividing the mean of the perfusion time series of the grey matter region by its standard deviation 3. The SNR of the grey matter (SNRGM), on the CBF maps, was measured as the mean signal intensity of the global grey matter over the noise standard deviation of the selected white matter region (Figure 3A).Results and Discussion:
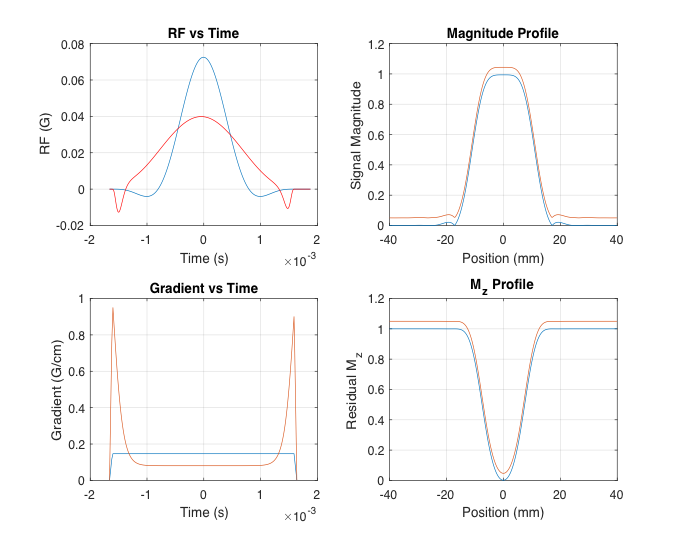
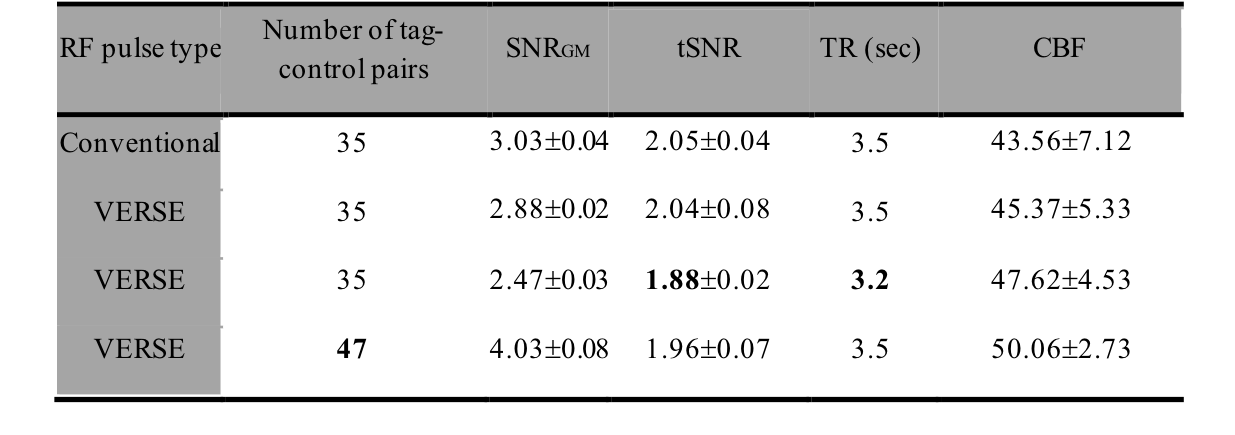
Figure 2 displays the shapes of the sinc/VERSE RF pulses with their corresponding simulated slice profiles, where a reduction of about 40% in power deposition was obtained. Inserted into the PASL/PICORE Q2TIPS sequence (Fig. 1), VERSE pulses allow for a reduction of 13% in power deposition as compared to the conventional RF pulses. Figure 3 displays the corresponding perfusion images of the centre slice, for the conventional and VERSE-based pulses. Mean ±intersubject variability in CBF and tSNR values for the four acquisitions, given in Table 1, were comparable, demonstrating that the VERSE RF pulses saturate the distal edge of the tagged region similar to the conventional RF pulses, but with less power, allowing for either increase the number of repetitions or reduction in the minimum TR. As expected, an increase in SNRGM was obtained with TR/NEX = 3.5 sec /94. Conclusion:
These preliminary results show that replacing the conventional RF pulses (sinc shapes) by VERSE RF pulses in the PICORE-Q2TIPS PASL sequence at high field improve performance by decreasing SAR, lowering TR, allowing forhigher SNR, and consequently better background suppression.Other conventional RF pulses used in the PICORE Q2TIPS scheme such as the in-plane pre-saturation RF pulses which will be substituted by VERSE type for further SAR reduction.
Acknowledgements
The authors acknowledge Trevor Szekeres for acquiring the MRI data. This work was supported by the CIHR Foundation grant (FDN 148453) and a Brain Canada Platform Support Grant.References
1)D.C. Alsop et al., Magn. Reson. Med. (2015) 73:102–116.
2) R. Pohmann et al., Magn. Reson. Med. (2016) 75:801–809.
3) D Ivanov, et al. Magn. Reson. Med.(2017)78:121–129
4) F Zimmer et al., MAGMA, (2016) 29:463-473.
5) ND Gai, et al, J. Magn. Reson. (2007) 189:78–89
6)WM Luh, et al, Magn. Reson. Med.(1999) 41:1246–1254
7) EC Wong et al., Magn. Reson. Med. (1998) 40: 348-355.
Figures