2810
Age-related changes in tissue T1, T2 values of the human brain quantified by 2D PnP-MRF at 7T MRI1Human Brain Research Center, Graduate School of Medicine, Kyoto University, Kyoto, Japan, 2Center for Advanced Imaging Innovation and Research (CAI2R) and Bernard and Irene Schwartz Center for Biomedical Imaging, Department of Radiology, New York University School of Medicine, New York, NY, United States, 3Department of Neurology, Graduate School of Medicine, Kyoto University, Kyoto, Japan, 4Department of Human Health Sciences, Graduate School of Medicine, Kyoto University, Kyoto, Japan, 5Department of Neuroscience, Graduate School of Medicine, Kyoto University, Kyoto, Japan
Synopsis
To investigate age-related changes in T1 and T2 of brain tissues at 7T, healthy volunteers (N=45, age range 20-81) were scanned using a 1ch-Tx/32ch-Rx coil and a Plug-and-Play MR Fingeprinting (prototype) sequence. Six brain regions (putamen, globus pallidus, caudate head, thalamus, frontal white matter (WM) and frontal gray matter (GM)) were evaluated. Linear and quadratic curve fitting was performed. Significant linear correlation in T2 was found for the putamen and frontal WM and a quadratic correlation was found for the putamen (T2), globus pallidus (T2), thalamus (T1) and frontal WM (T1/T2).
Introduction
Aging of the brain is associated with various physiological changes such as axonal loss, demyelination, synaptic loss and neuronal loss. These age-related changes have been extensively investigated with MRI. In previous studies, relaxometry has been performed using separate measurements for T1, T2, or T2*. At ultra-high field, however, it can be challenging to apply these techniques. As the RF wavelength approaches to the diameter of the human head, the non-uniformities in the excitation field (B1+) become more and more pronounced [1]. MR Fingerprinting (MRF) enables fast and reproducible MR by utilizing a pseudo-random RF pulse train and matching the measured signal evolution to the entries in a dictionary of simulated spin-evolutions [2]. The flexibility of the MRF framework also provides unique opportunities to mitigate B1+ artifacts [3]. In this work we used a B1+ robust MRF sequence (PnP-MRF) to investigate age-related changes in T1 and T2 values of the brain tissues in normal healthy volunteers at 7T MRI.Methods
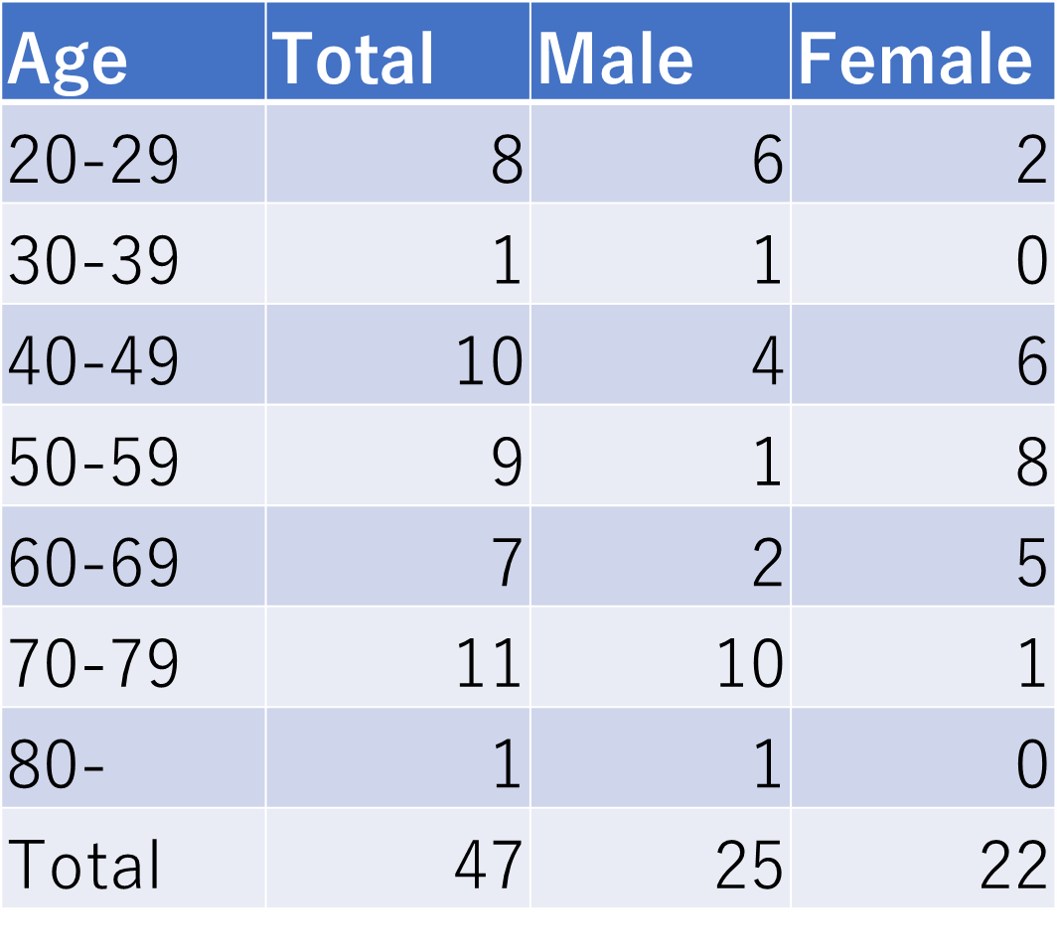
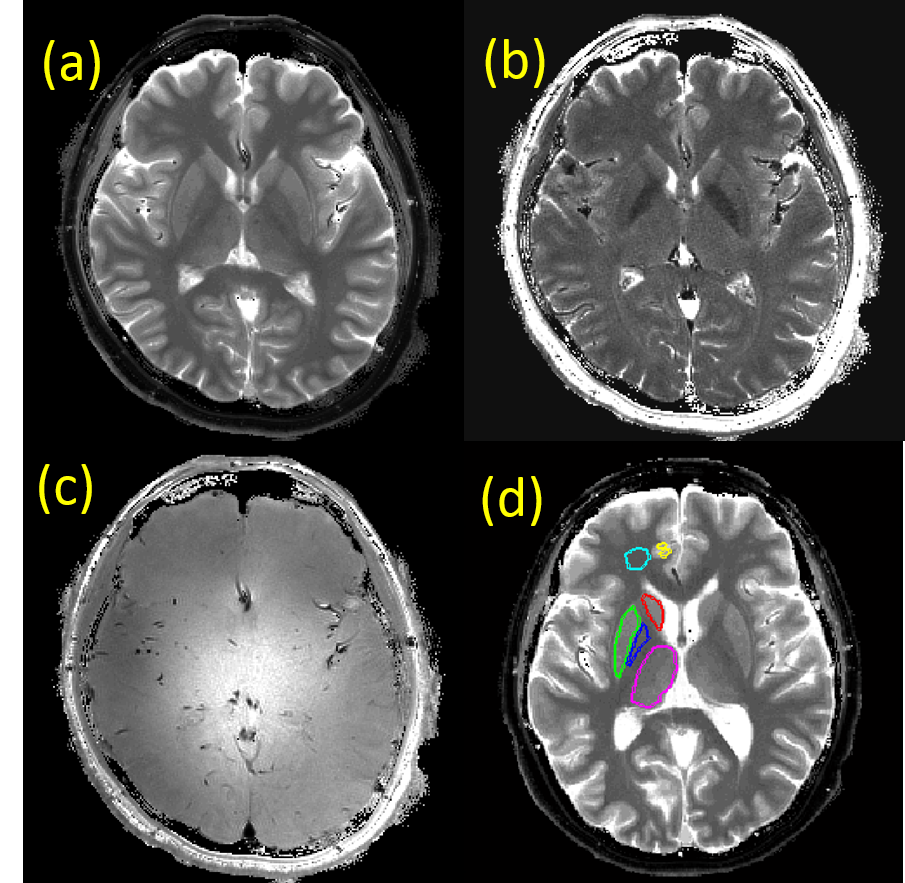
The study was approved by our institutional review board. Forty-seven normal healthy volunteers (mean 52.5, age range 20-81) were scanned with an investigational whole-body 7T scanner (MAGNETOM 7T, Siemens Healthineers AG, Erlangen, Germany) equipped with body gradients and a 1ch Tx, 32ch Rx coil (Nova Medical, Wilmington, MA). An in-house developed offline reconstruction script was used to reconstruct the T1/T2/B1+ maps from the PnP-MRF data. Scanning parameters were summarized in figure 1. ROI were manually placed in six brain regions: putamen, globus pallidus, caudate head, thalamus, frontal white matter (WM) and frontal gray matter (GM) (figure 2). Mean T1 and T2 values were obtained in each ROI. Linear and quadratic curve fitting was performed for all subjects as well as male and female subjects individually (Matlab R2017b, MathWorks, Inc., Natick, MA). After applying Bonferroni correction, p values less than 0.0007 (=0.05/72) were considered as a presence of significant difference.Results
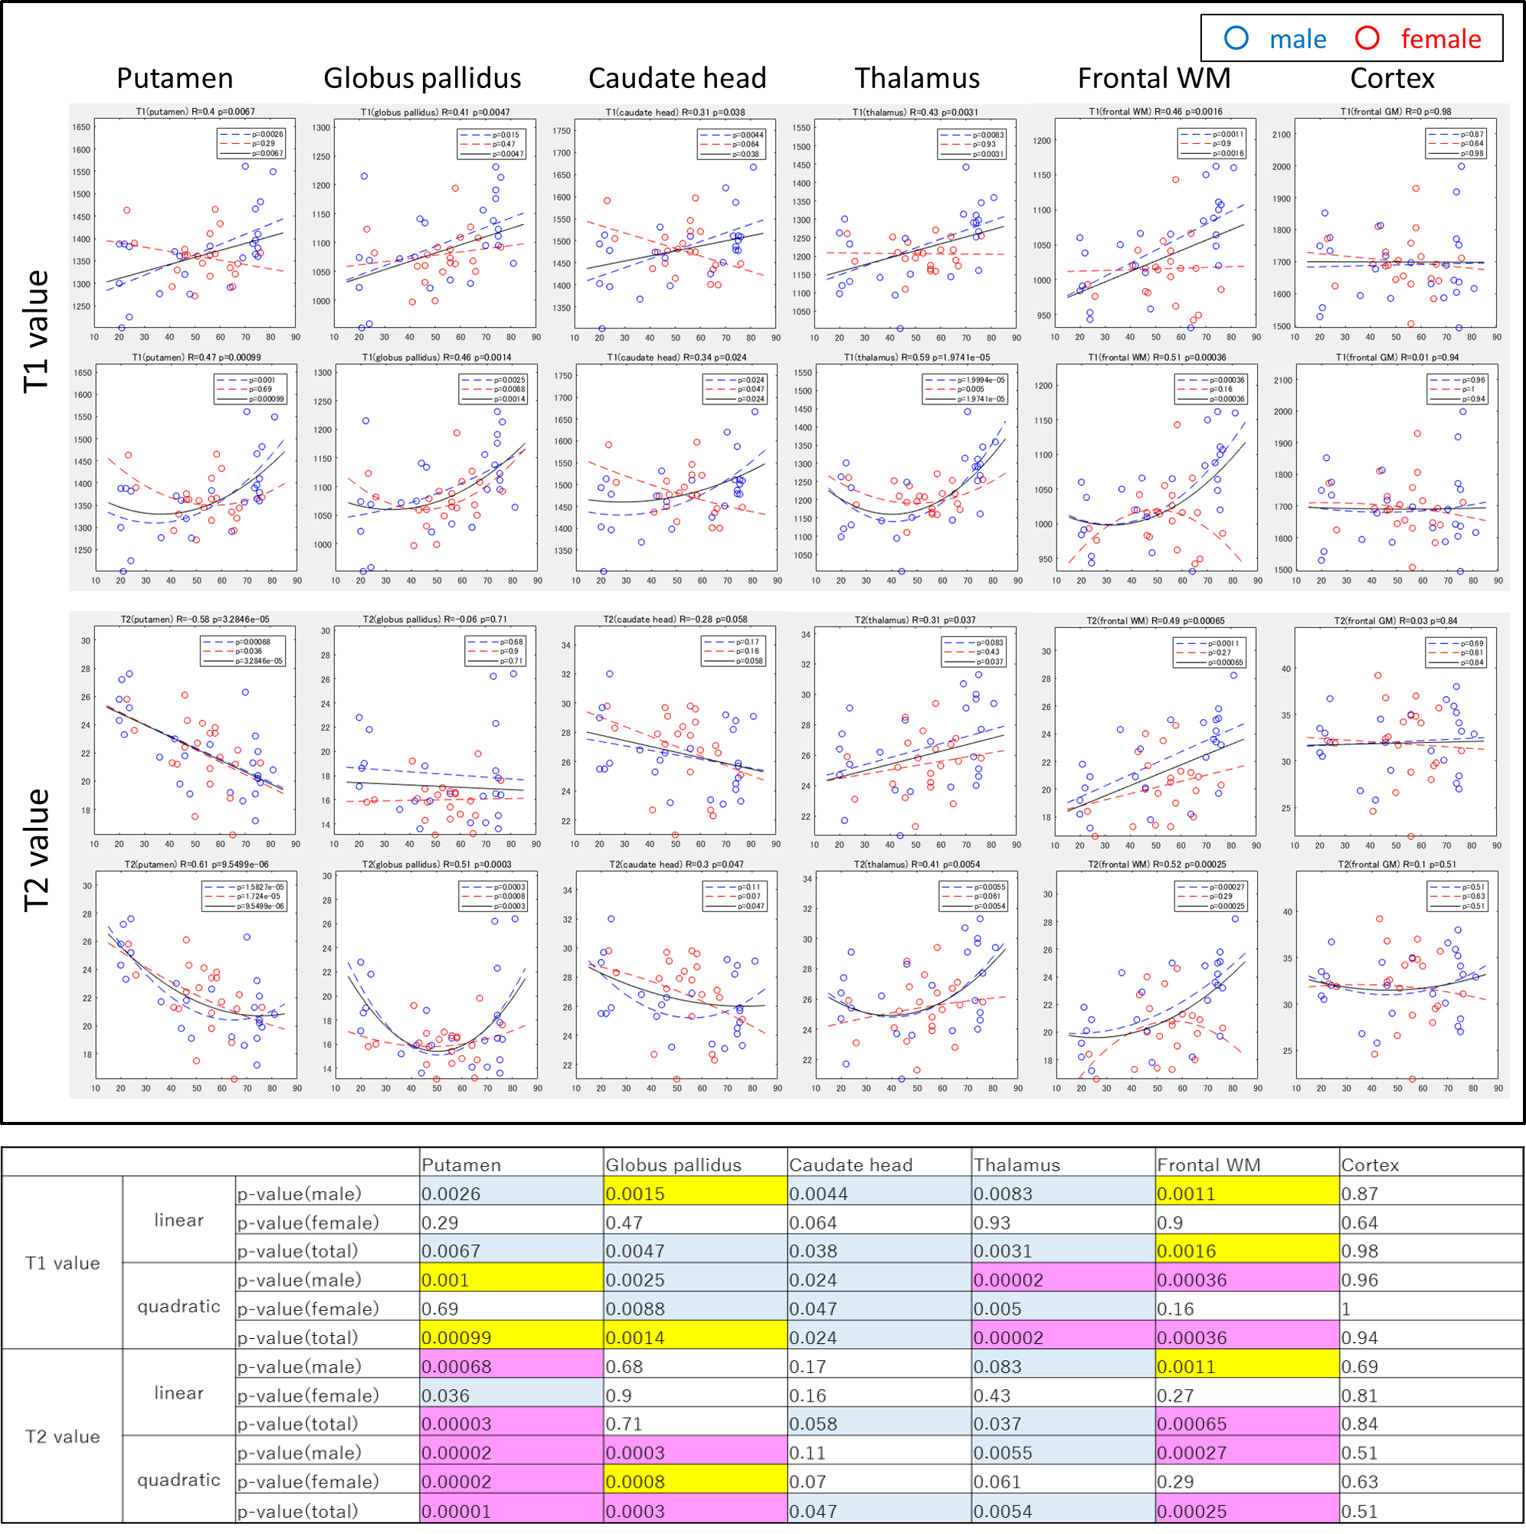
The results are summarized in Figure 3. For putamen, T2 values showed significant linear decrease for male subjects. Linear decrease was also significant for the overall (male + female) subjects, but this was not significant in the female subjects. Quadratic fitting of the T2 values of the putamen reached significant level for both male and female subjects. Globus pallidus showed significant quadratic change for male and overall subjects. Thalamus showed quadratic change in the T1 value for the male and overall subjects. Frontal WM showed quadratic change in the T1 value for the male and overall subjects. Frontal WM showed linear increase in the T2 value for overall subjects, and quadratic change in the T2 value for male and overall subjects.Discussion
In general, female subjects tend to show smaller change both for T1 value and T2 value than male subjects. Quadratic change in the T1 value for the frontal WM, quadratic change in T2 value for the putamen, globus pallidus and frontal WM were concordant with previous reports at 3T [4,5]. The ability to efficiently mitigate B1 artifacts and quickly (~60sec/slice) obtain robust T1/T2 values at 7T creates new opportunities to investigate age related brain changes as the protocol can easily be appended to other research studies. Further investigation with the increased number of subjects, detailed analysis with the patient history (medication, habitus, etc.), and automatic segmentation have to be considered in future.Conclusion
Age-related changes in the brain tissue T1, T2 at 7T were observed. The data could be used as an estimator for evaluating the normal range of age-dependent variation, which in turn could be useful for early detection of pathological change of the human brain.Acknowledgements
This work was supported by SPIRITS 2018 of Kyoto University. The authors are grateful to Mr. Yuta Urushibata and Mr. Hideto Kuribayashi, Siemens Healthcare K.K., for their useful advice.References
[1] Vaughan JT, Garwood M, Collins CM, et al. 7T vs. 4T: RF power, homogeneity, and signal-to-noise comparison in head images. Magn Reson Med. 2001 Jul;46(1):24-30.
[2] Ma D, Gulani V, Seiberlich N, et al. Magnetic resonance fingerprinting. Nature. 2013 Mar 14;495(7440):187-92. doi: 10.1038/nature11971.
[3] Cloos MA, Knoll F, Zhao T, et al. Multiparametric imaging with heterogeneous radiofrequency fields. Nature Communications 7, Article number: 12445 (2016). doi:10.1038/ncomms12445
[4] Badve C, Yu A, Rogers M, et al. Simultaneous T1 and T2 Brain Relaxometry in Asymptomatic Volunteers using Magnetic Resonance Fingerprinting. Tomography. 2015 Dec;1(2):136-144.
[5] Okubo G, Okada T, Yamamoto A, et al. Relationship between aging and T1 relaxation time in deep gray matter: A voxel-based analysis. J Magn Reson Imaging, 2017: 46(3): 724-731.
Figures