2809
Optimization of adiabatic pulses for Pulsed Arterial Spin Labeling (pASL) at 7T1Laboratory of FMRI Technology (LOFT), Mark & Mary Stevens Neuroimaging and Informatics Institute, Keck School of Medicine, University of Southern California (USC), Los Angeles, CA, United States, 21 Siemens Medical Solutions USA, Inc., Los Angeles, CA, United States, 3Laboratory of Neuro Imaging, Stevens Neuroimaging and Informatics Institute, Keck school of medicine, University of Southern, Los Angeles, CA, United States, 4School of Information Technology and Electrical Engineering, University of Queensland, Brisbane, Australia
Synopsis
The goal of this work was to optimize and evaluate three types of adiabatic pulses for pulsed ASL (PASL) at 7T including Hyperbolic Secant (HS)[1], WURST[2] and FOCI[3] pulses using theoretical simulation, phantom and in vivo scans. WURST has the lowest loss in simulation and outperforms HS/FOCI in experiments. The optimized WURST pulse with the maximally allowed B1 is preferred to HS and FOCI pulses for adiabatic inversion in 7T PASL.
Introduction
Ultrahigh-field(UHF) offers dual benefits for Arterial Spin Labeling (ASL), including increased SNR and prolonged T1 to overcome the limitations of ASL in terms of low SNR and arterial transit effects. However, challenges remain for implementing ASL at UHF, including B1/B0 inhomogeneities and RF power deposition. The goal of this work was to optimize and evaluate three types of adiabatic pulses for pulsed ASL (PASL) at 7T including Hyperbolic Secant (HS)[1] WURST[2] and FOCI[3] pulses using theoretical simulation, phantom and in vivo scans.Method
- Loss function definition
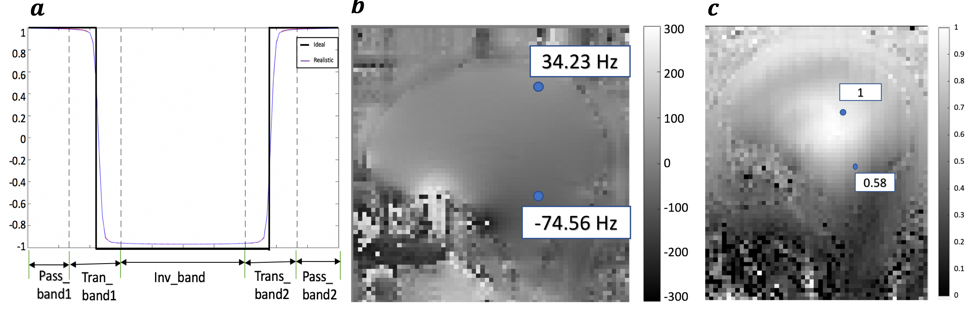
The inversion profile can be described by three regions: passband, transition band and inversion band (Fig.1a). Two metrics were calculated: the uniformity of inversion/passband (as in Eq.1) which is most relevant for ASL quantification, and the inversion efficiency (Eq.2) that determines ASL signal strength. A weight of 100 was chosen to combine the two(Eq.3) to achieve a balance between efficiency and uniformity.
$$ loss1 = \frac{N_{PassBand}\cdot std(PassBand)+N_{InvBand}\cdot std(InvBand)}{N_{PassBand}+N_{InvBand}}......................Eq.(1)$$
$$ loss2 = \sqrt{\frac{([Ideal_{PassBand},Ideal_{InvBand}]-{[Real_{PassBand},Real_{InvBand}]})^{2}}{N_{PassBand}+N{InvBand}}}……………Eq.(2)$$
$$ loss = loss1 + weight*loss2 ………………...............................….Eq.(3)$$
- Pulse parameter optimization
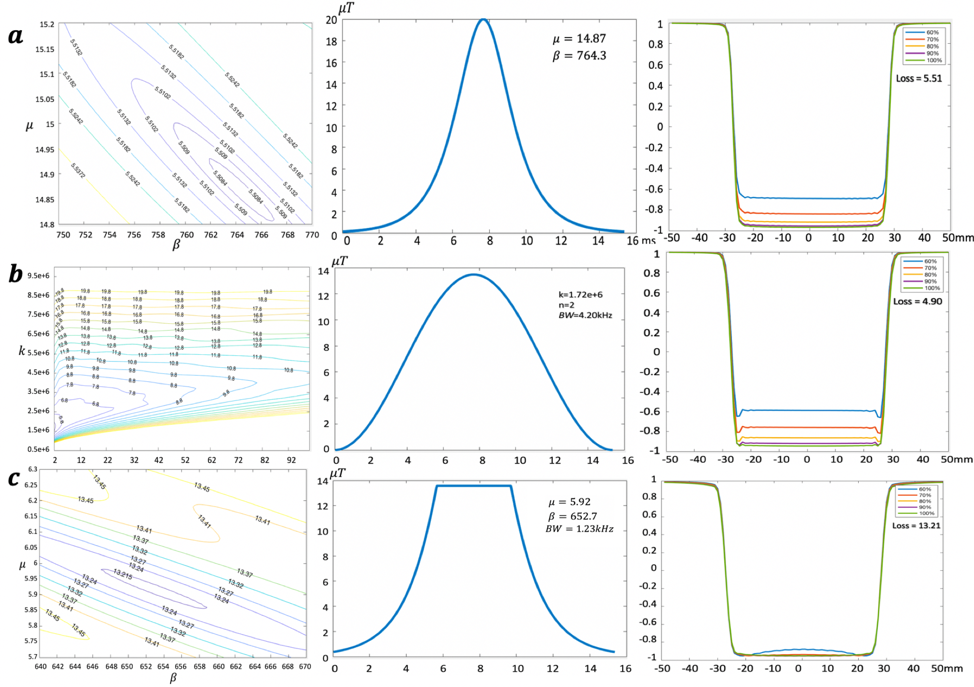
The expressions of HS, WURST and FOCI pulses are shown as Eq. 4,5,6 respectively. Each of them was defined with two parameters (HS: $$$\mu$$$, $$$\beta$$$; WURST: k, n; FOCI: $$$\mu$$$, $$$\beta$$$). To inform simulation, in-vivo B0/B1 maps (25yr male volunteer) were acquired on a 7T Siemens Terra scanner. Based on B0/B1 maps, B0 offset was considered with 300Hz, 0, -300Hz linear shift in z-direction, and B1 inhomogeneity was considered by 60%, 70%, 80%, 90%, 100% scaling of the target B1. Bloch equation simulations were performed for the parameter space of the HS, WURST and FOCI pulses respectively, and the pulses with the lowest loss were used for experiments.
$$ \left\{\begin{matrix} \left | B_{1}(t) \right |=Sech(\beta t)\\ \Delta \omega (t)=- \mu \beta tanh(\beta t) \end{matrix}\right. ………………....................…….Eq.(4)$$
$$ \left\{\begin{matrix} \phi (t) = \phi _{0}+\frac{1}{2}kt^{2}\\ \omega _{1}(t) = \omega _{1}(max)(1-\left | sin(\beta t)\right |^n) \end{matrix}\right. ……….....……....………..Eq.(5)$$
$$ \left\{\begin{matrix} A(t) = \frac{1}{Sech(\beta t)} ,when \,Sech(\beta t)>0.5\\ =2 \,otherwise\\ \omega _{1}(t) = \omega _{1}(max)(1 - \left | sin(\beta t) \right |^n),B _{1}(t) = B_{1}(max)(1-\left | sin(\beta t)\right |^n) \end{matrix}\right. ........Eq.(6)$$
- Phantom experiments
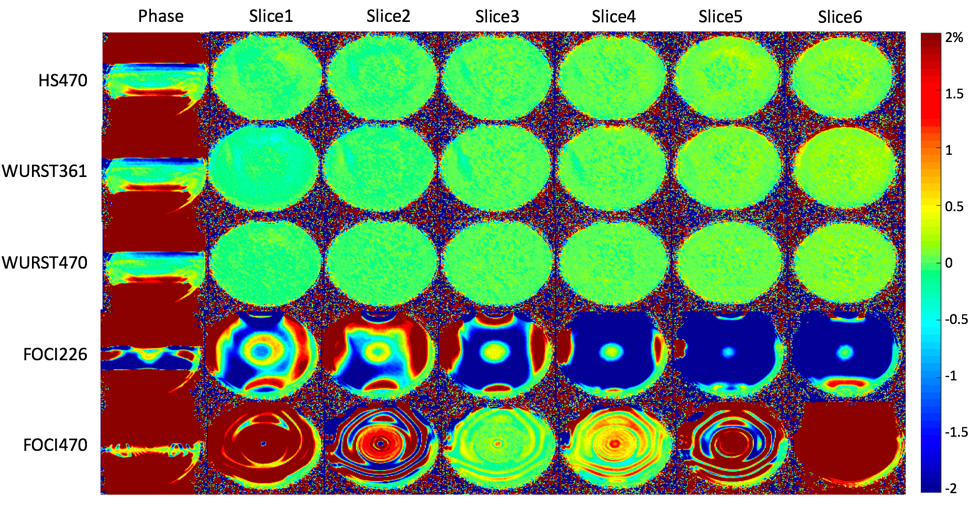
The optimized HS, WURST and FOCI pulses were implemented in a Flow Attenuated Inversion Recovery (FAIR) sequence, with a single-shot turbo flash readout (TR=4000ms, selective/non-selective inversion thickness=60mm/300mm, PLD=1200ms, slice number=8, slice TR=174ms, FOV=200mm, matrix size=64*64, phase partial Fourier=6/8, 40 measurements for 2min40sec). Inversion was applied first along phase-encoding direction to evaluate the inversion profiles, and then along slice direction for evaluation of the residual signal. RF amplitudes were set so that the HS is applied at hardware-allowed maximum B1 amplitude (with peak RF transmit voltage), and WURST and FOCI pulses had the same SAR to that of HS. Then maximum B1 was also applied for WURST and FOCI. Pairwise subtraction of label/control images was performed followed by averaging to generate the mean fractional signal vs. M0.
- In-vivo experiments
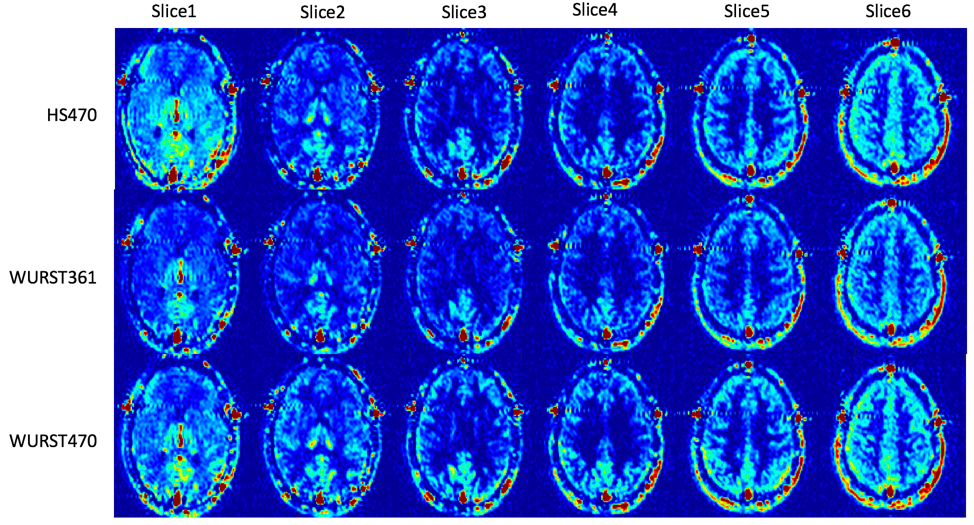
The same imaging protocol as in phantom experiment was applied. The perfusion signal was calculated as average of subtraction images, and the average fractional perfusion signal vs. M0 was calculated using a grey matter mask in each slice.
Results
Simulation results are shown in Fig.2. Figure 3 shows the mean subtracted images in phantom. Both subtracted images along phase and slice direction show that FOCI, even with raised voltage, suffers from a non-uniform inversion band, thereby was excluded for further experiments. HS and WURST pulses both show acceptable results (residual signal <0.5%) in phase and slice directions, and WURST470(470 being the voltage) has the lowest residual signal (0.3%). In-vivo experiment results are shown in Fig.4. Perfusion signal can be seen with each pulse. The mean % perfusion signal is 0.41$$$\pm $$$0.15, 0.33$$$\pm$$$ 0.08, 0.43$$$\pm 0.09$$$% for the HS470, WURST361 and WURST 470 respectively. WURST470 has the highest perfusion signal with the least SD/mean ratio across slices, suggesting the highest labeling efficiency and relatively uniform inversion profile. The in-vivo results are consistent with simulation results.Discussion and Conclusion
Although designed with a sharp transition band, the FOCI pulse has an overall high loss in simulation. Its inversion profile in phantom experiments was non-uniform, which may be due to its sensitivity to B1 inhomogeneities as reported previously[3], thus not be suitable for 7T PASL. The WURST and HS pulses have similar performance in simulation and phantom experiments, while in-vivo experiment showed more robust performance of WURST especially with raised voltage (WURST470). Although it has higher SAR, the increased SAR can be offset by a longer TR at 7T. In summary, WURST has the lowest loss in simulation and outperforms HS/FOCI in experiments. The optimized WURST pulse with the maximally allowed B1 is preferred to HS and FOCI pulses for adiabatic inversion in 7T PASL.Acknowledgements
No acknowledgement found.References
[1] Silver MS. Highly selective Pi/2 and Pi pulse generation. J Magn Res 1984;59:347–351.
[2] Kupce, E., & Freeman, R. (1995). Adiabatic pulses for wideband inversion and broadband decoupling. Journal of Magnetic Resonance, Series A, 115(2), 273-276.
[3] Ordidge, Roger J., et al. "Frequency offset corrected inversion (FOCI) pulses for use in localized spectroscopy." Magnetic resonance in medicine 36.4 (1996): 562-566.
Figures