2807
Observation of Iron Deposition in Cynomolgus Monkeys with the Parkinson’s Disease using Quantitative Susceptibility Mapping at 7T MRI1Bio-Analytical Science, University of Science & Technology, Cheongju, Korea, Republic of, 2Bioimaging Research Team, Korea Basic Science Institute, Cheongju, Korea, Republic of, 3National Primate Research Center, Korea Research Institute of Bioscience and Biotechnology, Cheongju, Korea, Republic of
Synopsis
The anatomic sensitivity of iron deposition in the Parkinson’s disease (PD) study remains controversial with exception of the substantia nigra (SN). A 14-year-old PD-modeled cynomolgus monkey and an age-matched healthy control were scanned at 7T MRI. The average susceptibility ratio of the caudate nucleus, putamen, thalamus (TH) and SN
Introduction
Parkinson’s disease (PD) is one of the most common neurodegenerative diseases. The pathogenesis of PD has been reported that the dopaminergic neurons are lost in the substantia nigra (SN) pars compacta progressively, leading to the second change in basal ganglia1,2. Although various MRI techniques were used to diagnose PD, quantitative susceptibility mapping (QSM) to measure iron deposition has been demonstrated as a prominent method2-5. However, the anatomic sensitivity of iron deposition in PD study remains controversial with exception of the SN. In this study, we show our observations on more iron deposition in the nigrostriatal pathway (NSP) with PD-modeled cynomolgus monkey and healthy control.Methods
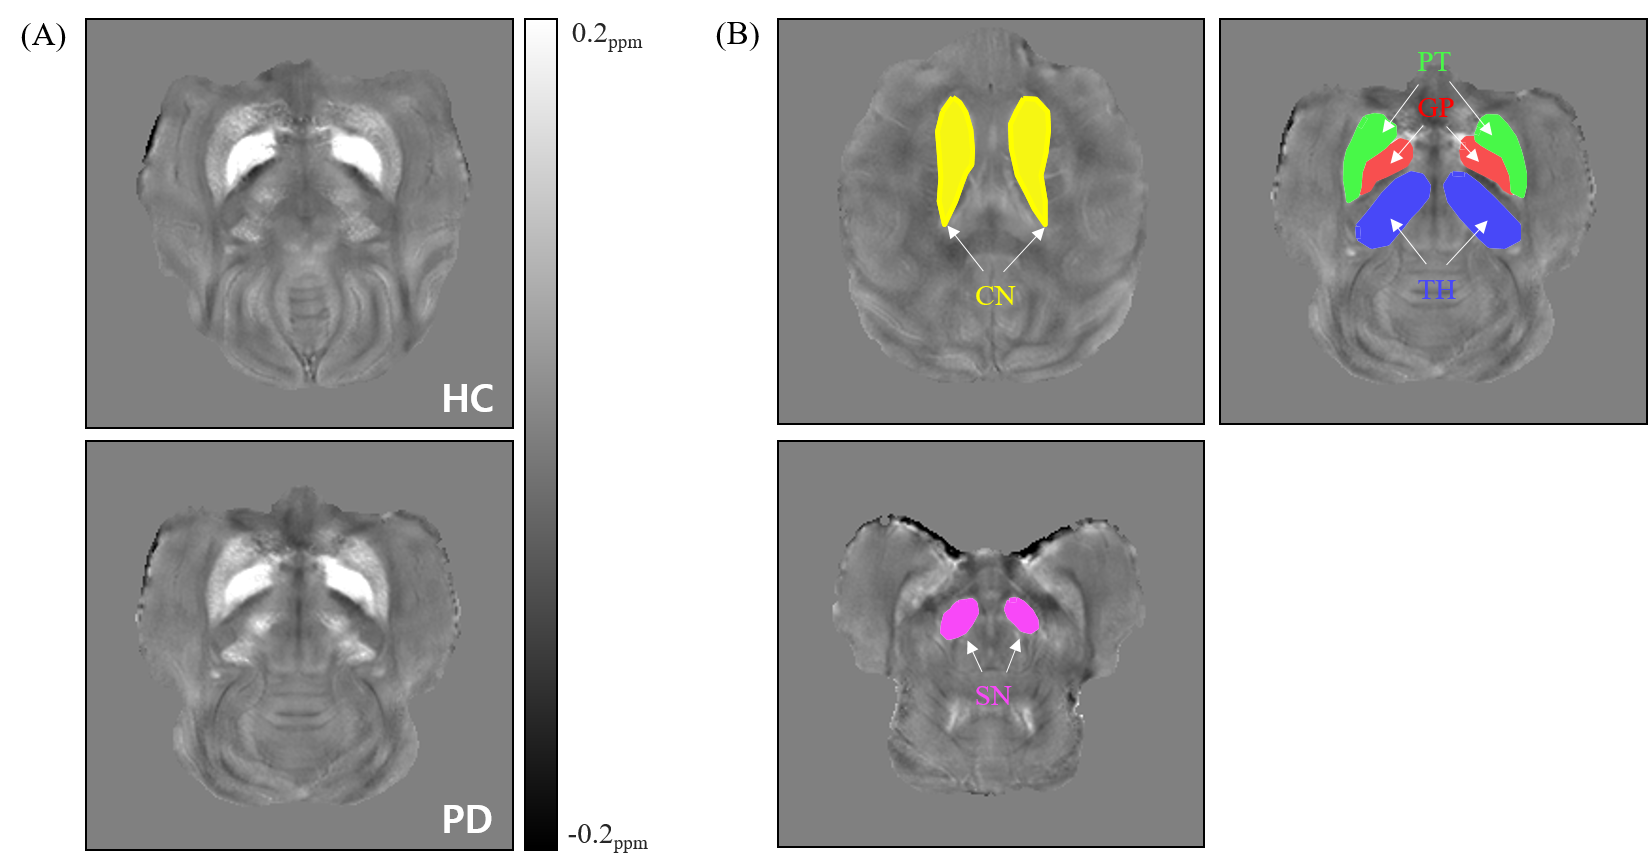
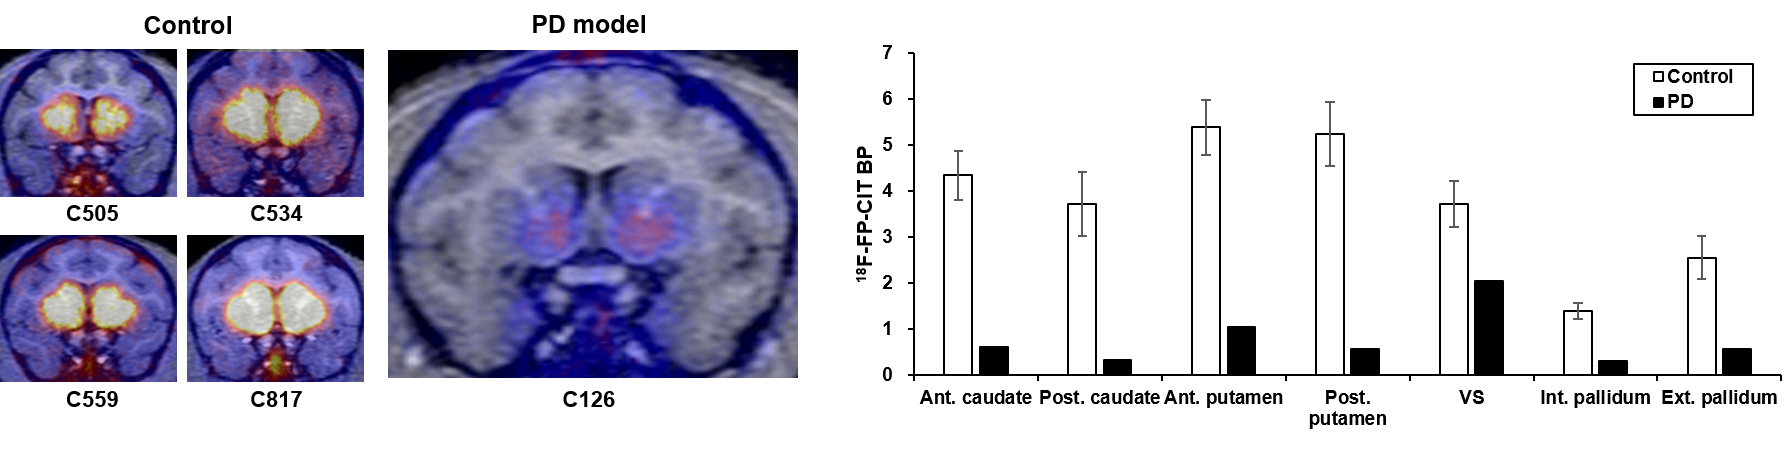
A 14-year old PD-modeled cynomolgus monkey and an age-matched healthy control were scanned at 7T MRI (Achieva, Philips). 3D multi-echo gradient echo (mGRE) with flow compensation was acquired for QSM as well as 3D T1w images. The parameters of mGRE were as follows; TR=90 ms, TE=first 4.6/spacing 4.4 ms, echo number=4, FOV=100×100 mm2, voxel size=0.297×0.297 mm2, slice thickness=1 mm, flip angle=22 degrees, water-fat shift=1.78 Hz/pixel. The QSM images were reconstructed using the STI Suite5, which includes the Laplacian phase-unwrapping, the variable-kernel-sophisticated-harmonic-artifact-reduction-for phase data (V-SHARP) for background phase removal, and the least-square orthogonal-and-right-triangular-decomposition (LSQR) for field-to-susceptibility-inversion (Fig. 1A). To observe the iron deposition in the NSP, first, all images from the control were registered to the images from the PD. Subsequently, each anatomical region (SN, GP=globus pallidus, PT=putamen, CN=caudate nucleus, TH=thalamus) was manually segmented using MATLAB built-in functions for quantitative analysis of the susceptibility values of PD model and the control monkey (Fig. 1B). We also performed PET-CT scans (nanoScan, Mediso Ltd) to verify the dopamine activities in PD and control, with injection of [18F] N-(3-fluoropropyl)-2ß-carboxymethoxy-3ß-(4-iodophenyl) nortropane (18F-FP-CIT)6.Results
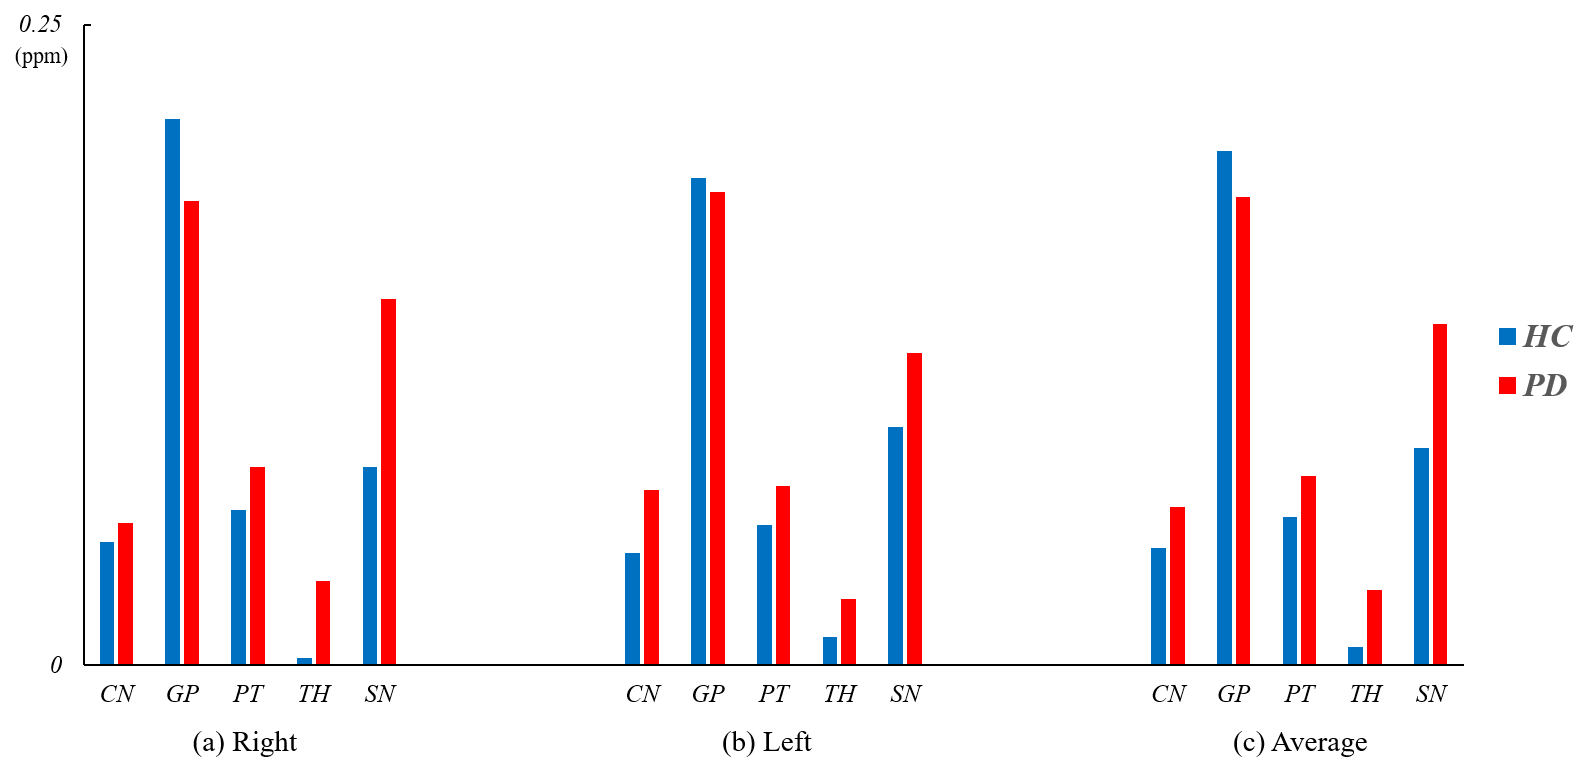
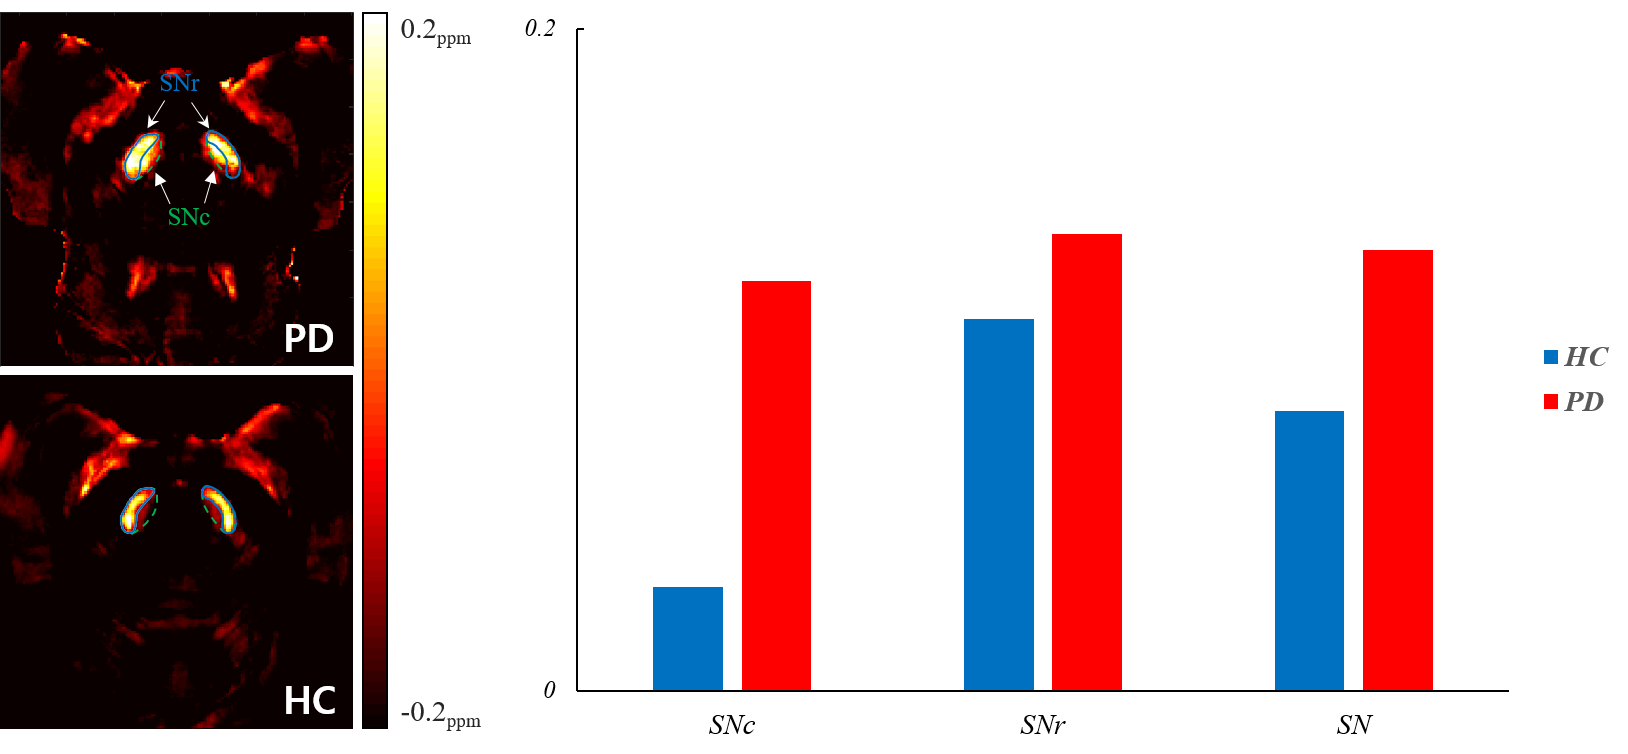
The QSM values at each anatomical region in both left and right brain region were averaged. Compared to control, QSM values of PD model tends to be increased (Fig. 2), except GP (-9.73%) region. The averaged susceptibility changes in CN, PT, TH, and SN were from 21 to 76 % (CN=25.73%, PT=21.71%, TH=76.19% and SN=36.44%). Additionally, the SN was subdivided into two regions, i.e. the SN pars compacta (SNc) and SN pars reticulate (SNr) as shown in Fig. 3 to monitor the variation of the SN as a biomarker of the PD. First, the region of high-susceptibility region of SN was selected to generate the SNc mask, since the signal intensity in the SN tends to be increased in PD3-5. The SNr, which shows more iron deposition in healthy subject1, was extracted. Then, the SNc region was determined by subtracting the SNr from the total SN volume. The increased iron deposition ratio between control and PD in the SNc was much higher than the SNr (SNc=74.7%, SNr=18.6%, Fig. 3). This results well support the findings from the former studies3-5. As we observed the increased susceptibility in the SNr region, we also found that the significantly increased susceptibility change in the TH region about 76.19% (0.0294 ppm in PD and 0.0070 ppm in control). Moreover, dopamine activity in the PD-modeled monkey was significantly decreased at PET scans as shown in Fig. 5. This possibly indicates that the TH could be one of the major diagnostic biomarker of PD.Discussion
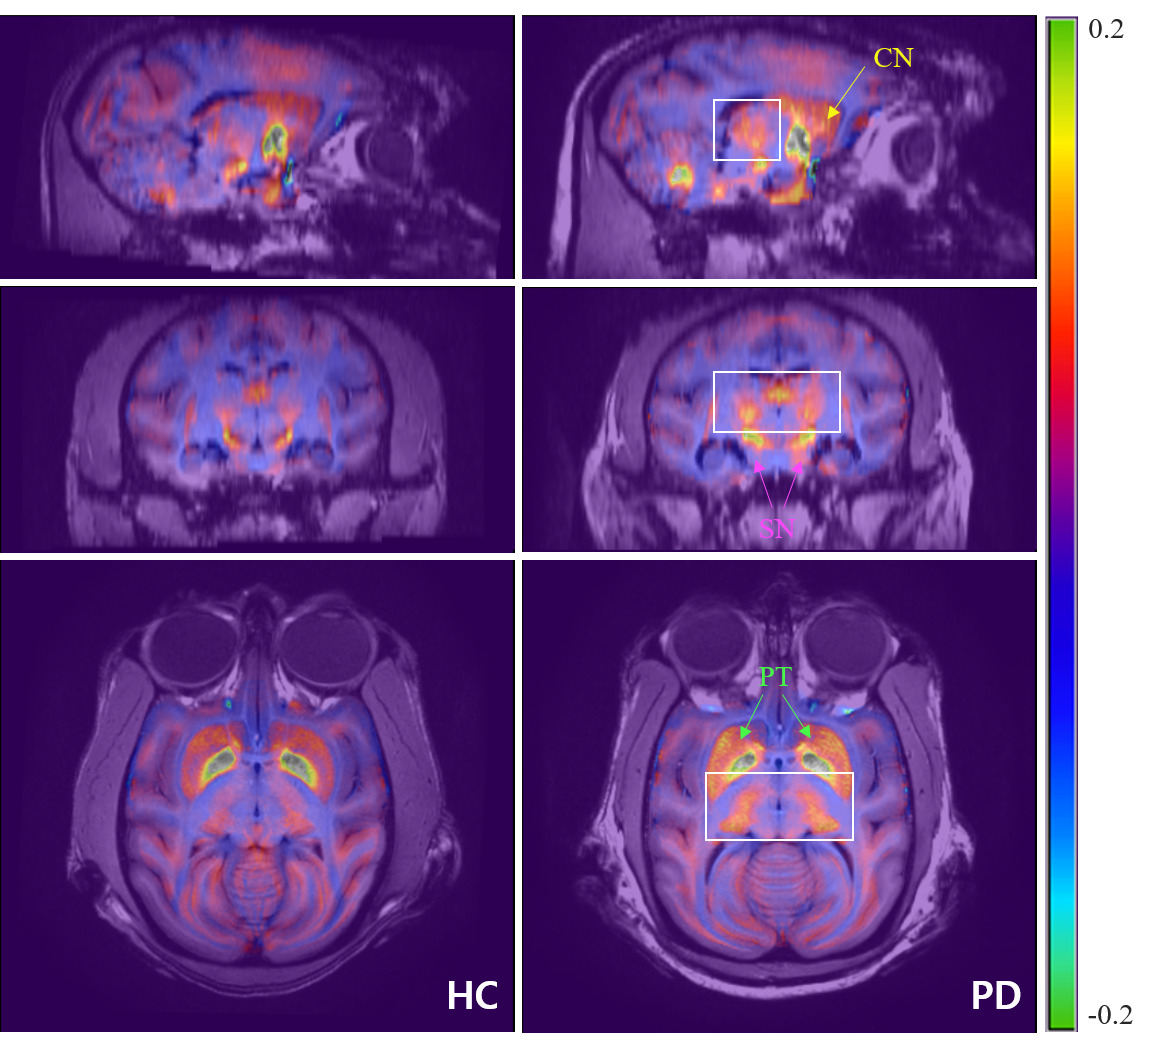
In this study, we employed the QSM to quantify the susceptibility difference in subcortical regions. We clearly figured out the overall elevation of iron deposition in the NSP of cynomolgus monkeys with PD model (Fig. 4). We also found notably increased iron deposition in the SNc and TH. The SN has been reported as a sensitive region of the iron deposition related to the severity of PD, which could classify into early or late PD5. Through our results, we verified that the SN is one of the primary anatomical structure in the view of PD diagnosis. On the other hand, we also figured out the tendency for the increased iron deposition in TH to affect the GABA activation. The NSP is a dopaminergic pathway that connects the SNc with the dorsal striatum, which consists of the PT and CN. They adjust the direct and/or indirect movement effects on the TH by synapsing dopaminergic neurons onto GABAergic neurons7,8, which well supports our hypothesis. That is, the loss of the dopaminergic neurons causes dysfunctional circuit within the basal ganglia, which resulted in the progressive and severe motor symptoms2,7. To validate the correlation with the movement in PD to the iron deposition with respect to the TH, further studies are needed with more non-primate disease models.Acknowledgements
This research was supported by the National Research Council of Science & Technology (NST) grant by the Korea government (MSIP) (No. CPS-18-02-KBSI).
References
1. Lehericy S, Bardinet E, Poupon C, Vidailhet M, Francois C. 7 Tesla magnetic resonance imaging: a closer look at substantia nigra anatomy in Parkinson's disease. Mov Disord. 2014;29(13):1574-81.
2. Alkemade A, de Hollander G, Keuken MC, Schafer A, Ott DVM, Schwarz J, et al. Comparison of T2*-weighted and QSM contrasts in Parkinson's disease to visualize the STN with MRI. PLoS One. 2017;12(4):e0176130.
3. Zhao X, An H, Liu T, Shen N, Bo B, Zhang Z, et al. Quantitative Susceptibility Mapping of the Substantia Nigra in Parkinson’s Disease. Applied Magnetic Resonance. 2017;48(6):533-44.
4. Langkammer C, Pirpamer L, Seiler S, Deistung A, Schweser F, Franthal S, et al. Quantitative Susceptibility Mapping in Parkinson's Disease. PLoS One. 2016;11(9):e0162460.
5. Guan X, Xuan M, Gu Q, Huang P, Liu C, Wang N, et al. Regionally progressive accumulation of iron in Parkinson's disease as measured by quantitative susceptibility mapping. NMR Biomed. 2017;30(4).
6. Kazumata K, Dhawan V, Chaly T, Antonini A, Margouleff C, Belakhlef A, Neumeyer J, Eidelberg D. Dopamine transporter imaging with fluorine-18-FPCIT and PET. J Nucl Med, 1998; 39: 1521-30.
7. Tritsch NX, Ding JB, Sabatini BL. Dopaminergic neurons inhibit striatal output through non-canonical release of GABA. Nature. 2012;490(7419):262-6.
8. Cass WA, Grondin R, Andersen AH, Zhang Z, Hardy PA, Hussey-Andersen LK, et al. Iron accumulation in the striatum predicts aging-related decline in motor function in rhesus monkeys. Neurobiol Aging. 2007;28(2):258-71.
Figures