2805
Longitudinal Study of APT-weighted CEST in the Brain at 7T in Patients with Multiple Sclerosis1Department of Radiology and Radiological Sciences, Vanderbilt University Medical Center, Nashville, TN, United States, 2Vanderbilt University Institute of Imaging Science, Vanderbilt University Medical Center, Nashville, TN, United States, 3Department of Biomedical Engineering, Vanderbilt University, Nashville, TN, United States, 4The Russell H. Morgan Department of Radiology, The Johns Hopkins University School of Medicine, Baltimore, MD, United States, 5F.M. Kirby Research Center for Functional Brain Imaging, Kennedy Krieger Institute, Baltimore, MD, United States, 6University of Maryland School of Medicine, Baltimore, MD, United States, 7Department of Neurology, University of Maryland School of Medicine, Baltimore, MD, United States
Synopsis
Amide proton transfer weighted chemical exchange saturation transfer (APTw-CEST) MRI has been applied with whole-brain coverage in a longitudinal study in patients with relapsing-remitting, secondary progressive, and primary progressive multiple sclerosis (MS). APTw-CEST is sensitive to amide protons on proteins and peptides and may provide insight into the pathological processes underlying symptoms and disease progression in MS. Our preliminary results show increased APTw-CEST contrast in relapsing-remitting MS patients and decreased contrast in primary progressive MS patients, as well as differences in CEST contrast in lesions for these disease subtypes.
Purpose
Neuroimaging with MRI is integral to diagnosis and monitoring of disease in multiple sclerosis (MS). However, conventional clinical T1- and T2-weighted MRI methods do not provide insight into underlying pathological processes contributing to disease symptoms such as cognitive impairment. Chemical exchange saturation transfer (CEST) MRI is a technique that allows for indirect detection of low-concentration, mobile metabolites through exploitation of the solute-to-water proton exchange process.1 Because it is sensitive to tissue biochemistry such as protein content2 and neurochemicals,3,4 CEST MRI may serve as a quantitative technique for detecting early, microscopic abnormalities in normal-appearing tissue prior to the appearance of macroscopic damage (i.e. lesions). The feasibility of applying amide proton transfer weighted (APTw)-CEST MRI to probe abnormal protein/peptide accumulation in the brain in MS patients has been previously demonstrated at 7T,2 but to date no studies have been performed to evaluate the temporal evolution of APTw-CEST and examine correlations with clinical symptoms. Here, we seek to study longitudinal changes in APTw-CEST contrast in the brain with annual 7T MRI scans in MS patients in combination with clinical assessment of cognitive function, gait, and upper extremity function.Methods
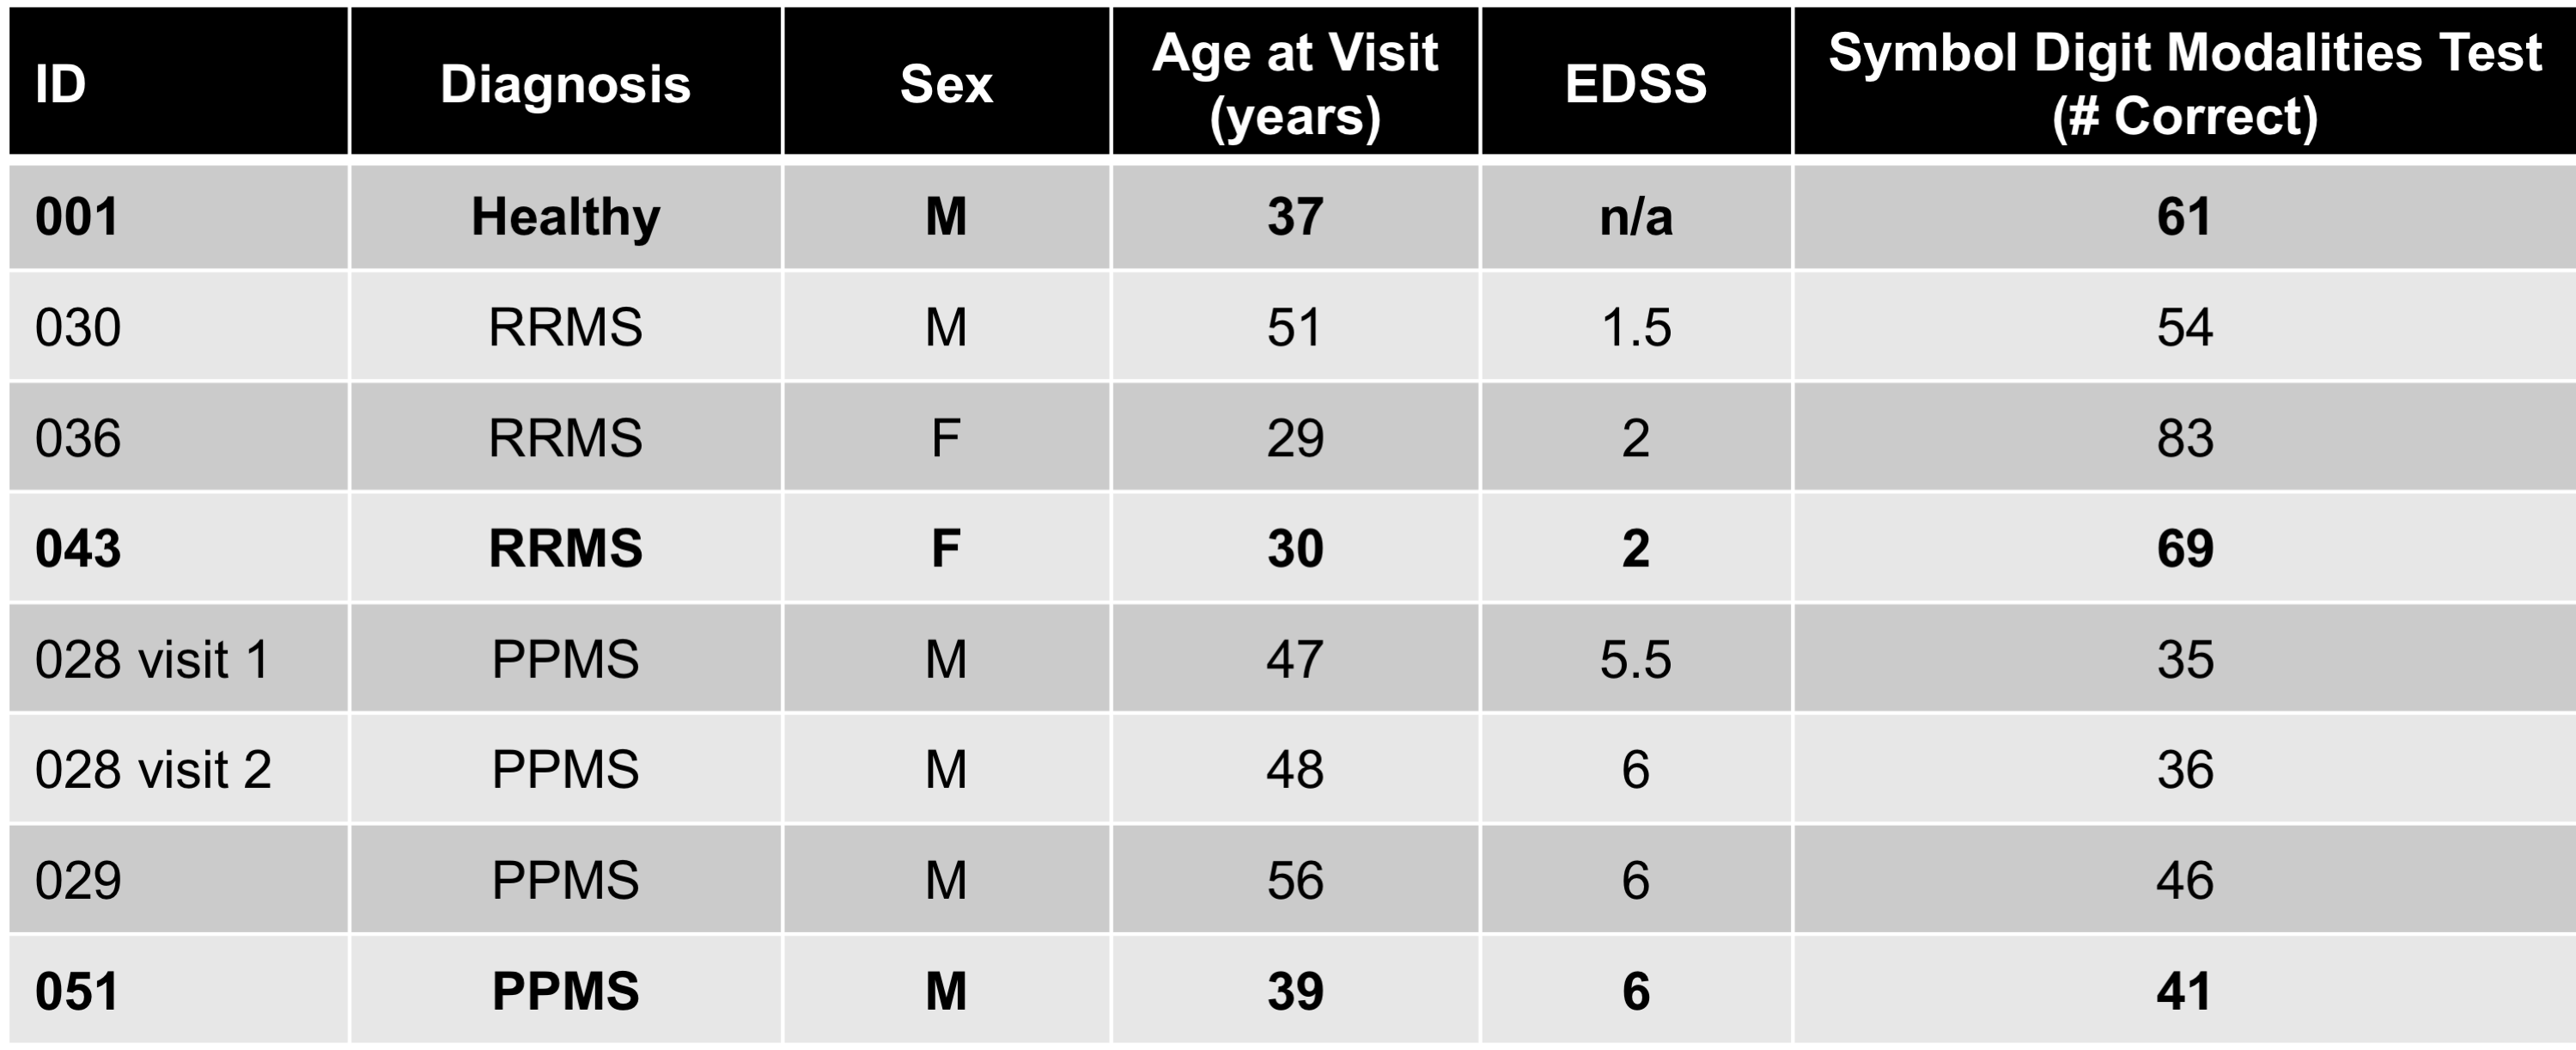
After signed, informed consent, 35 MS patients (26-63 years old, 17F/8M relapsing-remitting (RRMS), 4F/0M secondary progressive (SPMS), 1F/5M primary progressive (PPMS)) and 5 healthy volunteers (30-58 years old, 1F/4M) were enrolled for a longitudinal study with MRI and clinical data acquired annually. Imaging was performed at 7.0T (Philips Achieva) with a quadrature transmit head coil and 32-channel receive coil (Nova Medical). Whole-brain CEST data were acquired using a 3D pulsed steady-state CEST approach developed by Jones et al.5 The 6min:10sec CEST sequence consisted of a 3D segmented multi-shot gradient-echo (EPI factor 11) sequence with TR/TE/FA=71ms/7.6ms/12° across 50 slices at 2x2x2mm isotropic resolution. The parallel imaging SENSE factor was 2RLx2AP. A 1μT (peak power), 25ms single-lobe sinc-gauss saturation pulse preceded each excitation. Volumes were acquired at 58 frequency offsets (Δω between +/-18.0ppm) with 14 interspersed, unsaturated reference volumes (S0). MP2RAGE6 was acquired for segmentation purposes. Clinical disability was assessed using the MS Functional Composite,7 Expanded Disability Status Scale (EDSS) scores,8 and additional cognitive tests including the symbol digit modalities test.
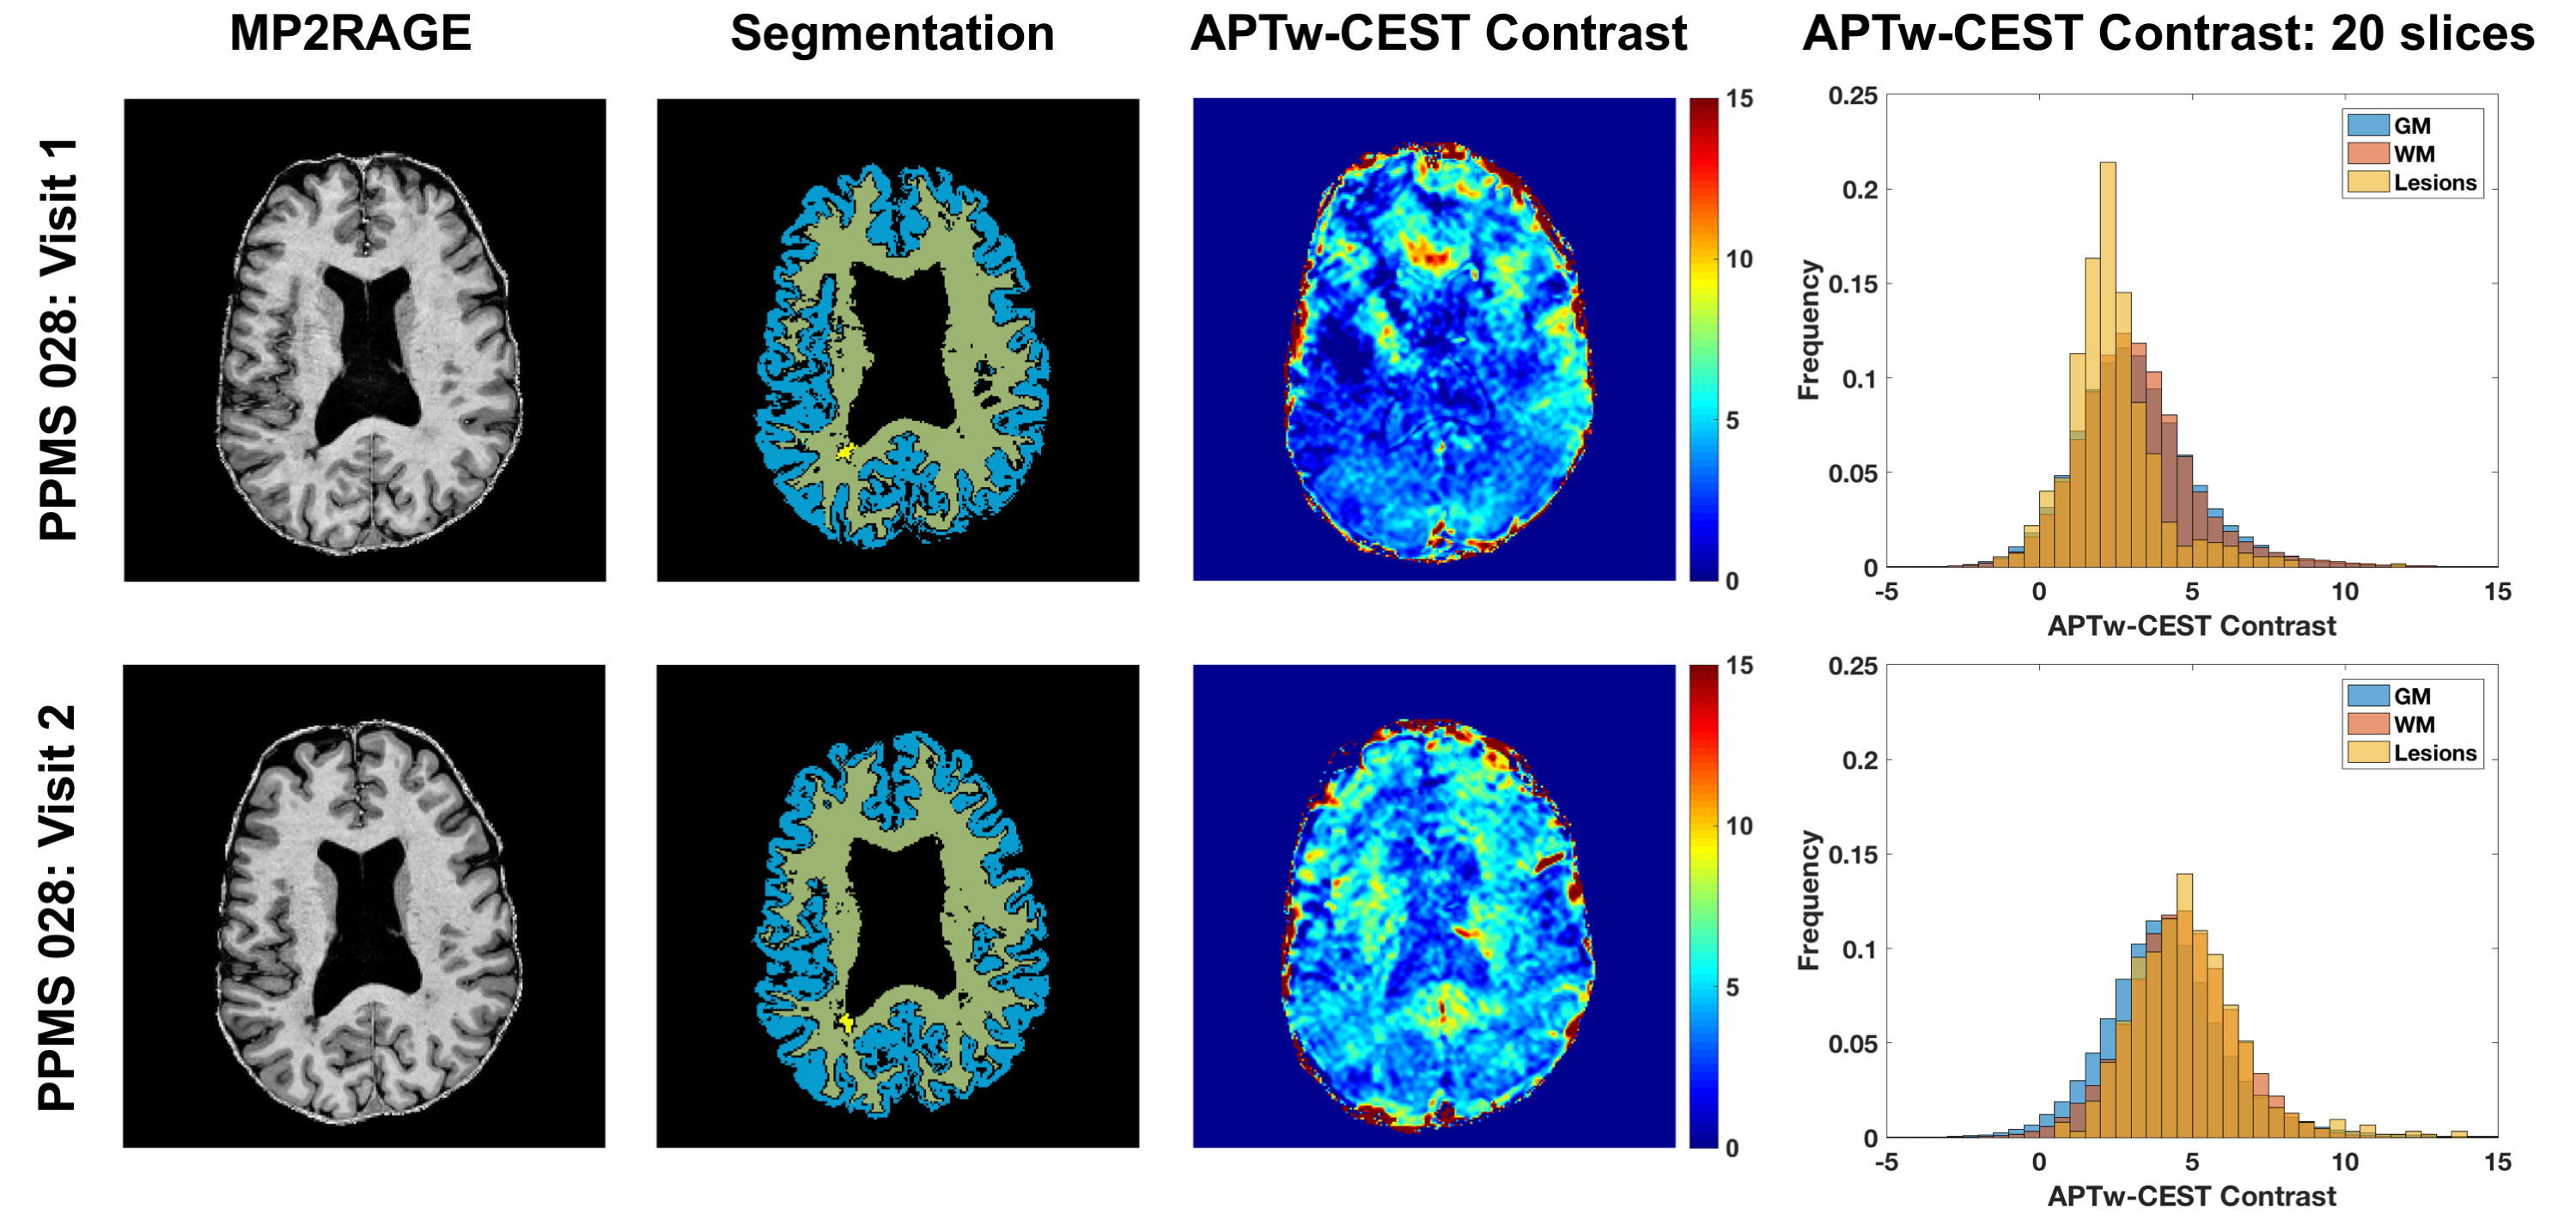
CEST volumes were co-registered using affine registration (FLIRT in FSL9) and normalized to a spline fit of the S0 data.10 For each voxel, a subset of the z-spectrum was used to fit the direct saturation contribution with a Lorentzian line shape, which was used to correct z-spectra for B0 inhomogeneity. The Lorentzian difference was calculated as described previously.5 APTw-CEST contrast was quantified as the mean Lorentzian difference from 3.3-3.7ppm. MP2RAGE images were used to generate segmented tissue masks for gray and white matter (GM and WM) in SPM12 and WM lesion masks by manual demarcation. MP2RAGE images were co-registered to the CEST volume and the associated masks were transformed to CEST space. Regions of interest consisted of segmented GM, WM, and lesions across 20 axial slices with the top of the thalamus serving as the inferior boundary.
Results
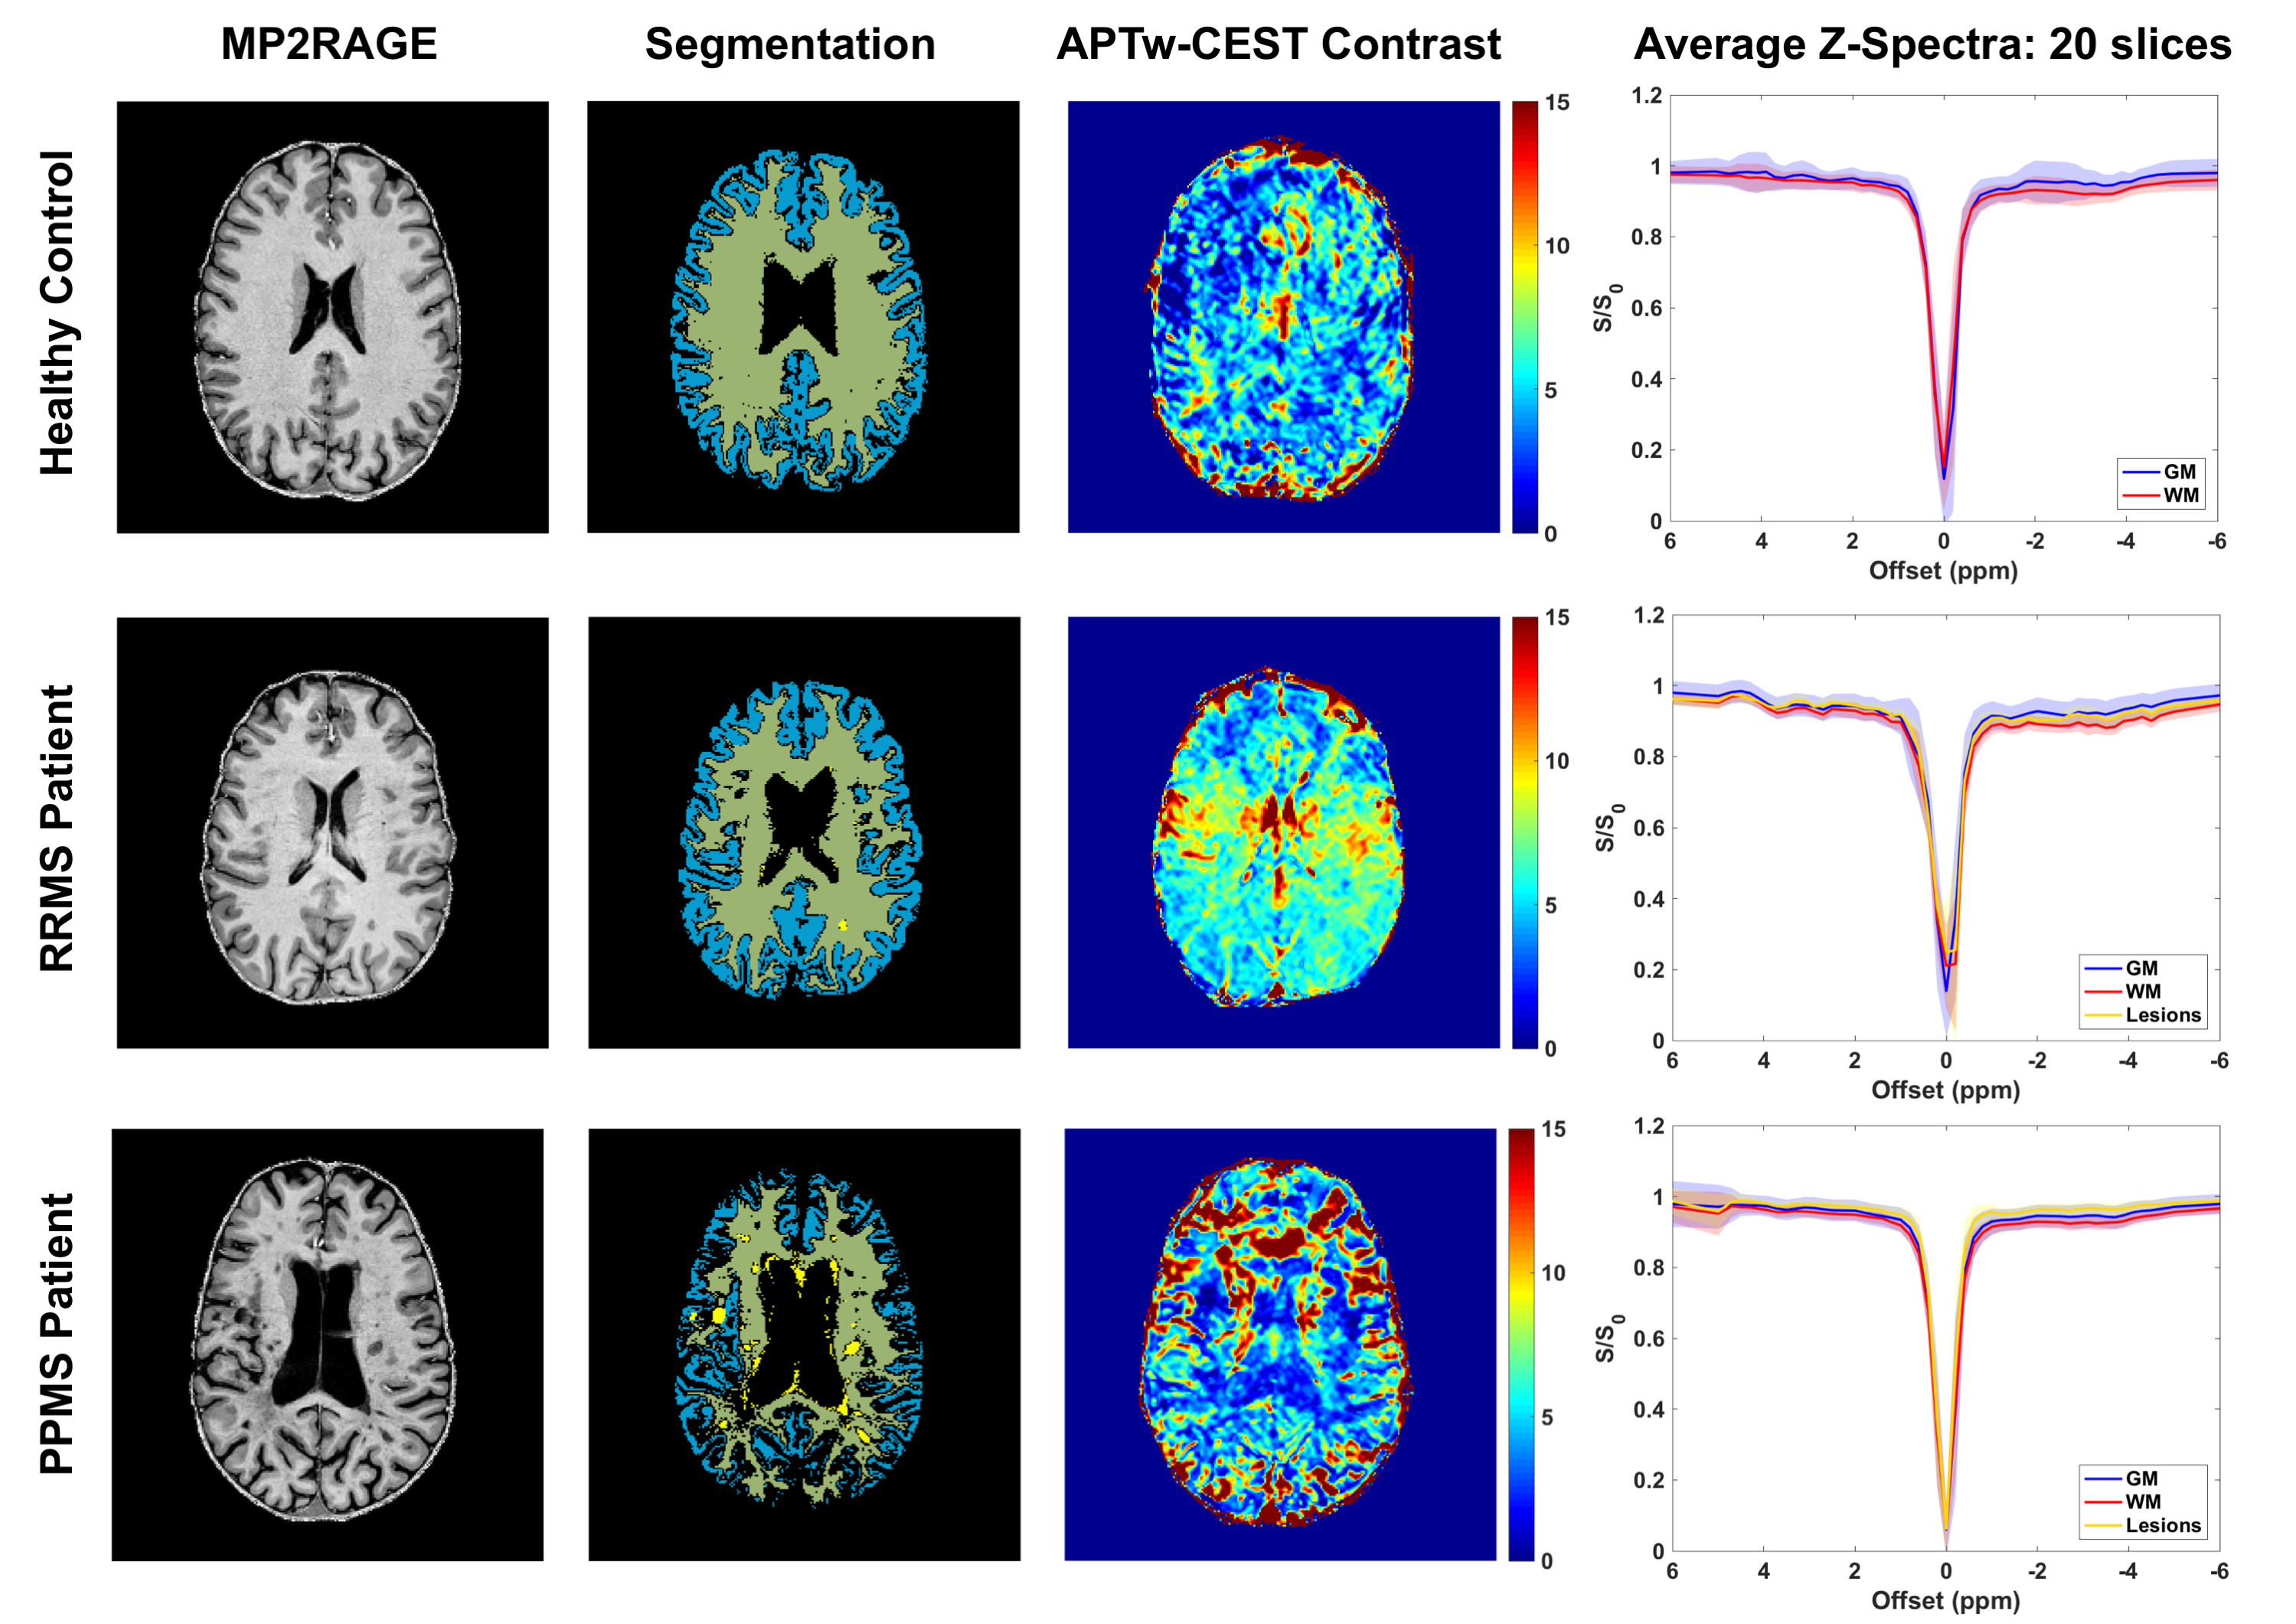
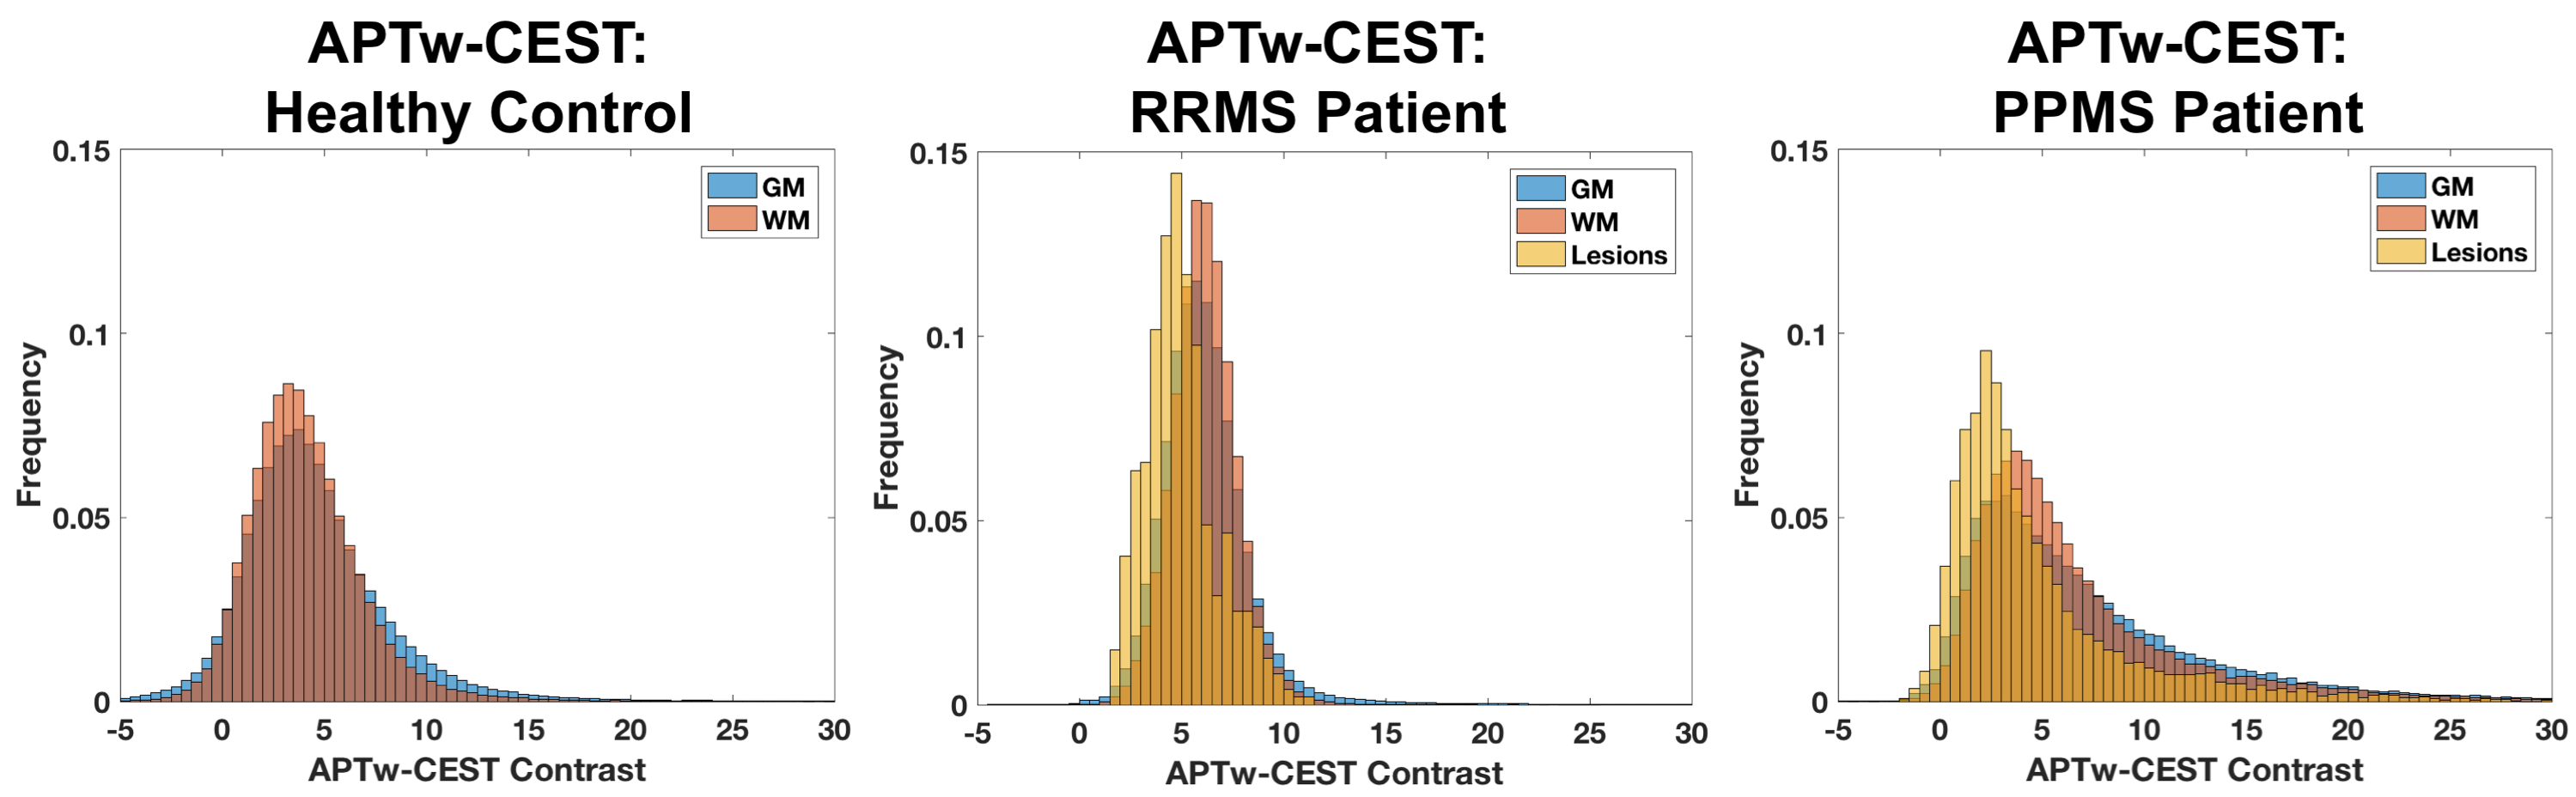
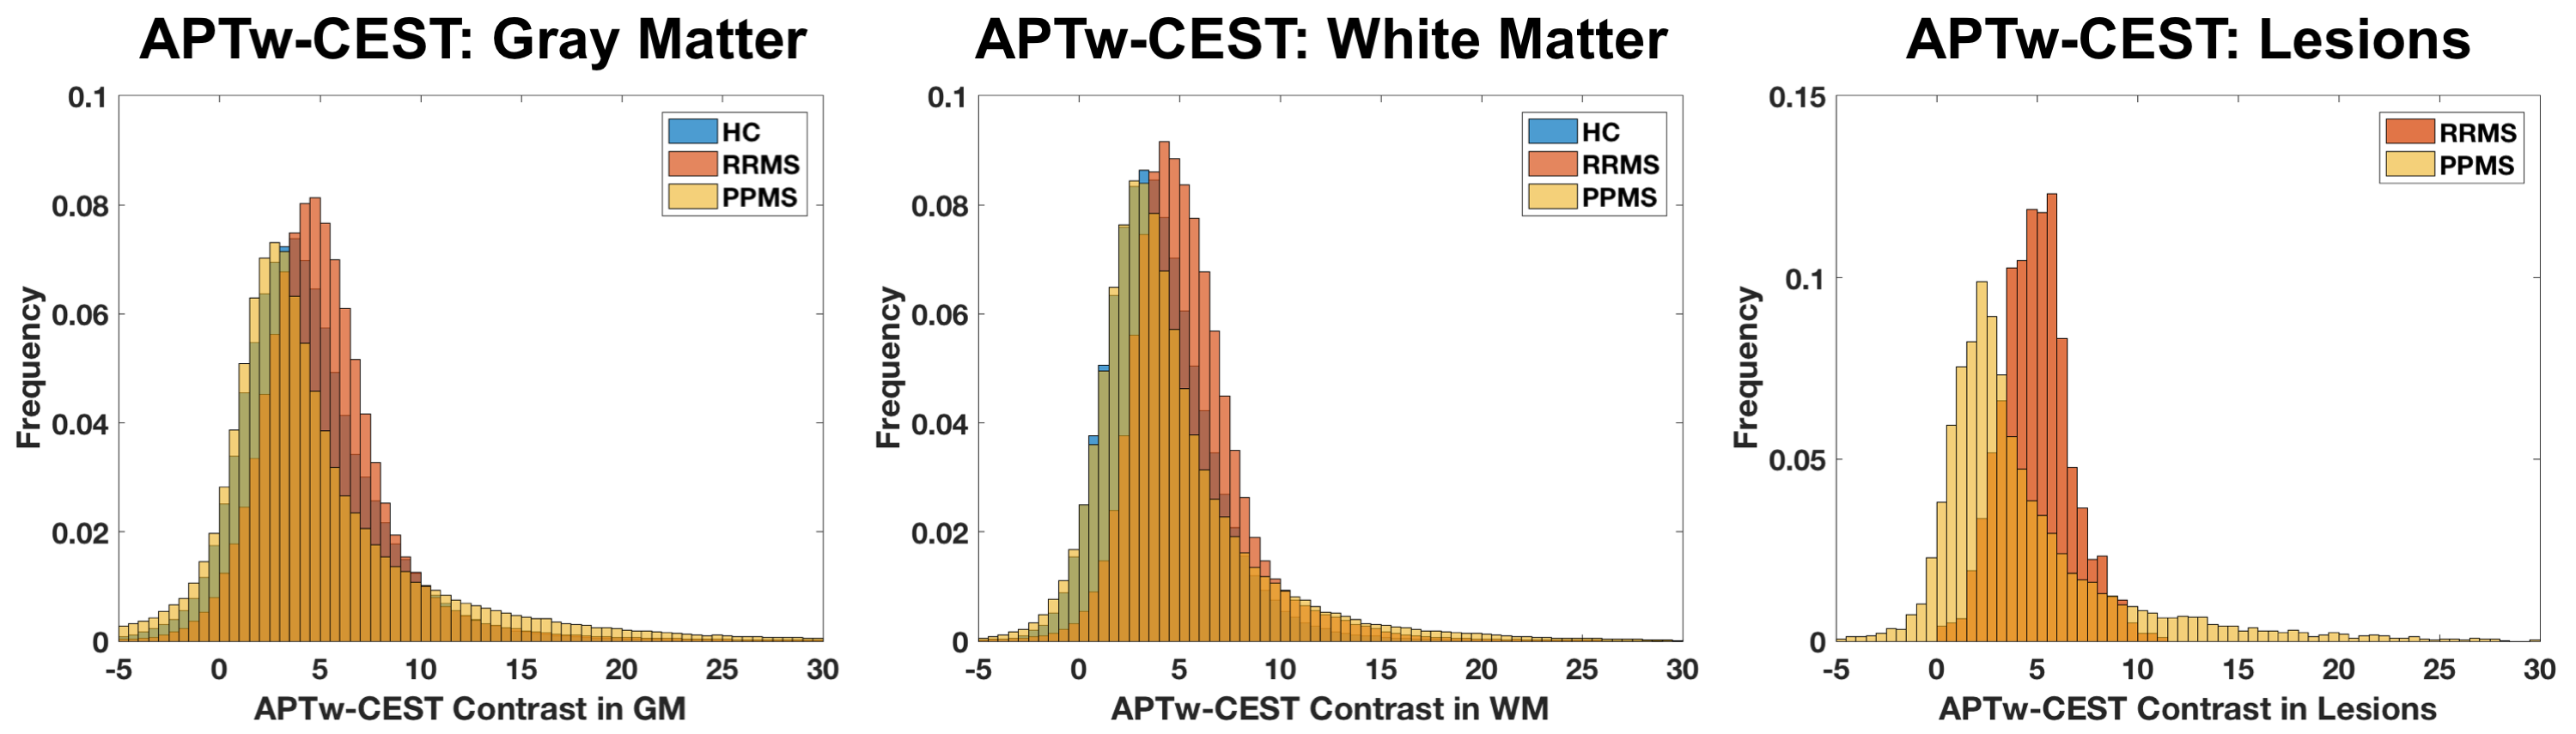
Preliminary analyses for three RRMS patients, three PPMS patients, and one healthy volunteer (Table 1) are presented from this ongoing study. Figure 1 shows anatomical images, segmentation, APTw-CEST, and average z-spectra for 1 subject per group. There is an apparent increase in WM APTw-CEST in the RRMS patient and a decrease in WM APTw-CEST in the PPMS patient. APTw-CEST histograms for these subjects are provided in Figure 2 and show differences in the CEST contrast distribution. Group averages in Figure 3 suggest that RRMS patients do in fact show an increase in APTw-CEST in both normal-appearing GM and WM relative to the control and PPMS patients, and APTw-CEST in WM lesions differs between RRMS and PPMS patients. Lastly, preliminary longitudinal data are shown for a PPMS patient in Figure 4. At 1 year after visit 1, there is an apparent increase in APTw-CEST in GM, WM, and lesions.Discussion and Conclusions
In this work, whole-brain CEST data were acquired with a clinically feasible scan duration. The interfering effects of magnetization transfer (MT) and direct saturation were minimized with a low saturation pulse amplitude.5 Therefore, APTw-CEST contrast is more likely to be sensitive to protein content than myelin-related MT effects. Preliminary results indicate that APTw-CEST may be sensitive to differences in pathology between disease subtypes, such as increased cellularity in RRMS lesions11 and more axonal transection and oligodendrocyte death in PPMS lesions.12 In ongoing work, we will evaluate group differences and temporal changes across the entire study population and will examine correlations between APTw-CEST and clinical measures of cognitive and sensorimotor function.Acknowledgements
The authors would like to acknowledge all of the participants who volunteered for our study. Dr. O’Grady is supported by NIH/NINDS 1F32NS101788-01. The study was funded in part by grants from EMD-Serono and the National Institutes of Health (NINDS 1K23NS072366-01A1). Time for data analysis was also supported by 1R01NS104403-01.References
1. van Zijl PC, Zhou J, Mori N, et al. Mechanism of magnetization transfer during on-resonance water saturation. A new approach to detect mobile proteins, peptides, and lipids. Magn Reson Med 2003; 49: 440-449.
2. Dula AN, Asche EM, Landman BA, et al. Development of chemical exchange saturation transfer at 7 T. Magn Reson Med 2011; 66: 831-838.
3. Cai K, Haris M, Singh A, et al. Magnetic resonance imaging of glutamate. Nat Med 2012; 18: 302-306.
4. O'Grady KP, Dula AN, Lyttle BD, et al. Glutamate-sensitive imaging and evaluation of cognitive impairment in multiple sclerosis. Mult Scler 2018 (pub. online Sept. 19, 2018).
5. Jones CK, Polders D, Hua J, et al. In vivo three-dimensional whole-brain pulsed steady-state chemical exchange saturation transfer at 7 T. Magn Reson Med 2012; 67: 1579-1589.
6. Marques JP, Kober T, Krueger G, et al. MP2RAGE, a self bias-field corrected sequence for improved segmentation and T1-mapping at high field. Neuroimage 2010; 49: 1271-1281.
7. Fischer JS, Rudick RA, Cutter GR, et al. The Multiple Sclerosis Functional Composite Measure (MSFC): an integrated approach to MS clinical outcome assessment. National MS Society Clinical Outcomes Assessment Task Force. Mult Scler 1999; 5: 244-250.
8. Kurtzke JF. Rating neurologic impairment in multiple sclerosis: an expanded disability status scale (EDSS). Neurology 1983; 33: 1444-1452.
9. Jenkinson M and Smith S. A global optimisation method for robust affine registration of brain images. Medical image analysis 2001; 5: 143-156.
10. Jones CK, Huang A, Xu J, et al. Nuclear Overhauser enhancement (NOE) imaging in the human brain at 7T. Neuroimage 2013; 77: 114-124.
11. Bitsch A, Bruhn H, Vougioukas V, et al. Inflammatory CNS demyelination: histopathologic correlation with in vivo quantitative proton MR spectroscopy. American journal of neuroradiology 1999; 20: 1619-1627.
12. Bruck W, Lucchinetti C and Lassmann H. The pathology of primary progressive multiple sclerosis. Mult Scler 2002; 8: 93-97.
Figures