2802
Multi-modal 7T imaging of the Locus Coeruleus in healthy older adults1Department of Clinical Neurosciences, Wolfson Brain Imaging Centre, University of Cambridge, Cambridge, United Kingdom, 2Behavioural and Clinical Neuroscience Institute and Department of Psychology, University of Cambridge, Cambridge, United Kingdom, 3Department of Clinical Neurosciences, University of Cambridge, Cambridge, United Kingdom, 4Department of Psychology, Centre for Speech, Language and the Brain, University of Cambridge, Cambridge, United Kingdom, 5Medical Research Council Cognition and Brain Sciences Unit, Cambridge, United Kingdom
Synopsis
The Locus Coeruleus (LC) is the main source of cerebral noradrenaline, which modulates many cognitive domains from attention and motivation to mood and memory. However, the LC is a small structure located in the mid-brain, proven difficult to detect in-vivo. We studied healthy individuals using high-resolution MT-w, R2*, QSM, and fMRI at 7T to characterize the LC’s shape and size, magneto-chemical and functional properties. While no R2* or QSM contrast was found in the LC, it was clearly detected in MT-images and showed widespread functional connectivity towards cortex and cerebellum, These results are the benchmark for future studies in dementia.
Introduction
The human Locus Coeruleus (LC) is the main source of cerebral noradrenaline, which modulates many cognitive domains from attention and motivation to mood and memory1. Quantitative in vivo imaging of the LC therefore has broad interest in cognitive, ageing and dementia neurosciences. However, the LC is a small tubular structure (approx. 2x2x15 mm3 in size) located close to the fourth ventricle in the pons2. Clearly delineating the LC poses technical challenges in achieving sufficient contrast-to-noise, resolution and in avoiding artifacts.
Noradrenergic neurons of the LC produce neuromelanin (NM), which produces intrinsic contrast in magnetization-transfer-weighted (MT-w) images. This has been exploited at 3T and 7T3,4. The LC also accumulates iron, which might give contrast in R2*-weighted images or Quantitative Susceptibility Mapping (QSM). The concentration of neuromelanin in the LC increases but iron remains constant with age5,6.
We studied healthy individuals using high-resolution MT-w, R2* and QSM imaging at 7T to characterize the LC’s shape and size, and magneto-chemical properties. We also acquired high-resolution resting state fMRI which allowed the visualization of functional connectivity patterns based on a seed placed in the LC, as defined by the MT-w imaging.
Data Acquisition
Fifteen healthy volunteers (6 female, age 66.6±4.7 years) were scanned at 7T (Magnetom Terra, Siemens). A 3D MT-weighted sequence was developed3,4 applying a train of 20 RF-pulses at 6.72ppm off-resonance before a turbo-flash readout. Imaging parameters were: TE/TR=4.08/966ms, flip-angle=8º, voxel-size=0.4x0.4x0.5mm3, BW=140Hz/px, no acceleration, slices=112, 14.3%-oversampling, 7min TA. The inversion pulse was calibrated to 420º FA at the middle of the pons. Three MT sequence repeats were acquired per subject; a further repeat without the off-resonance pulses was also acquired. 3D multi-echo, 0.7mm isotropic T2*-weighted images were acquired transversely for QSM and R2* mapping: TE1/TR=4.68/27ms; 6 echoes, echo-spacing=3.24ms, FA=15º; BW=430Hz/px; acceleration-factor=2x2; FOV=224x196x157mm3; 7min TA; and Roemer coil combination7.
A 10 minute whole-brain 1.1mm isotropic resolution resting-state fMRI (rsfMRI) was acquired for functional connectivity analysis: 110 slices, TE/TR=24.8/1589ms, multi-band factor=5, FA=64º, partial-Fourier=6/8, iPat=2, BW=1838Hz/px, echo-spacing=0.78ms. Pulse-ox and respiratory traces were logged. For anatomical co-registration, 0.7mm isotropic MP2RAGE images were acquired8.
Data Analysis
The three MT-w runs were first concatenated with ANTs9, followed by manual segmentation of the LC performed using itksnap. A cylindrical reference region of 37mm3 was drawn starting at the apex of the 4th-ventricle in the middle of the pons, to calculate the LC Contrast-to-Noise Ratio ($$${CNR}=(\overline{LC}-\overline{Ref})/sd(Ref)$$$). Using ANTs, the LC ROIs were combined into a template prior to mapping to MNI152 2009b space11,12.
QSM data was obtained using the multi-scale dipole inversion algorithm in QSMbox10, with $$$\lambda=10^{2.7}$$$ as the optimal regularization term. Voxel-wise R2* maps were obtained by fitting an exponential curve to the magnitude signal decay.
rsfMRI pre-processing included motion, distortion and slice timing correction, registration to MNI152 2009a space, smoothing with a 3.3-mm isotropic Gaussian kernel, and band-pass filtering (0.009-0.1)Hz. A seed-to-voxel analysis for each subject was performed using the first principal component (PC#1) obtained from the LC-left and LC-right as seeds. Nuisance regressors included PCA#1s of WM, CSF and 4th-ventricle signals, in addition to RETROICOR13, and 24 head motion regressors.
Results
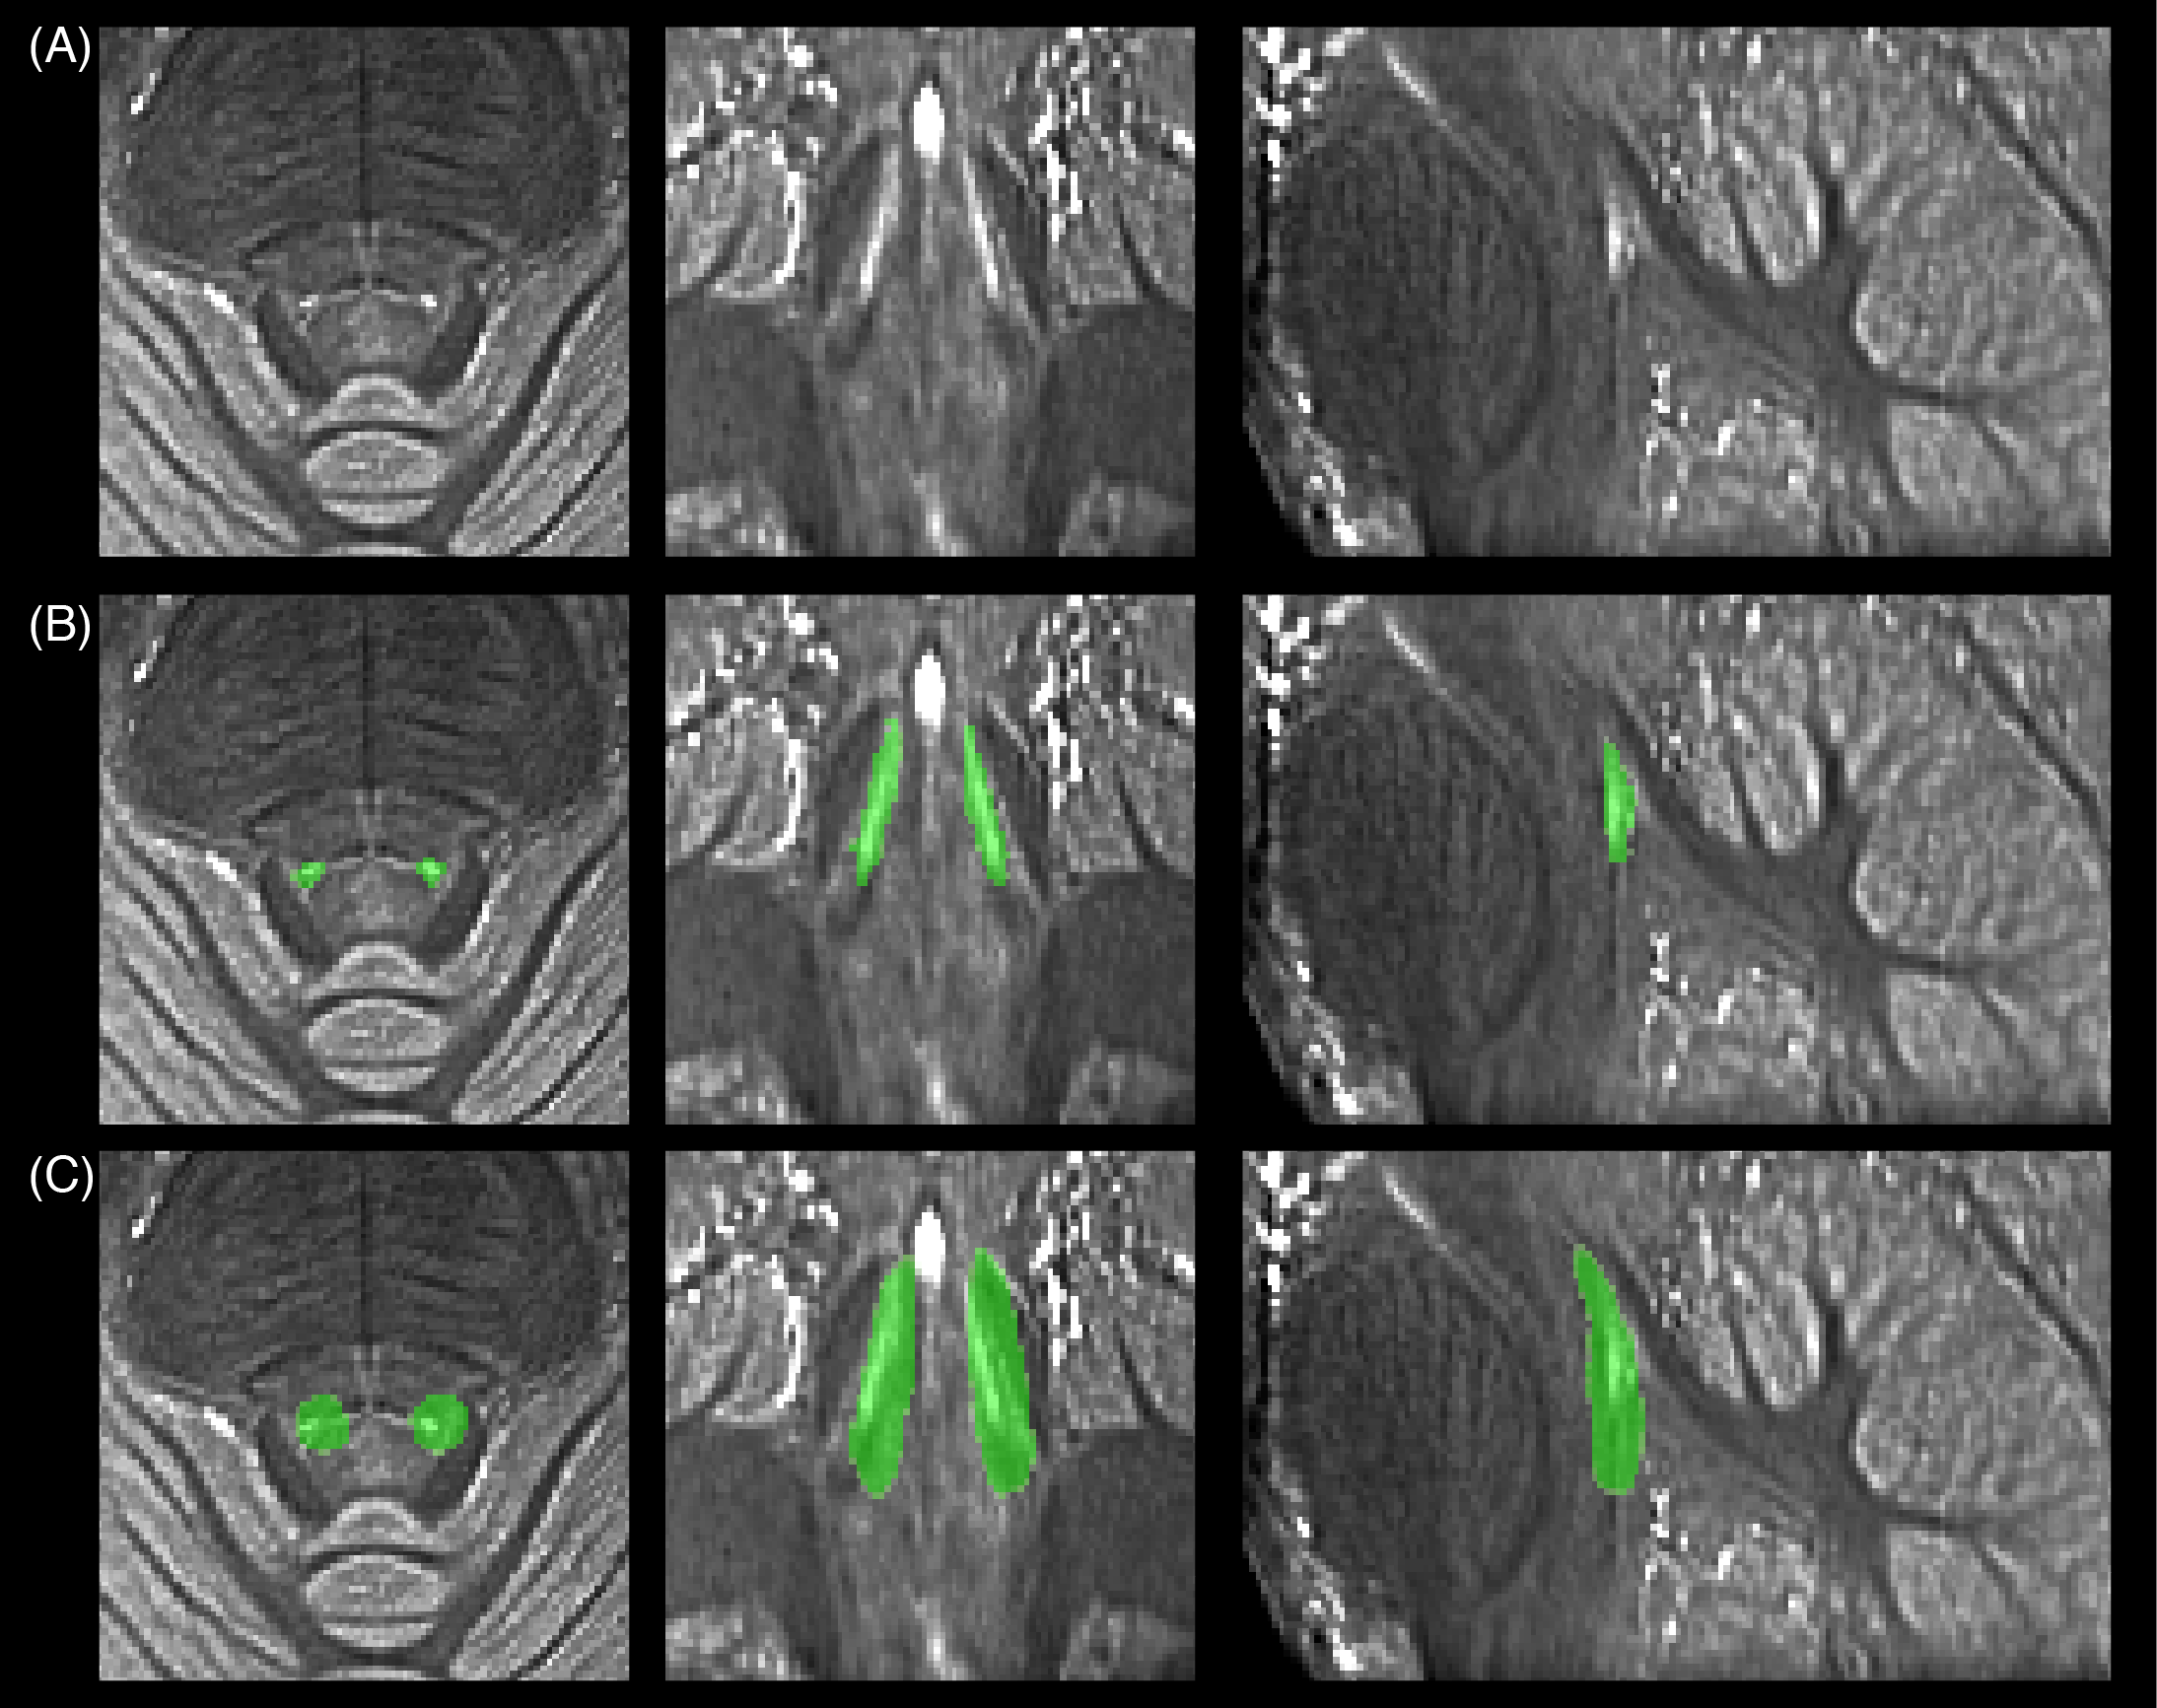
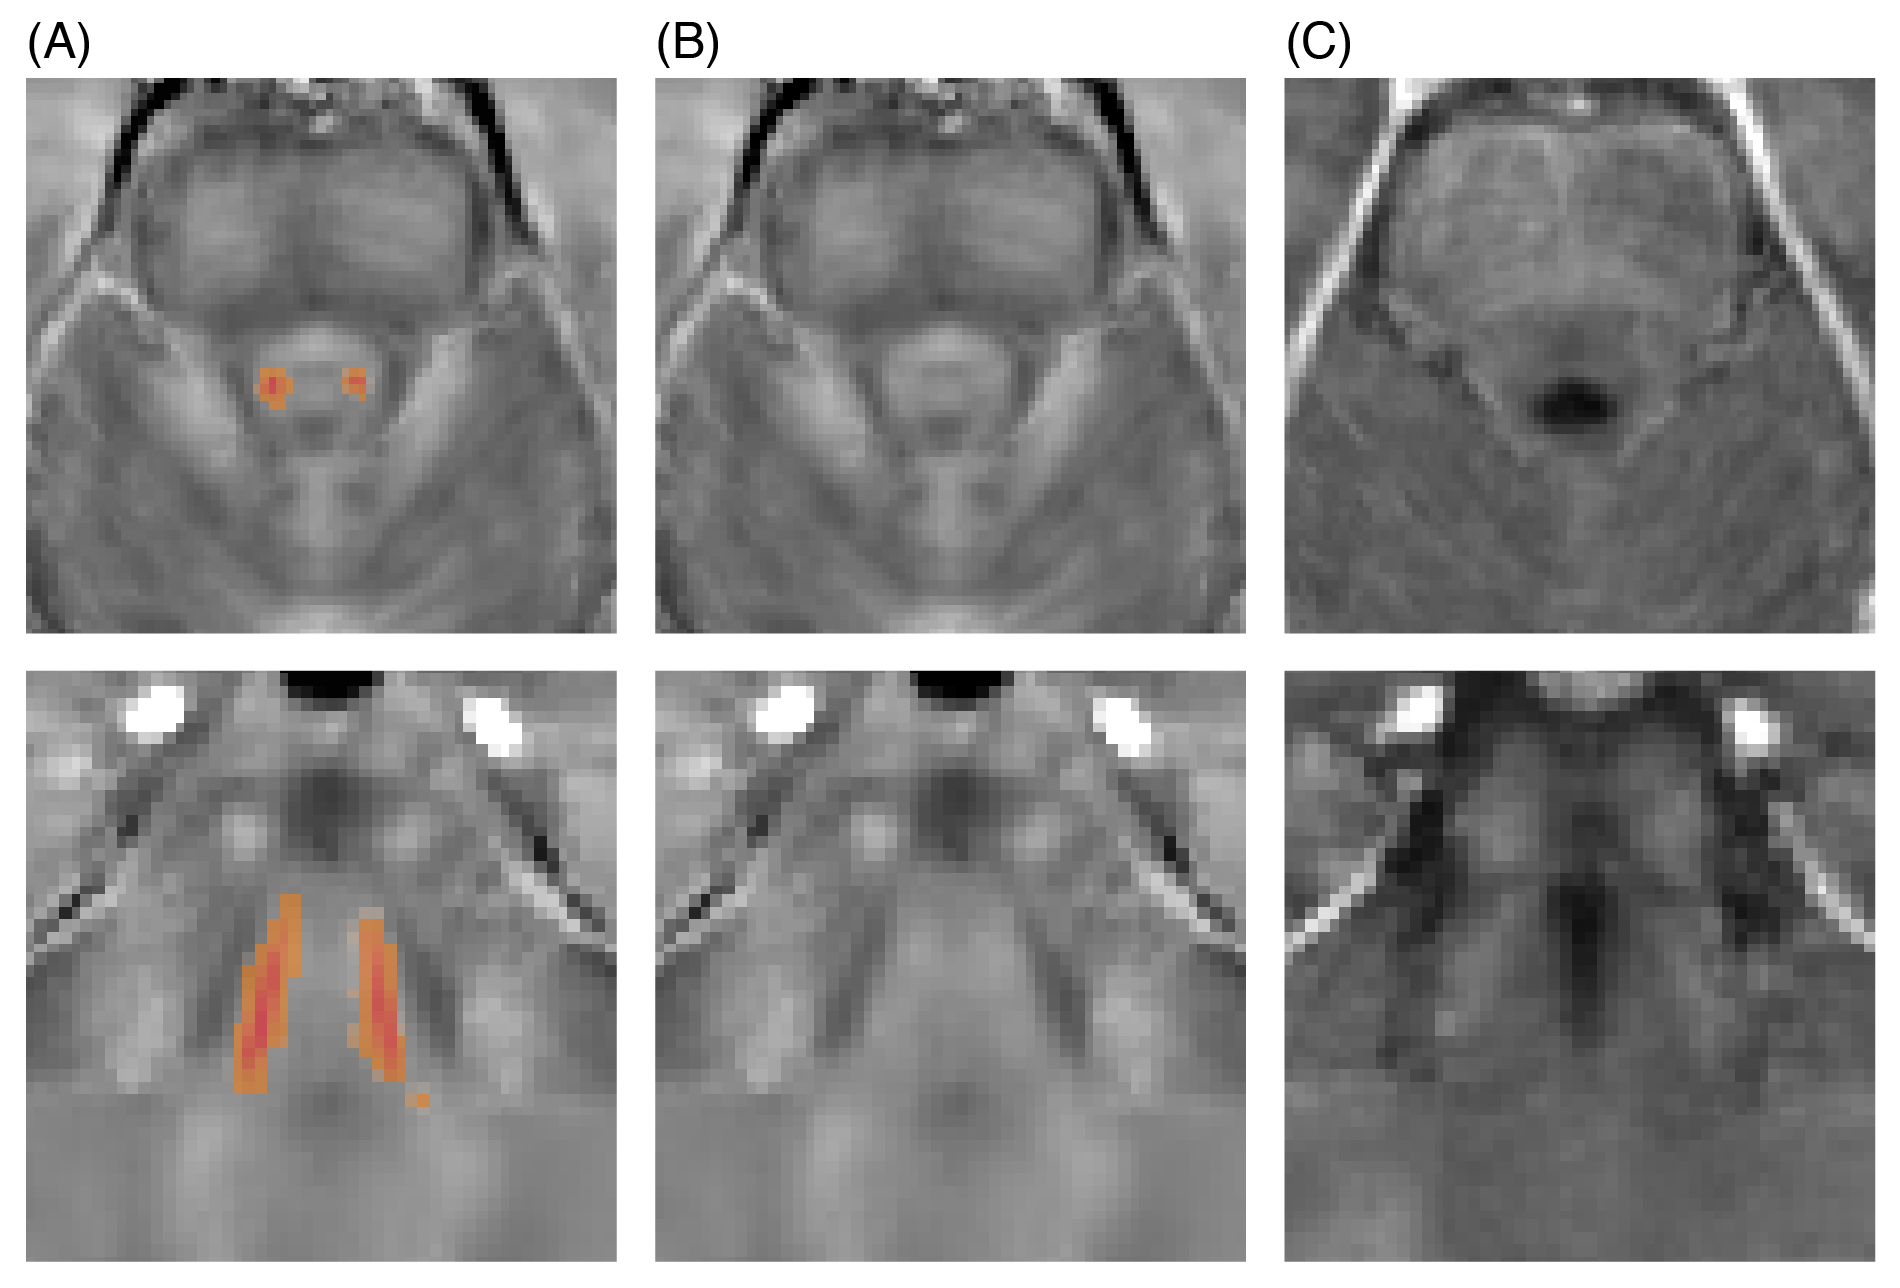
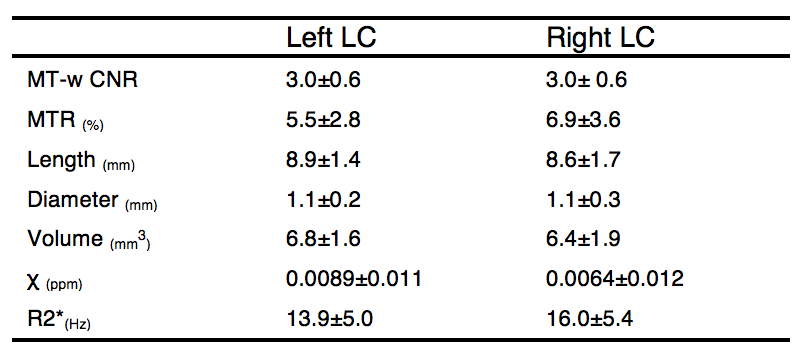
The MT-w data showed clear LC contrast in all subjects. Segmented right and left LC regions created a high-resolution LC template which matched previous literature (Figure 1). QSM and R2* showed no contrast in the LC (Figure 2). Quantitative results for LC length, width and volume, CNR, MTR, $$$\Delta\chi$$$ and R2* are reported in Table 1. No statistically significant differences were found between left and right LC in all metrics.
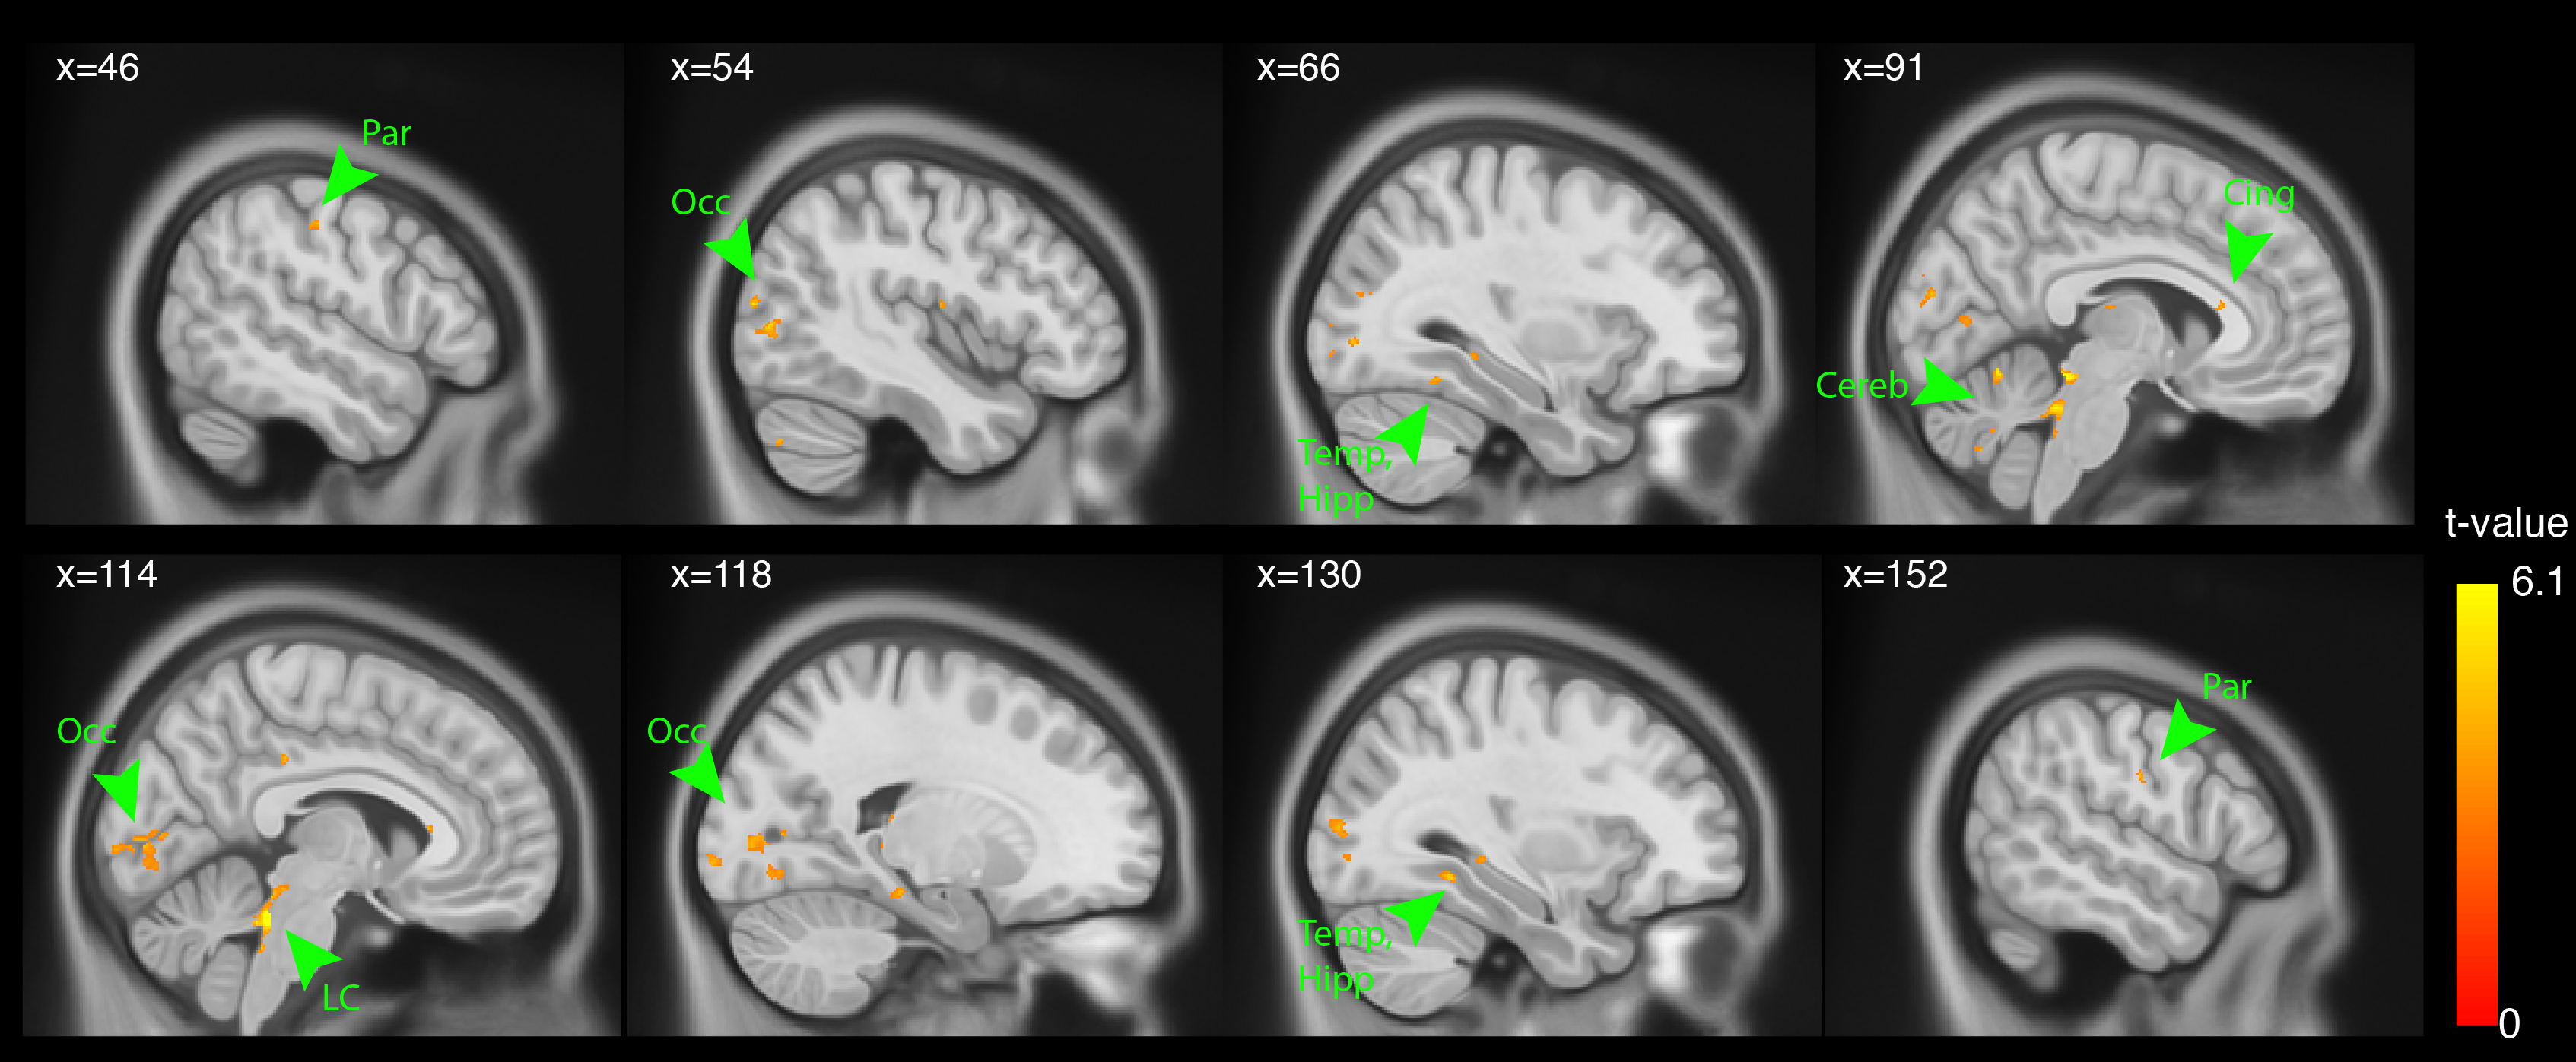
Connectivity analysis showed that the left and right LC were bilaterally positively correlated with middle temporal and occipital regions, parietal, cingulate and cerebellum.
Discussion and Conclusions
We present in-vivo imaging of the LC in healthy older individuals based on its neurochemical and functional properties. MT-weighted imaging revealed clear LC contrast from which subject-wise LC segmentation was performed. Left and right high-resolution probabilistic LC masks are in good agreement with previous reported work14, and show symmetry in topology as in Betts et al.15 who used a T1-weighted FLASH sequence.
On average the estimated LC size was smaller than previous estimates1. However, neuromelanin in the LC is heterogeneous5, and may not represent the total LC volume. Susceptibility and R2* values have been reported for the LC. Although no significant intensity contrast was observed in this older adult group, potential changes may be found in patient groups.
We observed widespread connectivity of the LC with cortical regions16,17, and the cerebellum, which accord with preclinical studies18.
Acknowledgements
We would like to thank Julio Acosta-Cabronero for valuable advice on QSM analysis and William Clarke for the implementation of the Roemer’s coil combination method. This study was funded by the NIHR Biomedical Research Centre. CTR is funded by a Sir Henry Dale Fellowship from the Welcome Trust and the Royal Society [098436/Z/12/B].References
1. Sara SJ. The locus coeruleus and noradrenergic modulation of cognition. Nature reviews neuroscience. 2009. 10(3):211-23.
2. German DC, Walker BS, Manaye K, Smith WK, Woodward DJ, North AJ. The Human Locus Coeruleus: Computer reconstruction of cellular distribution. J Neurosci. 1988. 8(5):1776-1788.
3. Priovoulos N, Jacobs HI, Ivanov D, Uludag K, Verhey FR, Poser BA. High-resolution in vivo imaging of human locus coeruleus by magnetization transfer MRI at 3T and 7T. NeuroImage. 2018. 168:427-436.
4. Rua C, Passamonti L, O’Callaghan C, Rowe J, Carpenter A, Williams G. MT and QSM of the Locus Coeruleus and Substantia Nigra on human healthy subjects. ISMRM. 2018. 3152.
5. Zucca FA, Bellei C, Giannelli S, Terreni MR, Gallorini M, Rizzio E, Pezzoli G, Albertini A, Zecca L. Neuromelanin and iron in human locus coeruleus and substantia nigra during aging: consequences for neuronal vulnerability. Journal of neural transmission. 2006. 113(6):757-67.
6. Zecca L, Gallorini M, Schuenemann V, Trautwein AX, Gerlach M, Riederer P, Vezzoni P, Tampellini D. Iron, neuromelanin and ferritin content in the substantia nigra of normal subjects at different ages: consequences for iron storage and neurodegenerative processes. J Neurochemistry. 2001. 76:1766-1773.
7. Roemer PB, Edelstein WA, Hayes CE, Souza SP, Mueller OM. The NMR Phased Array. Magn Reson Med. 1990;16:192–225.
8. Mougin O, Clarke WT, Driver I, Rua C, Carpenter A, Francis S, Muir K, Wise R, Clare S, Bowtell R. High resolution T1-weighted brain imaging and segmentation at 7T: a travelling head study. ISMRM. 2017. 701.
9. Avants, BB, Tustison NJ, Song G, Cook PA, Klein A, Gee JC. A reproducible evaluation of ANTs similarity metric performance in brain image registration. Neuroimage 2011. 54(3):2033-44.
10. Acosta-Cabronero J, Milovic C, Mattern H, Tejo C, Speck O, Callaghan MF. A robust multi-scale approach to quantitative susceptibility mapping. Neuroimage. 2018. 183:7-24.
11. VS Fonov, AC Evans, K Botteron, CR Almli, RC McKinstry, DL Collins, BDCG. Unbiased average age-appropriate atlases for paediatric studies. NeuroImage. 54(1):1053–8119.
12. VS Fonov, AC Evans, RC McKinstry, CR Almli, DL Collins. Unbiased nonlinear average age-appropriate brain templates from birth to adulthood. NeuroImage 47(S1):S102.
13. Kasper L, Bollmann S, Diaconescu AO, Hutton C, Heinzle J, Inglesias S, Hauser TU, Sebold M, Manjaly M, Pruessmann K, Stephan KE. The PhysIO Toolbox for Modeling Physiological Noise in fMRI data. Neuroimage. 2017. 276:56-72.
14. Tona KD, Keuken MC, Rover M, Lakke E, Forstmann BU, Nieuwenhius S, van Osch MJP. In vivo visualization of the locus coeruleus in humans: quantifying the test-retest reliability. Brain Struct Funct. 2017. 222(9): 4203-4217.
15. Betts M, Cardenas-Blanco A, Kanowski M, Jessen F, Duezel E. In vivo MRI assessment of the human locus coeruleus along its rostrocaudal extent in young and older adults. Neuroimage. 2017. 163:150-159.
16. Jacobs HIL, Mueller-Ehrenberg L, Priovoulus N, Roebroeck A. Curvilinear locus coeruleus functional connectivity trajectories over the adult lifespan: a 7T study. Neurobiology of Aging. 2018. 69: 167-176.
17. Zhang S, Hu S, Chao HH, Li CS. Resting state functional connectivity of the locus coeruleus in humans: in comparison with the ventral tegmental area/substantia nigra pars compacta and the effects of age. Cerebral Cortex. 2016. 26(8): 3413-3427.
18. Schwarz LA, Liqun L. Organization of the Locus Coeruleus-Norepinephrine System. Current Biology. 2015. 25:R1051-R1056.
Figures