2801
Most small cerebral cortical veins demonstrate significant flow pulsatility: a human phase contrast MRI study at 7T1Cardiff University Brain Research Imaging Centre, School of Psychology, Cardiff University, Cardiff, United Kingdom, 2Institute of Psychology, University of Tartu, Tartu, Estonia
Synopsis
We demonstrate new methods to identify and quantify the characteristics of flow pulsatility in small cerebral cortical veins to aid better understanding of the haemodynamics of this little-studied vascular compartment. 7T cardiac-gated motion sensitive phase contrast MRI was combined with an automated method for establishing where venous flow is pulsatile, revealing pulsatile flow in 104 out of 132 veins assessed in parietal and frontal regions. Distributions of pulsatility index and pulse waveform delay were characterized, indicating a small delay in cortical veins compared to the superior sagittal sinus, but no differences between veins draining different arterial supply territories.
Introduction
Venous flow pulsatility measurements can provide
insight into intracranial compliance and cerebrovascular function, which are
perturbed in pathologies such as normal
pressure hydrocephalus, multiple sclerosis and dementias1-4. Venous
outflow provides a key mechanism for transferring the pulse pressure wave out
of the cranium5.
Whilst venous pulsatility has been measured in the venous sinuses and jugular veins2,4,6,7
and in large cortical veins8 with phase contrast MRI (pcMRI), studying
upstream, smaller cortical veins will provide a better understanding of the
mechanisms underlying intracranial pulsatility. A key advantage of MRI over
other non-invasive methods, such as transcranial Doppler ultrasound, is the
ability to resolve smaller, deeper blood vessels. Pulsatility was reported
recently in a handful of small cortical veins9 using pcMRI. Here we
build on these findings by surveying over 100 cortical veins and developing
methods to characterize the pulsatility in these small blood vessels.
Methods
Data were acquired in 7 healthy participants (22-45 years; 3 female/4 male) on a 7T research MR-system (Siemens Healthcare GmbH, Erlangen, Germany), with a volume transmit, 32-channel receive head coil (Nova Medical). A cardiac-gated single-slice 2D pcMRI was acquired with venc 10 cm/s; TR/TE 23.1/6.94 ms; 0.6x0.6x5 mm; 192mm FOV. The slice was oriented obliquely, approximately 2 cm above the corpus callosum, covering superior parietal and frontal regions, positioned to maximize the number of veins cutting transversally through the slice. Veins were identified using 0.6mm isotropic T2*-weighted FLASH (TR/TE 16/10 ms) and time of flight (TOF) (TR/TE/fa 12/4.09 ms/17°) data, whilst arteries were excluded. Additionally, the pcMRI slice was divided into approximate vascular territories, using the TOF to cluster feeding arteries based on whether they originated from the anterior, left-, right-middle or posterior cerebral artery.
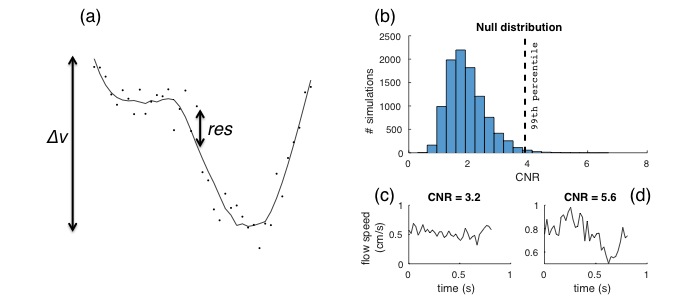
Cardiac cycle resolved vein velocity time-courses were calculated from the pcMRI phase signal. These venous pulse waveforms were characterized firstly by a statistical consideration that the waveform shows significant pulsatility, then by calculating pulsatility index (PI) and temporal lag of the waveform. In order to assess whether a waveform was pulsatile, it was assumed that lower frequency cardiac cycle-locked variations in the flow waveform were pulsatility, whereas higher frequency variations were noise. Waveforms were low-pass filtered (Savitzky-Golay) and the standard deviation of the residuals between unfiltered and filtered timepoints (res) were used to normalize the velocity range (Δv), to generate a contrast to noise ratio (CNR) parameter – see equation 1:
$$CNR=\frac{\Delta v}{\sqrt{\frac{1}{N-1}\sum_t^N res^{2}}}$$
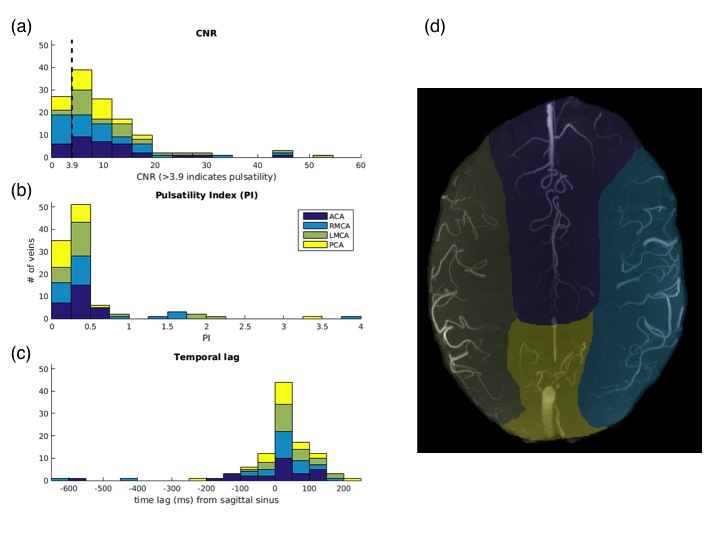
Unlike PI, CNR is not biased by low mean values. Whilst the term CNR is used to match fMRI terminology10, it is effectively a t-statistic. Based on Monte Carlo simulations of the null distribution (see figure 1), a threshold of CNR > 3.9 corresponds to p<0.01. PI was calculated as the Δv / mean(v), whilst temporal lag was calculated relative to the superior sagittal sinus.
Results
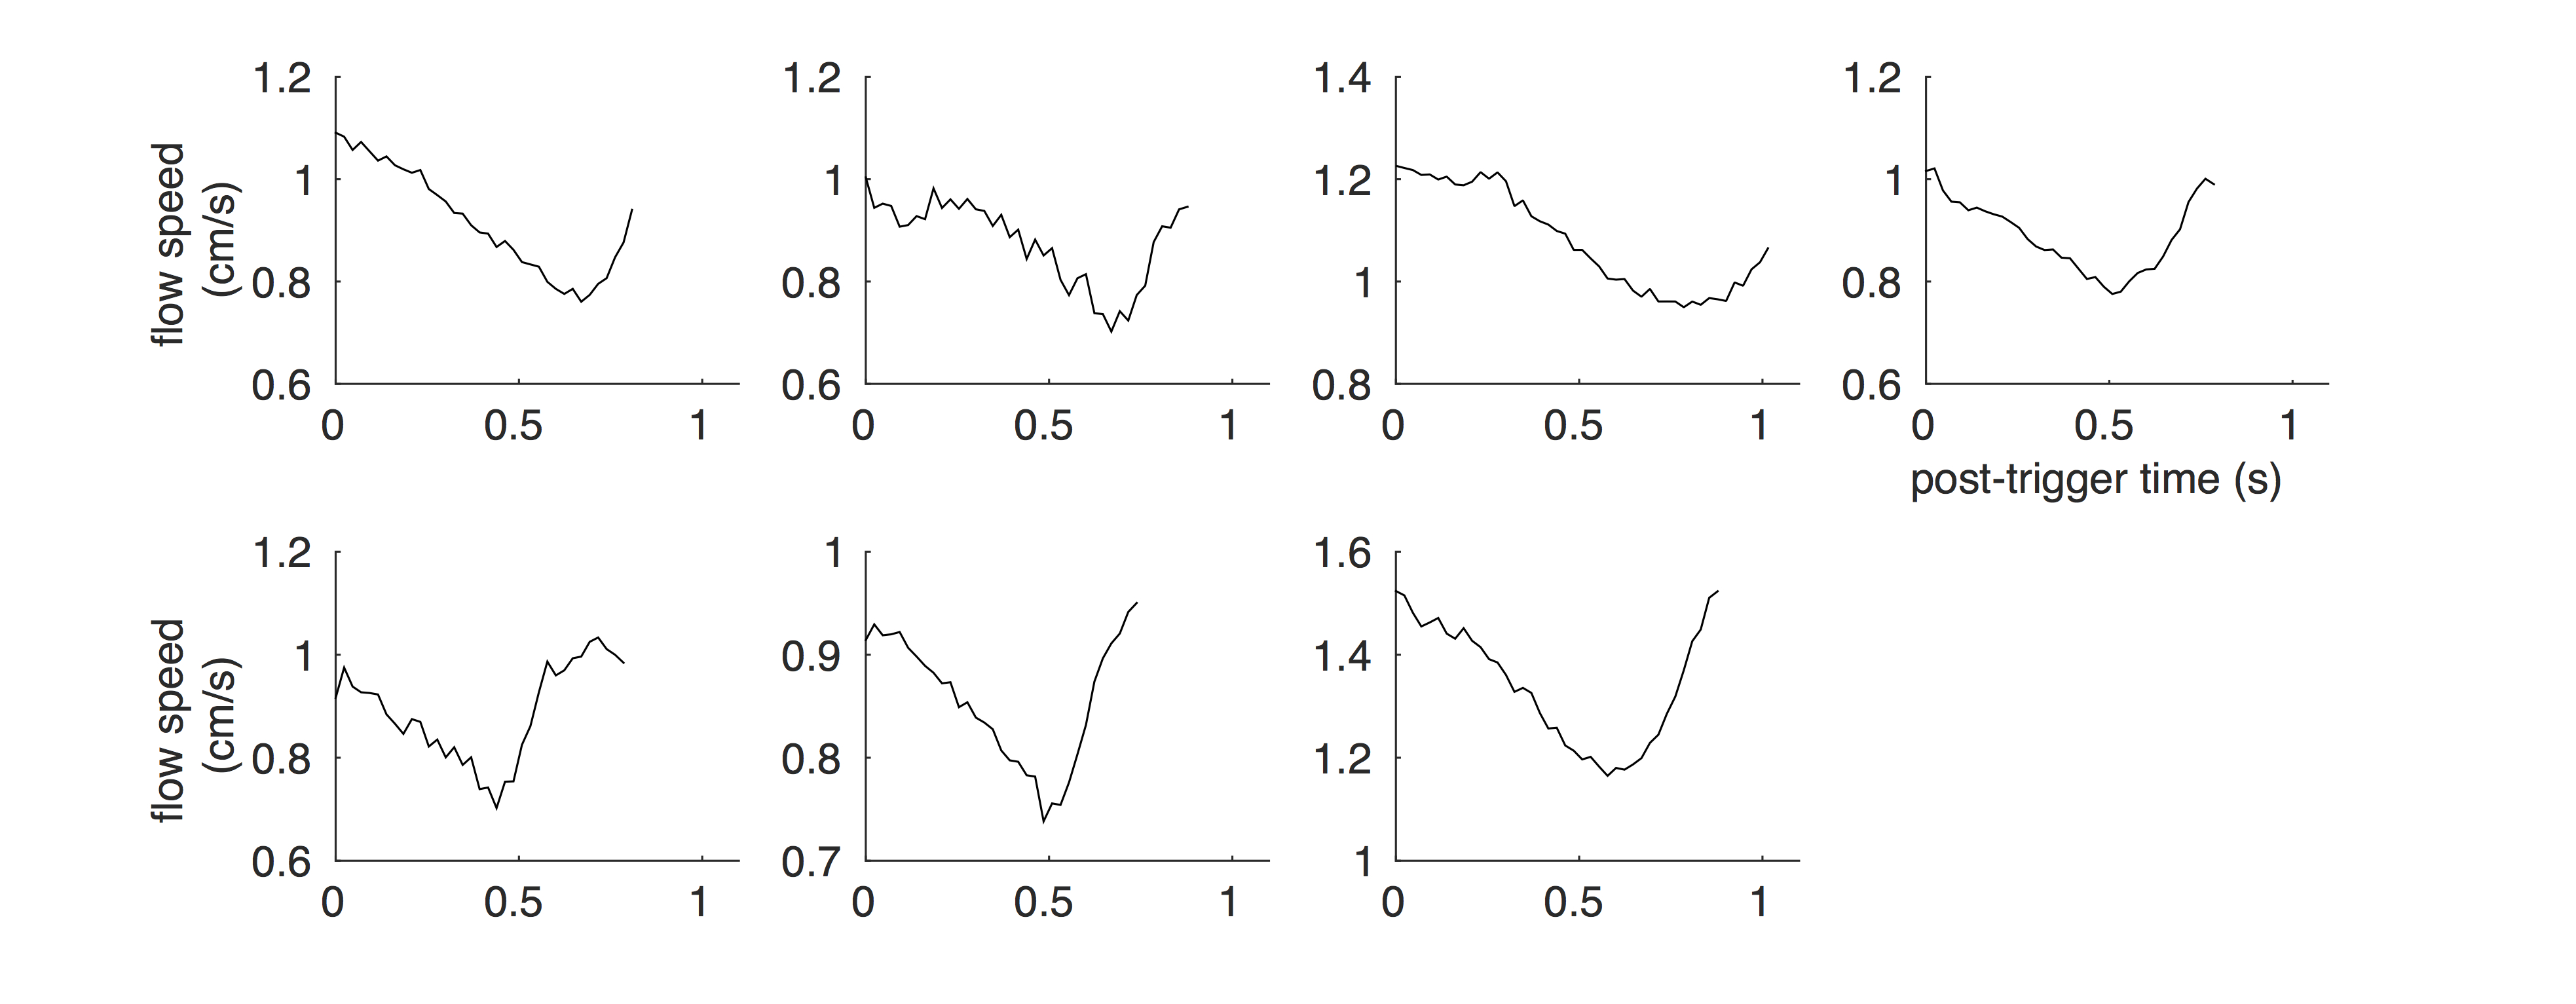
Out of 132 veins identified across the 7 subjects, 104 were pulsatile (CNR >3.9; p<0.01). Between 8 and 21 pulsatile veins were identified in each subject. PI = 0.31±0.02 (mean±SEM across subjects) and temporal lag = 40±14 ms showed a small delay with respect to the sagittal sinus (p=0.03). Venous flow timeseries are shown for each subject in figure 2. Histograms of CNR, PI and temporal lag relative to the sagittal sinus are shown in figure 3 for all veins and are sub-divided based on vascular territories (figure 3d). No significant differences in any parameter were observed between vascular territories.Discussion
We introduce a new method for identifying and quantifying pulsatility in veins that can be as small as several voxels (sub-millimeter to millimeter diameter) and include partial voluming of their signal. With 104 pulsatile veins across the 7 subjects, the distribution of PI and temporal lag could be interrogated. There appears to be a delay in the venous waveforms compared with the superior sagittal sinus. This could be due to the pulse-wave propagating upstream into the cortical veins. However, given the delay of less than two timepoints and the variance of the temporal lag measurement, more data is required to robustly assess this. Segmenting veins broadly into the arterial vascular territories of the tissue they are draining did not reveal regional differences in PI and temporal lag, suggesting that potential arterial territorial flow differences (e.g. posterior and anterior circulation) do not propagate to nearby veins.Conclusion
We establish methodology for characterizing pulsatility in small veins, for investigation of perturbed intracranial compliance and cerebrovascular function. These approaches could also be combined with approaches in recent complementary studies of pulsatility in small arteries11,12 to provide a more holistic evaluation of the cerebral circulation.Acknowledgements
The UK Medical Research Council (MR/M008932/1) and the Wellcome Trust (WT104943) supported this work.References
1. Greitz D. Radiological assessment of hydrocephalus: new theories and implications for therapy. Neurosurg Rev 2004; 27: 145-165.
2. Bateman GA, Lechner-Scott J and Lea RA. A comparison between the pathophysiology of multiple sclerosis and normal pressure hydrocephalus: is pulse wave encephalopathy a component of MS? Fluids Barriers CNS 2016; 13: 18.
3. Beggs CB. Venous hemodynamics in neurological disorders: an analytical review with hydrodynamic analysis. BMC Med 2013; 11: 142.
4. Rivera-Rivera LA, Schubert T, Turski P, et al. Changes in intracranial venous blood flow and pulsatility in Alzheimer's disease: A 4D flow MRI study. J Cereb Blood Flow Metab 2017; 37: 2149-2158.
5. Wagshul ME, Chen JJ, Egnor MR, et al. Amplitude and phase of cerebrospinal fluid pulsations: experimental studies and review of the literature. J Neurosurg 2006; 104: 810-819.
6. Stoquart-Elsankari S, Lehmann P, Villette A, et al. A phase-contrast MRI study of physiologic cerebral venous flow. J Cereb Blood Flow Metab 2009; 29: 1208-1215.
7. Bateman GA and Loiselle AM. Can MR measurement of intracranial hydrodynamics and compliance differentiate which patient with idiopathic normal pressure hydrocephalus will improve following shunt insertion? Acta Neurochir (Wien) 2007; 149: 455-462.
8. Bateman GA. The reversibility of reduced cortical vein compliance in normal-pressure hydrocephalus following shunt insertion. Neuroradiology 2003; 45: 65–70
9. Driver ID, Fasano F and Wise RG. Cardiac-induced pulsatility of blood flow resolved in sub-millimeter cerebral veins using phase contrast MRI at 7 Tesla. Proc. ISMRM 2017; 25: 4729
10. Welvaert M and Rosseel Y. On the definition of signal-to-noise ratio and contrast-to-noise ratio for fMRI data. PLOSone 2013; 8: e77089.
11. Geurts L, Biessels GJ, Luijten P, et al. Better and faster velocity pulsatility assessment in cerebral white matter perforating arteries with 7T quantitative flow MRI through improved slice profile, acquisition scheme, and postprocessing. Magn Reson Med 2018; 79: 1473-1482.
12. Bouillot P, Delattre BMA, Brina O, et al. 3D phase contrast MRI: Partial volume correction for robust blood flow quantification in small intracranial vessels. Magn Reson Med 2018; 79: 129-140.
Figures