2800
Optimizing the DENSE Sequence for Accurate Brain Tissue Strain Measurements at 7T MRI.1Radiology, University Medical Center Utrecht, Utrecht, Netherlands, 2Neurology, University Medical Center Utrecht, Utrecht, Netherlands
Synopsis
Brain tissue strain could be a valuable source of information on the brains tissue properties. Therefore, accurate DENSE measurements are crucial, since the computation of tissue strain requires spatial derivatives, which amplifies noise present in the displacement maps. In this work, we optimize the SNR in the displacement maps and substantiate the theory with both computer simulations and measurements. We tested the optimized settings in one volunteer and found a factor of 1.66 SNR increase compared to previously reported experiments. Preliminary results in one volunteer in the basal ganglia showed heartbeat-induced strain of approximately 2.1·10-3 and inspiration-induced strain of -0.54·10-3.
Introduction
Brain tissue deformation induced by the cardiac and respiration cycles is considered to be involved in the drainage of cerebral waste1. We have shown that displacement encoding with stimulated echoes (DENSE) allows for separate assessment of cardiac- and respiration induced motion2. However, these displacement maps include rotations and translations that are not considered to drive clearance. Instead, assessment of tissue strain would be preferred, which requires the computation of spatial derivatives which amplify noise present in the displacement maps. Thus, this work aims to optimize the signal to noise ratio (SNR) in the displacement maps by optimizing the flip angles and motion encoding sensitivity, incorporating the signal loss due to diffusion effects from motion encoding gradients.Theory
For calculating the SNR of the DENSE sequence (Figure 2), we separate the part of the longitudinal magnetization containing tagging information, QT (which forms the stimulated echo), from the part of the longitudinal magnetization that has relaxed after the application of the tagging pattern, QR. The tagging component of the longitudinal magnetization just before the RF excitation pulse of the kth heart phase image can be written as3$$Q_{T_k}=M_{SS}\mathrm{TAG}(x,y)\exp(-\frac{t_k}{T_1})\exp(-\frac{b_k}{D})\prod_{j=0}^{k-1}\cos(\alpha_j)$$which we adapted to include the diffusion factor. The relaxed magnetization can be recursively written as$$Q_{R_k}=\left(Q_{R_{k-1}}\cos(\alpha_{k-1})-M_0\right)\exp\left(-\frac{(t_k-t_{k-1})}{T_1}\right)+M_0$$In these equations, MSS is the steady state magnetization just prior to tagging, TAG is the tagging function, tk is the time of the kth heart phase after tagging, αj is the flip angle for heart phase j (α0 is 0, remaining excitation angles were recursively calculated3 to ensure constant signal over heart phases), bk the effective diffusion weighting at tk, and T1 and D the relaxation time and diffusion coefficient of the tissue under consideration, respectively.
The tag spacing Tenc in mm/2π describes the sensitivity of the DENSE sequence and relates to the SNR in the displacement maps by$$SNR_{displ}=\frac{d(t)}{T_{enc}}SNR_{M}$$where SNRM is the SNR in the magnitude of the stimulated echo image. Large encoding gradients yield an increased displacement sensitivity (smaller Tenc), yet, due to their large b values, reduce the SNR of the magnitude image. Consequently, an optimal Tenc exists for a given apparent diffusion coefficient (ADC) of the tissue. Similarly, a larger final flip angle increases the excited signal, but prevents regrowth of magnetization for the next dynamic. The optimal final flip angle is related to the T1 of the tissue.
Method
Simulations of the DENSE signal based on the formula’s above were performed in MATLAB for all combinations of Tenc factors (range: 0.1-0.7 mm/2π) and αmax (range: 5-90 degrees). Simulations for a spherical phantom filled with 2% agar gel (T1: 1700ms, ADC: 1.9·10-3mm2/s) were performed, and compared to actual measurements after scaling by a single factor for the unknown noise level in the measurements.
Two phantom measurement series were performed: one for a static Tenc=0.45mm/2π and varying αmax and the other for static αmax=45° and varying Tenc.
Additional validation was performed in one volunteer (male, age 27 years). Written informed consent was obtained in accordance with the Ethical Review Board of our institution. Simulations showed optimal settings of Tenc=0.3mm/2π and αmax=50° (white matter: T1=1200ms and ADC=0.8·10-3mm2/s at 7T4,5). We compared this result with Tenc=0.7mm/2π as was previously used to unravel cardiac and respiratory contributions to brain tissue displacements2.
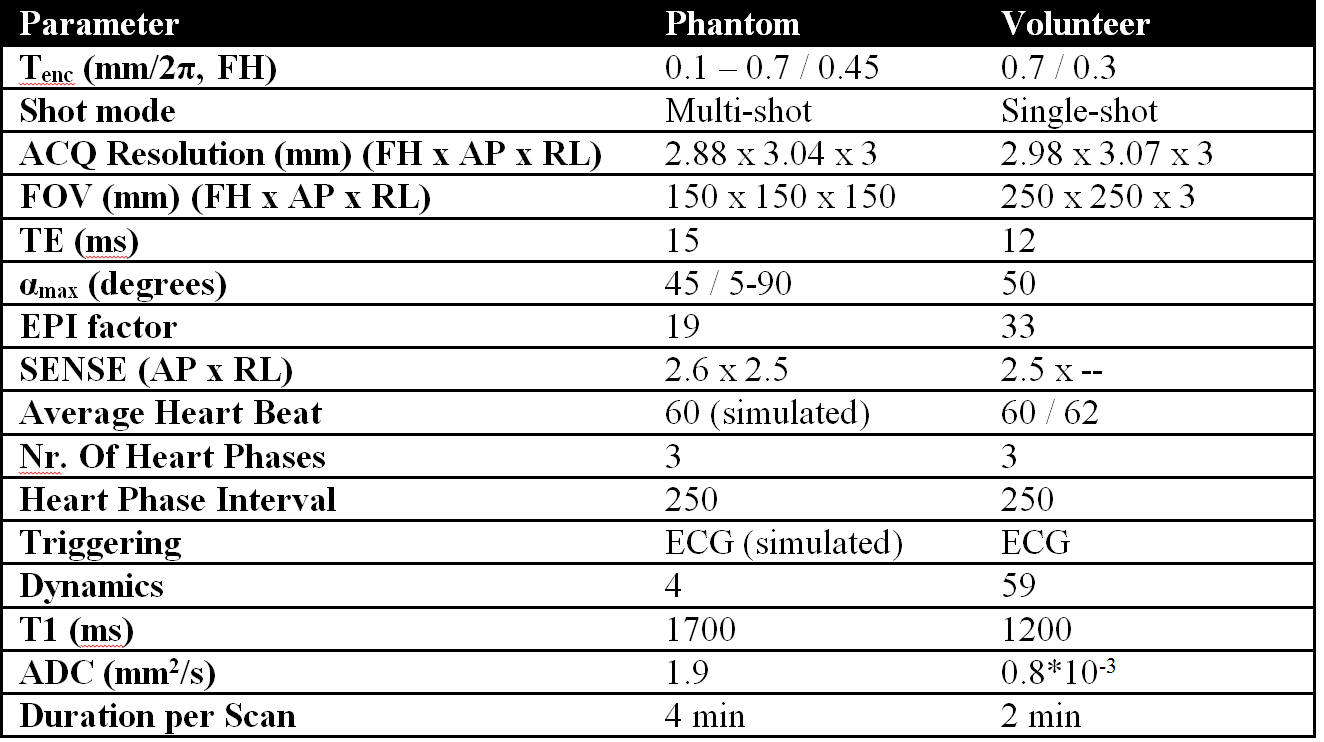
For all validations, we used the cardiac triggered, 2D single-shot DENSE sequence as previously described (Figure 2, Table 1)2. A key feature included a time-delay of one cardiac cycle between encoding and decoding to make the sequence more sensitive for respiration induced motion contributions.
Results and Discussion
The SNRM in the phantom measurements was consistent with computer simulations in both experiments (Figure 3a and 3b). The simulated SNRdispl for both the phantom and white matter is shown in Figure 3c together with the optimal tag spacing.
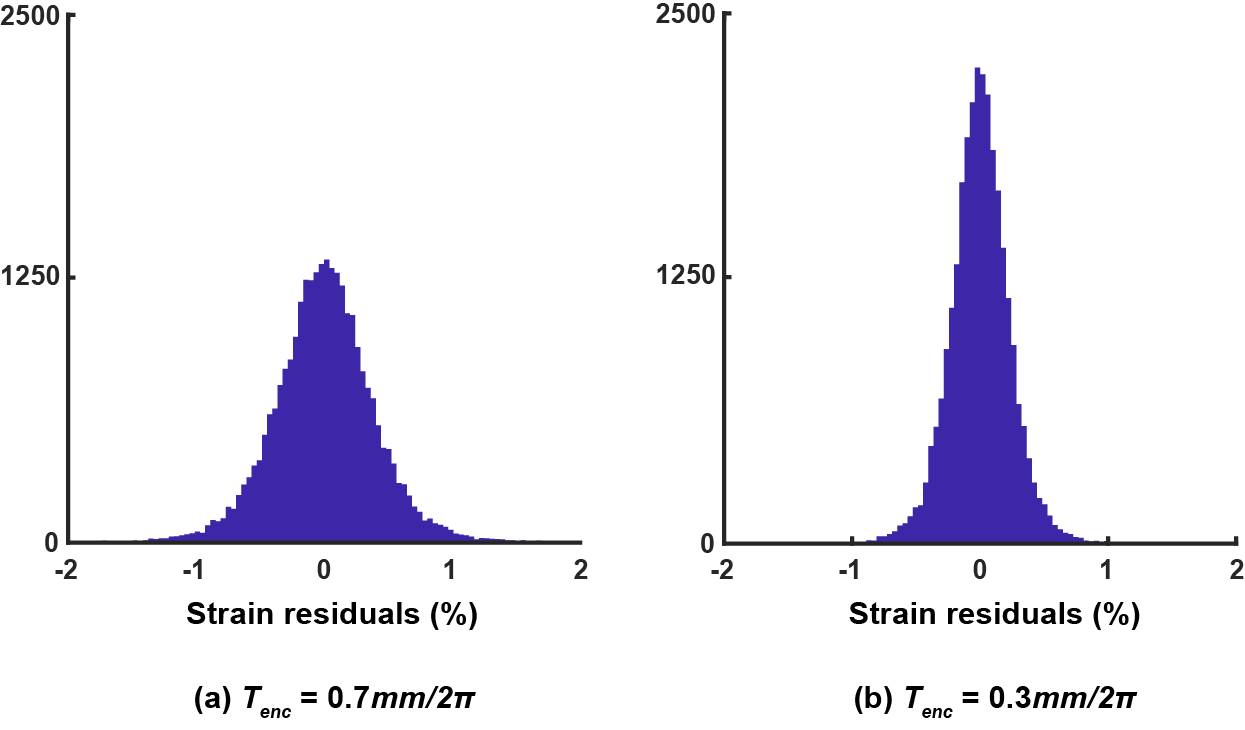
Imaging was successful in our volunteer; 59 of the 60 dynamics could be used for analysis in both experiments. Consistent strain maps were obtained for both encoding sensitivities (Figure 4). Analysis of the residuals from the linear model2 (ROI: Figure 4) showed a reduced standard deviation (Tenc=0.7mm/2π, σ=4.0·10-3; Tenc=0.3mm/2π, σ=2.4·10-3, Figure 5), implying an SNR increase of 1.66. In this subject, cardiac-induced brain tissue strain is an order of magnitude larger and in opposite direction compared to the respiration induced strain, despite similar-sized brain translations2.
Conclusion
We have successfully optimized the SNR of the DENSE method for measuring brain tissue strain, by including the diffusion effects. Brain tissue strain may serve as a valuable surrogate measure for the brain clearance system in various brain diseases.Acknowledgements
The research leading to these results has received funding from the European Research Council under the European Union's Seventh FrameworkProgramme (FP7/2007-2013) / ERC grant agreement n°337333.References
1. Mestre H, Kostrikov S, Nedergaard M, et al. Perivascular spaces, glymphatic dysfunction, and small vessel disease. Clinical Science. 2017;131(17):2257–2274
2. Sloots J, Adams A, Zwanenburg J, et al. Unraveling cardiac and respiratory contributions to brain tissue motion using single shot 2D DENSE at 7T MRI. ISMRM Proceedings. 2018;2:368
3. Fischer S, McKinnon G, Boesiger P, et al. Improved myocardial tagging contrast. Magnetic Resonance in Medicine. 1993;30(2):191–200
4. Rooney, W. D. et al. Magnetic field and tissue dependencies of human brain longitudinal 1H2O relaxation in vivo. Magnatic Resonance in Medicine. 2007;57(2):308–318
5. Helenius, J. et al. Diffusion-weighted MR imaging in normal human brains in various age groups. American Journal of Neuroradiology. 2002;23(2):194–199
Figures