2799
Cardiac and Respiratory induced 3D Brain Tissue Strain as Marker of Physiological Blood Volume Dynamics at 7T MRI.1Radiology, University Medical Center Utrecht, Utrecht, Netherlands, 2Neurology, University Medical Center Utrecht, Utrecht, Netherlands
Synopsis
Brain tissue deformation induced by the cardiac and respiration cycles could be a valuable source of information on the physiology of the brains tissue properties. In this work, we assess the tissue deformation by computing the tissue strain from DENSE displacement data sets and unravel cardiac and respiratory contributions by using a linear model. We observed consistent trends in the three strain components due to cardiac and respiration cycles, which agree with blood volume changes. In contrast to tissue displacement, the tissue strain may serve as a reliable novel marker of physiological blood volume dynamics in the brain.
Introduction
Brain tissue deformation induced by the cardiac and respiration cycles could be a valuable source of information on the brains tissue properties such as drainage of cerebral waste1. We have shown that displacement encoding with stimulated echoes (DENSE) allows for separate assessment of cardiac and respiration induced motion2. However, these displacement maps include rotations and translations that are not considered to drive clearance. Thus, this work aims to assess tissue deformation by computing the tissue strain from DENSE displacement maps. We acquired 2D slices in both the sagittal and coronal plane to assess the strain in 3 directions, in two small regions of interest (ROIs) along their intersection line.Method
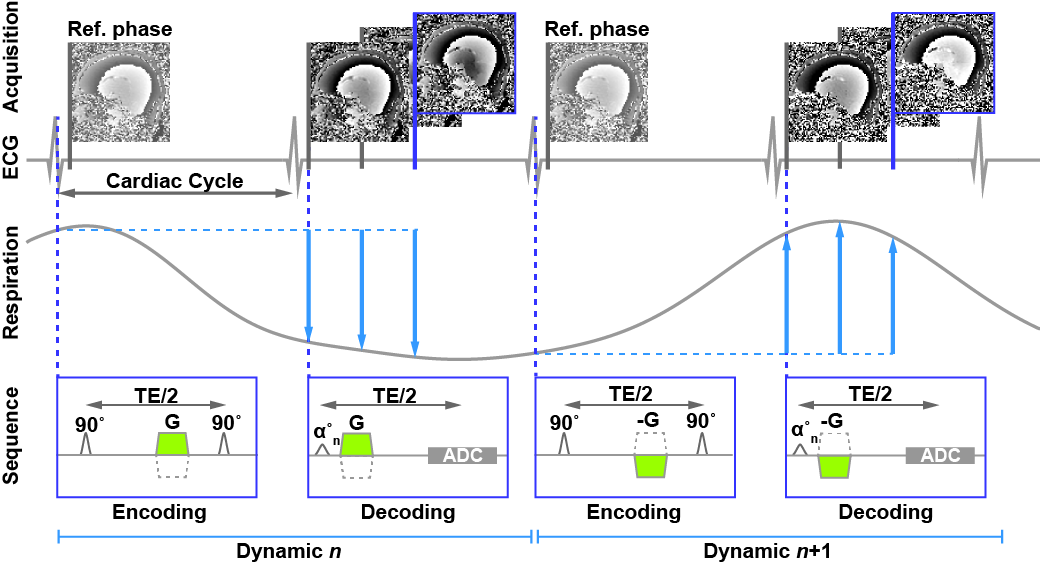
A cardiac triggered, single-shot 2D DENSE sequence2 was designed to measure heart beat and respiration related brain tissue motion (Figure 1, 3mm isotropic, EPI: 33, SENSE 2.5). A key feature included a time-delay of one cardiac cycle between encoding and decoding to make the sequence more sensitive for respiration induced motion contributions. Simulations of the DENSE signal showed optimal settings for Tenc=0.3mm/2π and αmax=50° (white matter: T1=1200ms and ADC=0.8·10-3mm2/s at 7T3,4). Variable excitation flip angles were used to obtain a stable signal to noise ratio over the cardiac phases5.
Written informed consent was obtained from all volunteers in accordance with the Ethical Review Board of our institution. Nine healthy subjects (3 females, age 29±3 years) were included and scanned at 7T (Philips Healthcare) using a 32-channel head coil (Nova Medical). The DENSE measurements were repeated over 100 dynamics with alternating encoding direction for every other dynamic. To allow for corrections of potential eddy current effects, a reference phase was acquired directly after encoding (Figure 1). The protocol resulted in 400 snapshots over time, with a scan duration of 2.5-5 min (80-40bpm).
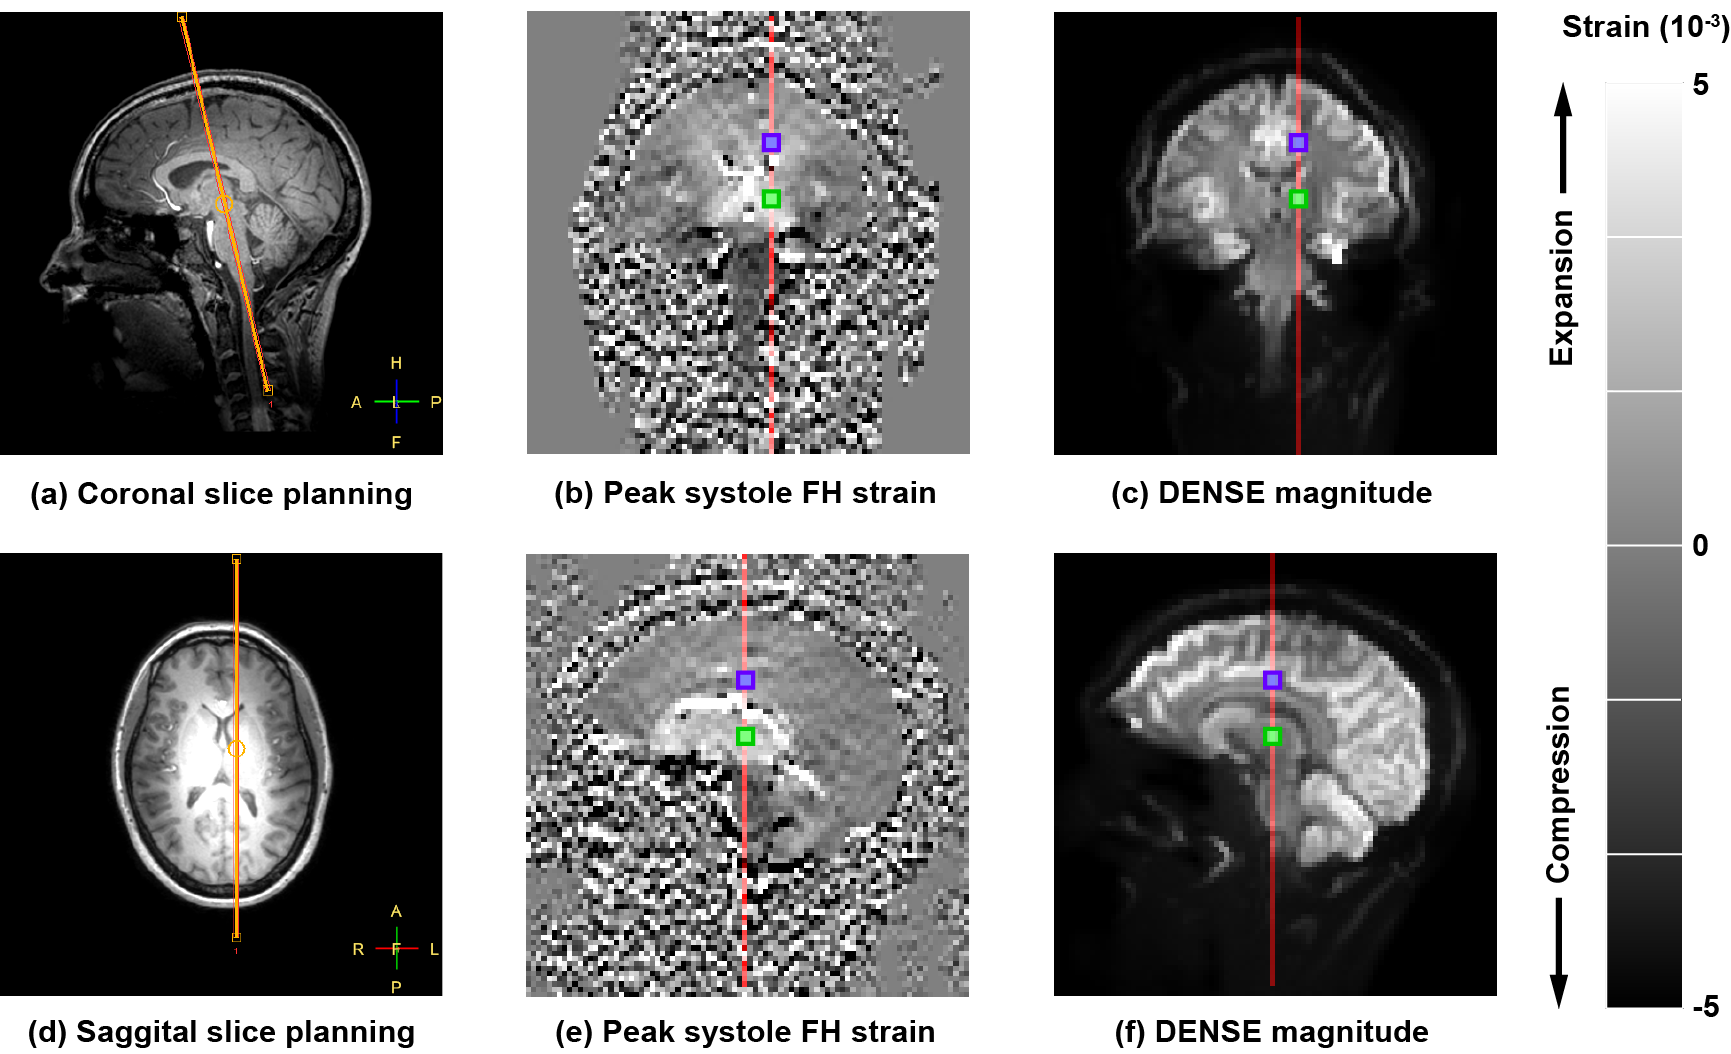
A sagittal and perpendicular coronal slice were planned, and displacement maps were separately acquired with two in-plane encoding directions (Figure 2), resulting in four displacement-encoded time series. Physiological data was simultaneously recorded by using a vector cardiogram (VCG) for triggering and a respiration belt to trace abdominal breathing. Repeatability of the measurements was assessed by acquiring an additional sagittal slice with Feet-to-Head motion encoding after repositioning of the volunteer in the scanner.
Strain maps were computed from the acquired displacement maps, where phase derivatives larger than π were unwrapped. Cardiac and respiration induced strain were unraveled by using a linear model based on the physiological data, as was proposed previously for motion measurements2.
Results
Imaging was successful in all subjects, and triggering was consistent; on average 96 dynamics could be used for analysis. Due to time constraints, we did not obtain repeated measurements in subject 7.
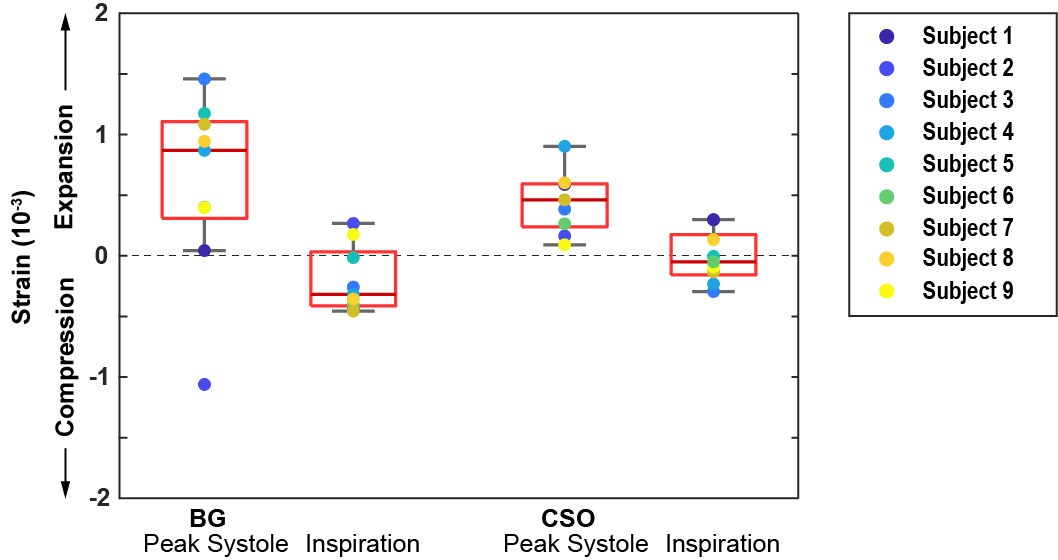
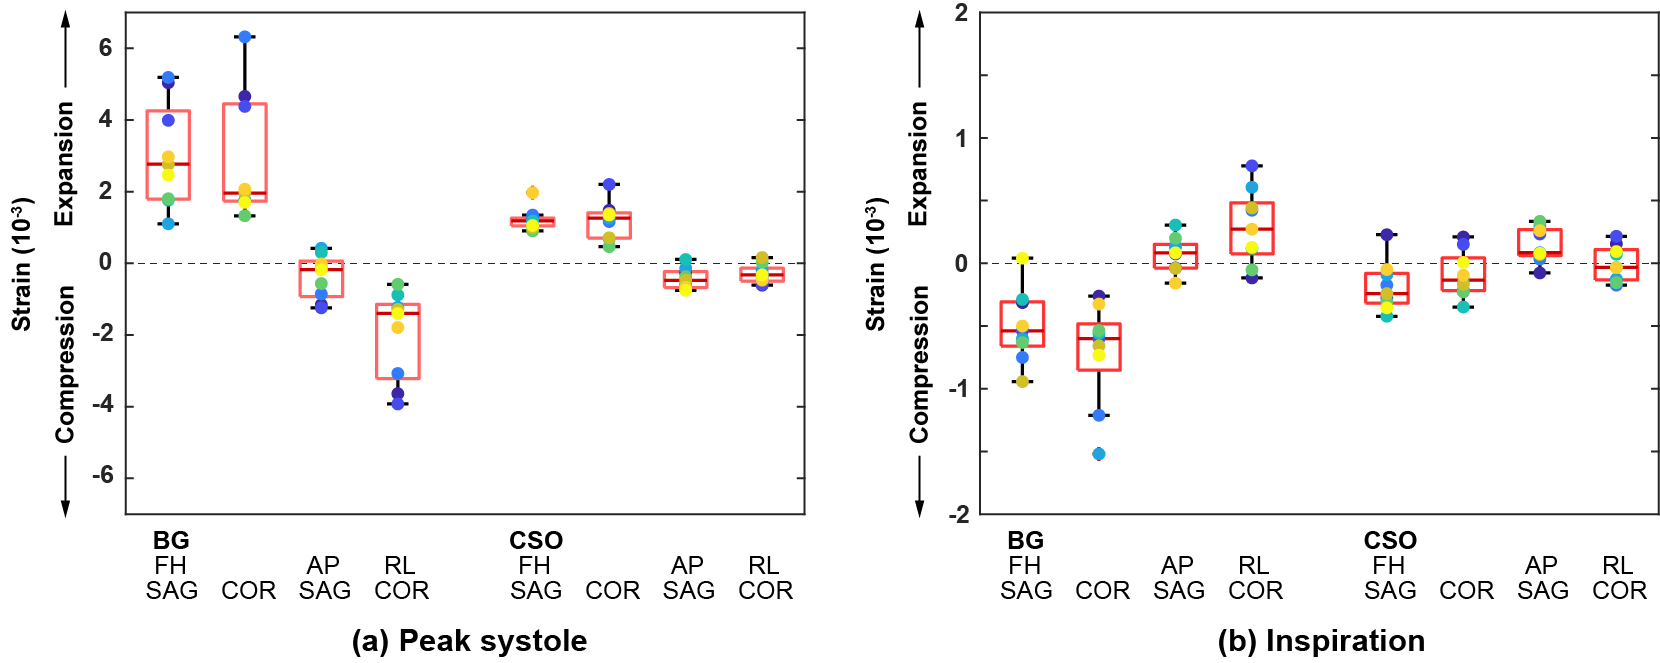
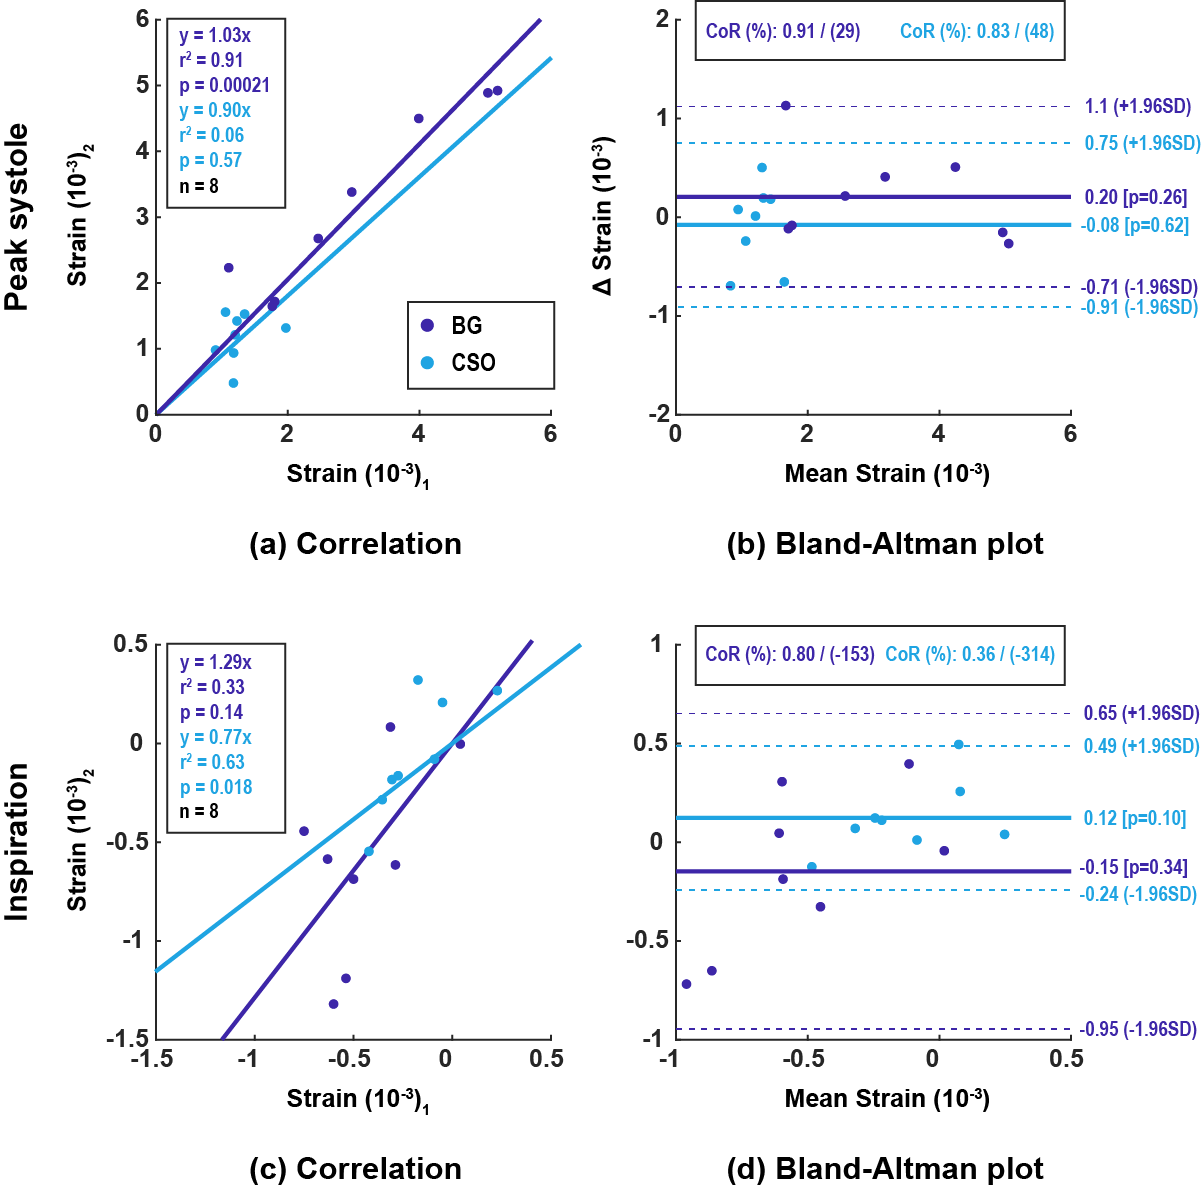
Regional analysis was performed in two regions of interest (Figure 2) for both cardiac (at peak systole; 25% of cardiac trigger interval) and respiratory (full inspiration; 95% confidence range of respiration trace) induced strain. Because of the noisy strain signal, the median in the ROIs were assessed, which makes the analysis less prone to outliers. Cardiac and respiration related strains were largest in the deep brain (basal ganglia). Here, we observed cardiac induced tissue expansion with median volumetric strain of 0.86·10-3 (IQR: 0.31·10-3 to 1.1·10-3). For inspiration, a slight compression was observed with median -0.32·10-3 (IQR: 0.03·10-3 to -0.41·10-3). The three 1D strain components showed anisotropy with stretch in the Feet-to-Head direction and minor shrinkage in the other two directions (Figure 4). The analysis of the repeatability of the measurements is shown in Figure 5.
Discussion
The observed cardiac induced tissue expansion is most likely due to arterial blood flow to the brain, whereas the respiration induced compression in tissue strain is consistent with outflow of the venous blood due to lower thoracic pressure. Although subject 2 appears as an outlier in Figure 3, the strain in different directions is consistent with the other subjects (Figure 4). Summing over the three different strain components to a volumetric strain increases noise sensitivity, as they have different signs. For the centrum semiovale, we measured strain values comparable with values reported by Hirsch et al6. We found larger strain values in the basal ganglia, which may reflect regional heterogeneity in tissue volumetric strain (and blood volume). We were able to evaluate very small ROIs with fair reproducibility. Reproducibility can be improved by acquiring more dynamics or by averaging over larger ROIs.Conclusion
We have successfully measured local cardiac and respiratory induced strain in small ROIs, despite the amplified noise induced by the use of spatial derivatives. The strain measurements are consistent with blood volume change and may serve as a novel physiological marker on blood volume dynamics in the brain.Acknowledgements
The research leading to these results has received funding from the European Research Council under the European Union's Seventh FrameworkProgramme (FP7/2007-2013) / ERC grant agreement n°337333.References
1. Mestre H, Kostrikov S, Nedergaard M, et al. Perivascular spaces, glymphatic dysfunction, and small vessel disease. Clinical Science. 2017;131(17):2257–2274
2. Sloots J, Adams A, Zwanenburg J, et al. Unraveling cardiac and respiratory contributions to brain tissue motion using single shot 2D DENSE at 7T MRI. ISMRM Proceedings. 2018;2:368
3. Rooney, W. D. et al. Magnetic field and tissue dependencies of human brain longitudinal 1H2O relaxation in vivo. Magnatic Resonance in Medicine. 2007;57(2):308–318
4. Helenius, J. et al. Diffusion-weighted MR imaging in normal human brains in various age groups. American Journal of Neuroradiology. 2002;23(2):194–199
5. Fischer S, McKinnon G, Boesiger P, et al. Improved myocardial tagging contrast. Magnetic Resonance in Medicine. 1993;30(2):191–200
6. Hirsch J, Klatt D, Sack I, et al. In Vivo Measurement of Volumetric Strain in the Human Brain Induced by Arterial Pulsation and Harmonic Waves. Magnetic Resonance in Medicine. 2013;70(3):671-683
Figures