2798
Quantitative analysis of the wall thickness and enhancement ratio of intracranial aneurysms using high-resolution black-blood imaging at 7T1State Key Laboratory of Brain and Cognitive Science, Institute of Biophysics, Chinese Academy of Sciences, Beijing, China, 2The Innovation Center of Excellence on Brain Science, Chinese Academy of Sciences, Beijing, China, 3University of Chinese Academy of Sciences, Beijing, China, 4Department of Interventional Neuroradiology, Beijing Neurosurgical Institute and Beijing Tiantan Hospital, Beijing, China, 5Department of Radiology and Biomedical Imaging, University of California San Francisco, San Francisco, CA, United States, 6Biomedical Imaging Research Institute, Cedars-Sinai Medical Center, Los Angeles, CA, United States, 7Siemens Shenzhen Magnetic Resonance Ltd., Shenzhen, China
Synopsis
Three-dimensional turbo-spin-echo (3D-TSE) is increasingly being used in black-blood imaging of intracranial aneurysms. In this study, we optimized the protocol of T1-weighted (T1w) 3D-TSE to reach a high isotropic resolution of 0.40 mm. The inner wall thickness and enhancement ratio were analyzed in sections from ten aneurysms. The segments of aneurysmal walls with a higher wall thickness tend to represent a higher enhancement ratio (Pearson correlation, r = 0.32, p < 0.001). The wall thickness and enhancement ratio should be comprehensively considered to predict the prognosis of intracranial aneurysms.
INTRODUCTION
It is important to assess the prognosis of intracranial aneurysms before determining their treatment 1. Three-dimensional turbo-spin-echo (3D-TSE) is increasingly being used for imaging intracranial aneurysms 2. It provides black-blood images that are used to discriminate both the walls and lumen of aneurysms 3. T1-weighted (T1w) 3D-TSE could reveal contrast enhancement of an aneurysmal wall after gadolinium-based contrast administration 4. In this study, we optimized T1w 3D-TSE to image intracranial aneurysms with an isotropic resolution of 0.40 mm. The wall thickness and enhancement ratio were quantified and statistically analyzed.METHODS
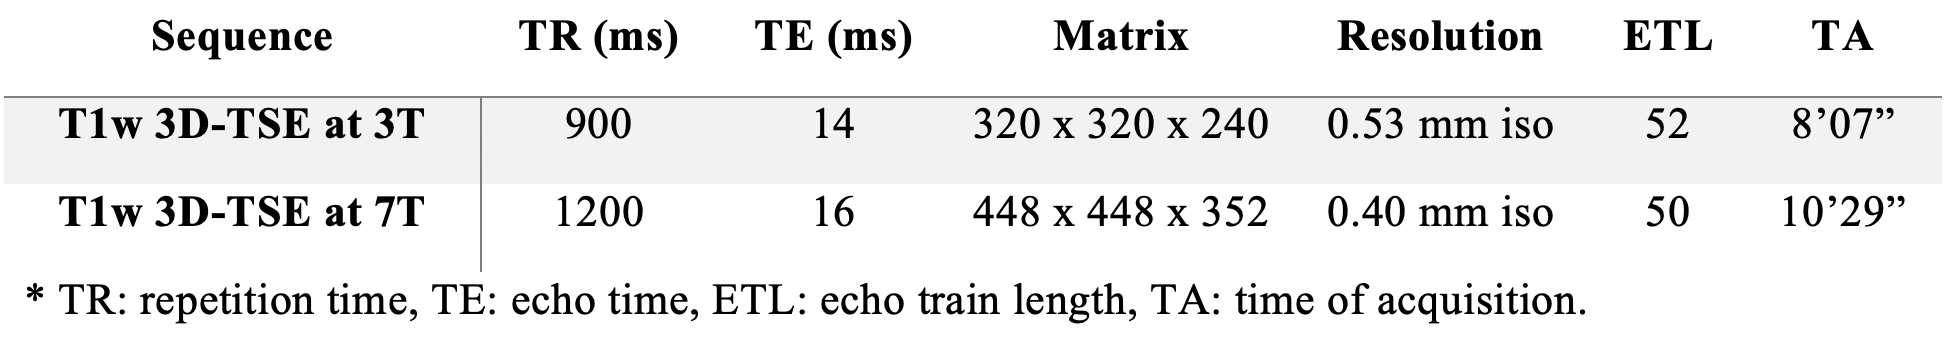
A total of twenty-five patients were enrolled in the study over twelve months. All the patients sequentially underwent MR scans with T1w 3D-TSE at 3T pre-contrast and T1w 3D-TSE post-contrast at 7T. The images were acquired on a 7T research scanner (Siemens Healthcare, Erlangen, Germany) and a 3T MR scanner (MAGNETOM Prisma, Siemens Healthcare, Erlangen, Germany) equipped with a 1Tx/32Rx coil and a 64Rx coil, respectively. The isotropic resolution of T1w 3D-TSE at 3T was optimized to 0.53 mm 5. The protocol was optimized at 7T to achieve the isotropic resolution of 0.40 mm. The key parameters of the imaging sequences used in the study are shown in Table 1.
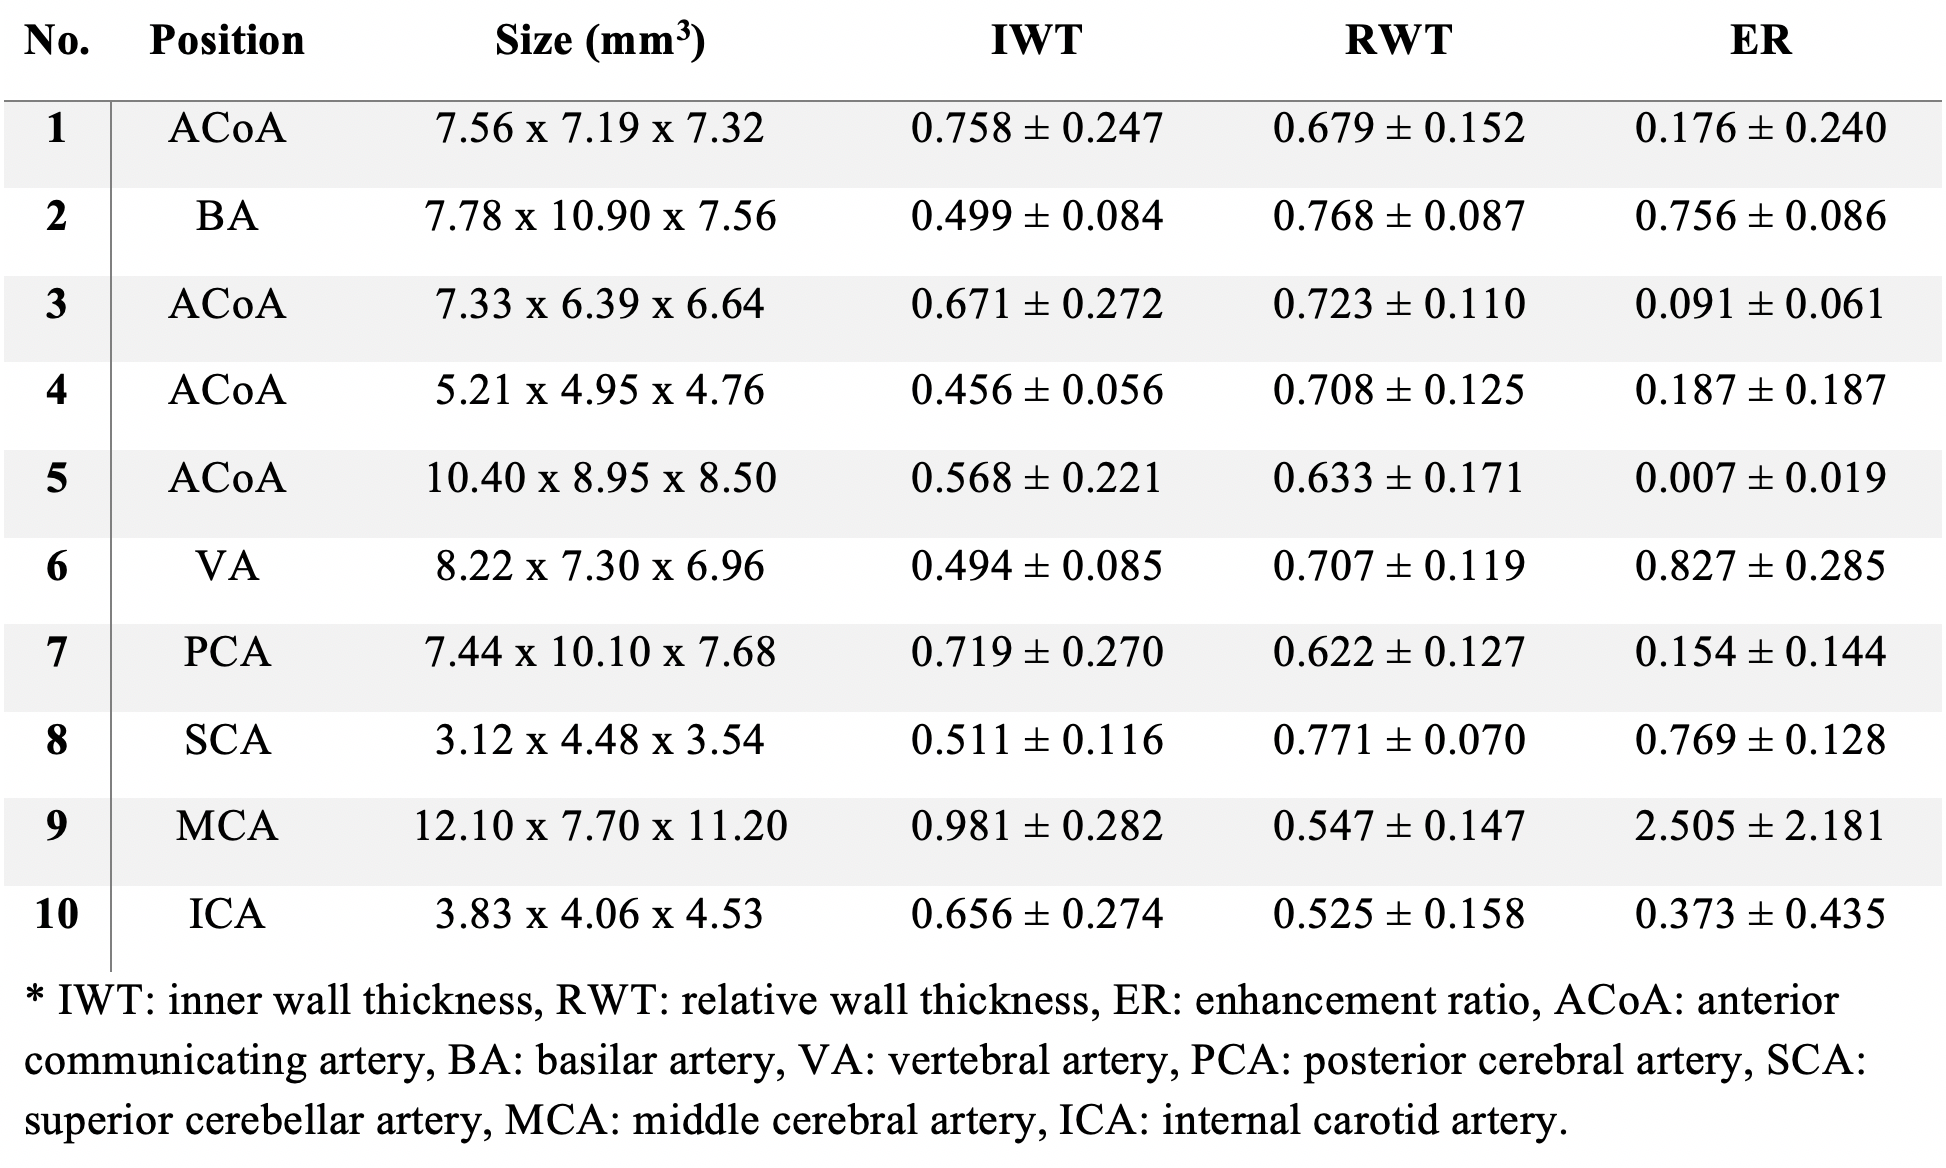
Patient data were included in the analysis if: 1) the qualities of all the black-blood images were rated highly by two observers, and 2) the aneurysm was not categorized as a giant aneurysm (measured span ≥ 10 mm in three dimensions). Ten patients with saccular aneurysms met these criteria. The inner wall thickness (IWT) was measured on the vertical line of the aneurysmal wall. The relative wall thickness (RWT) was calculated as the ratio of a voxel signal intensity to the maximal value on the aneurysmal wall, which was adapted from Blankena et al. 6. The enhancement ratio (ER) was defined as ( Spost-Spre ) / Spre 7. All the quantitative data were reported as mean ± standard deviation. The data were averaged based on the sixteen segments of the aneurysmal wall, which produced 160 samples for the statistical analysis. Pearson correlation was performed on IWT / ER and RWT / ER.
RESULTS
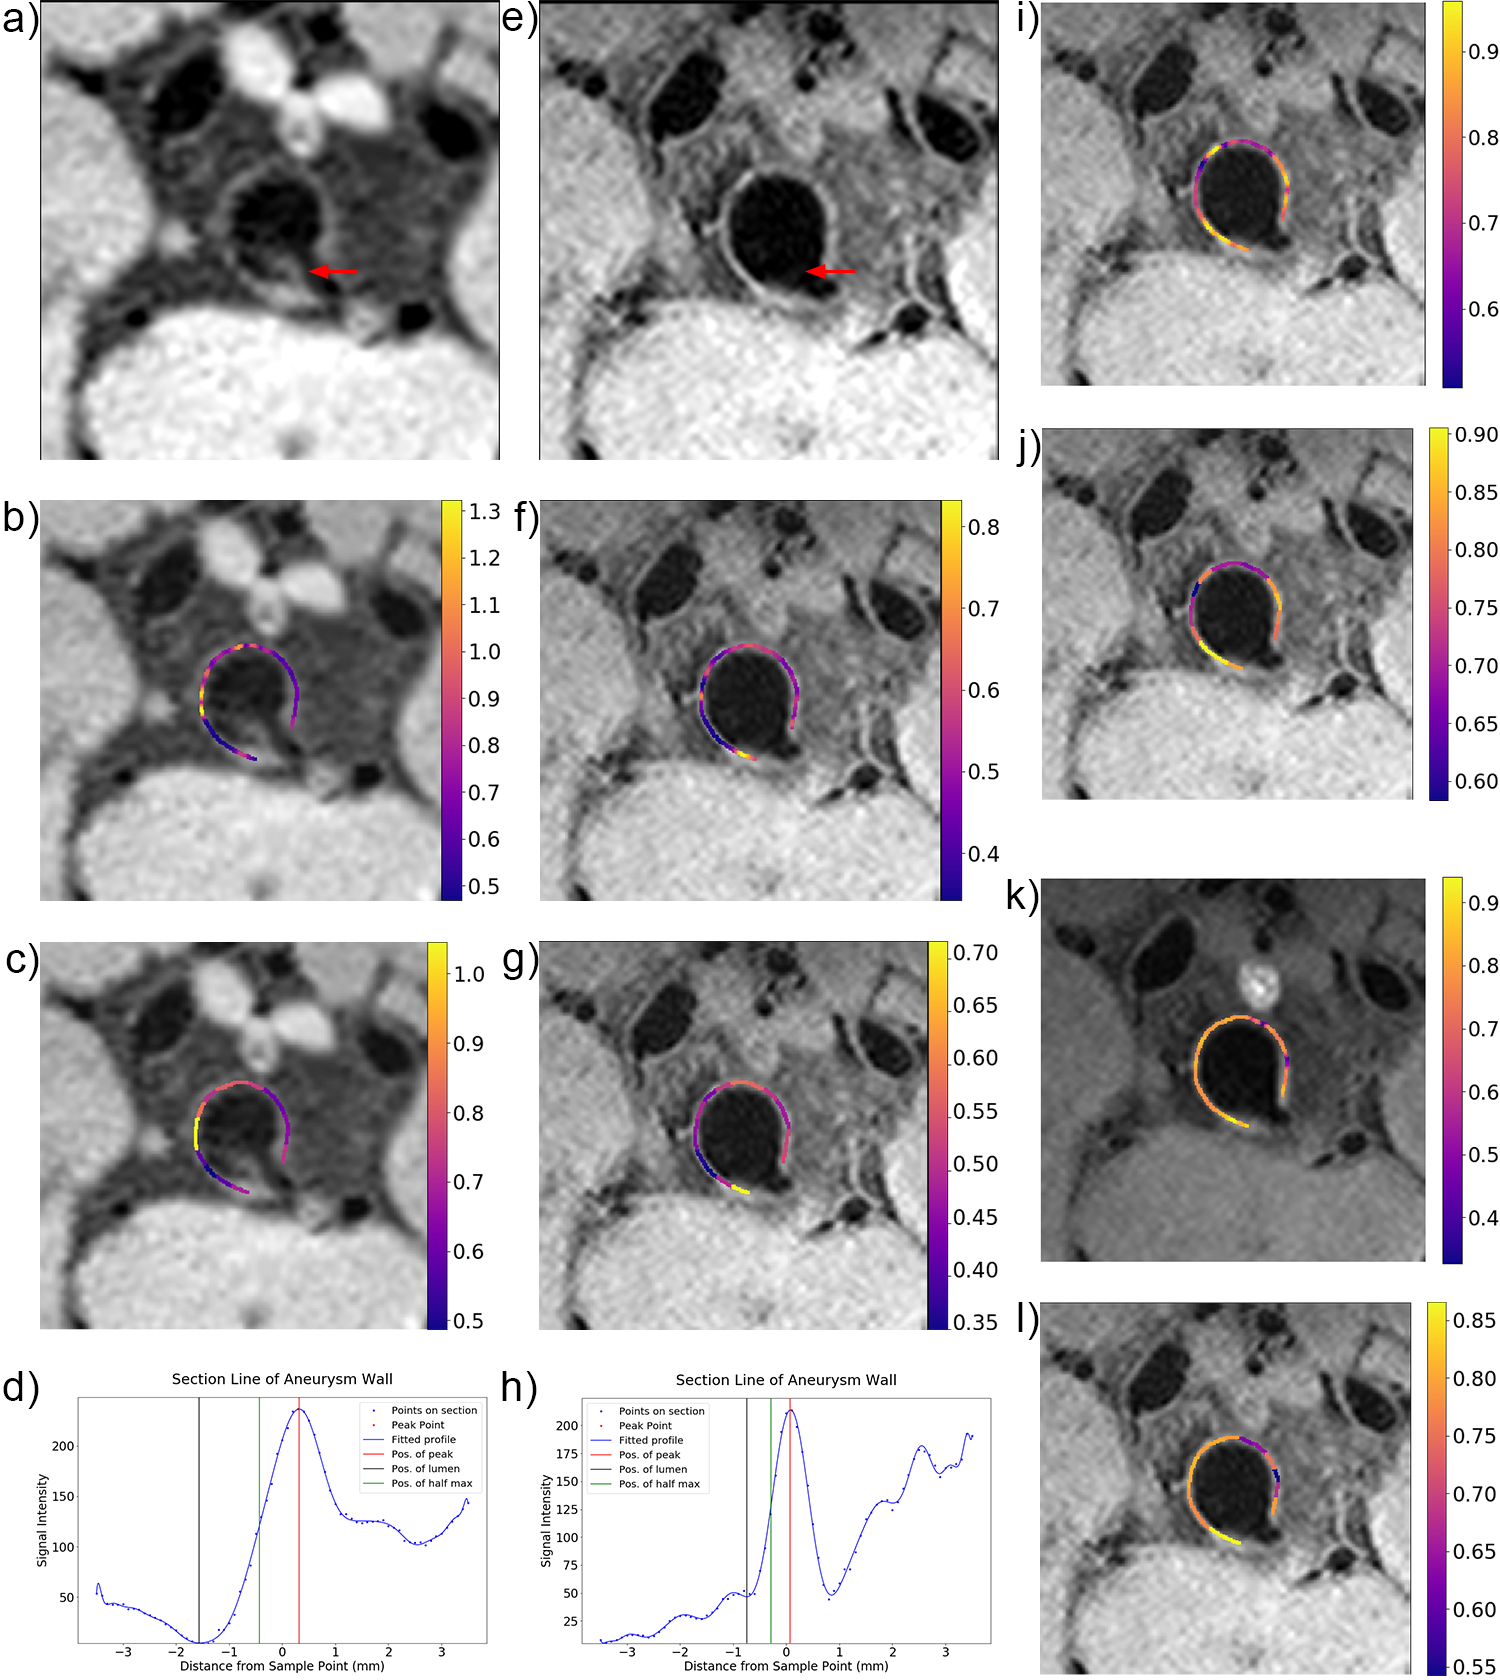
The sizes, IWT, and ER of the aneurysms are listed in Table 2. The standard deviation of the ER was large, indicating partial wall enhancement in these aneurysms. Fig. 1a-1h compares the zoomed images of an aneurysm acquired with an isotropic resolution of 0.40 mm and 0.53 mm, respectively. The image of higher resolution at 7T provided a sharper profile of the aneurysmal wall and produced lower IWT values. Fig. 1i-1l demonstrated the RWT and the ER with their averages in different segments.
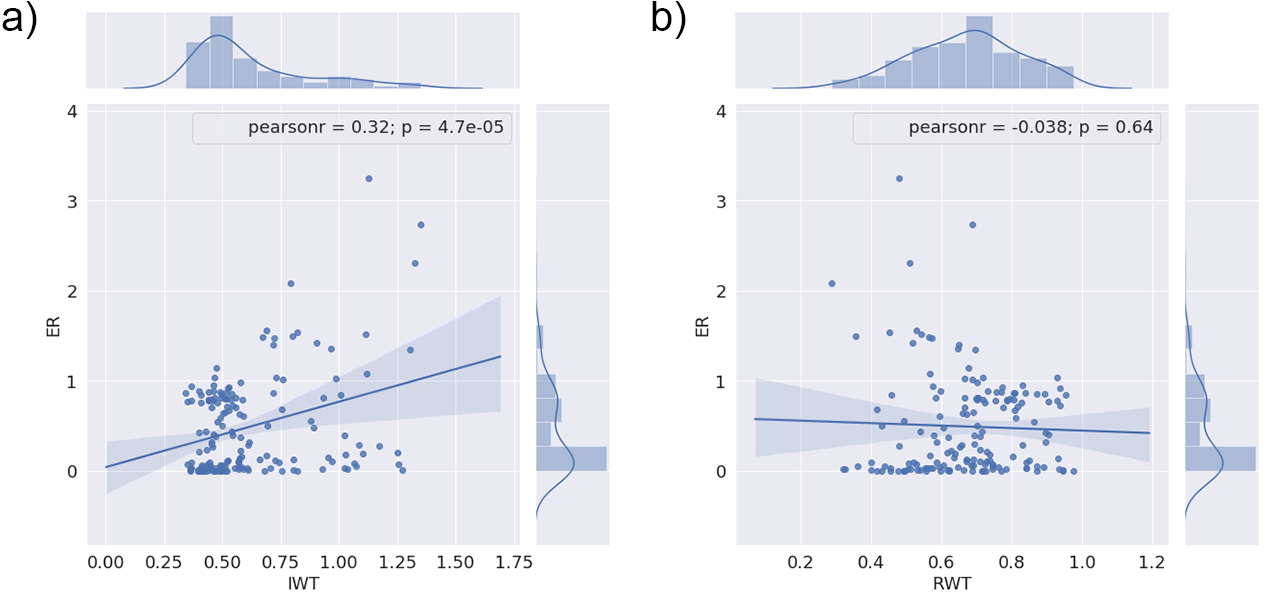
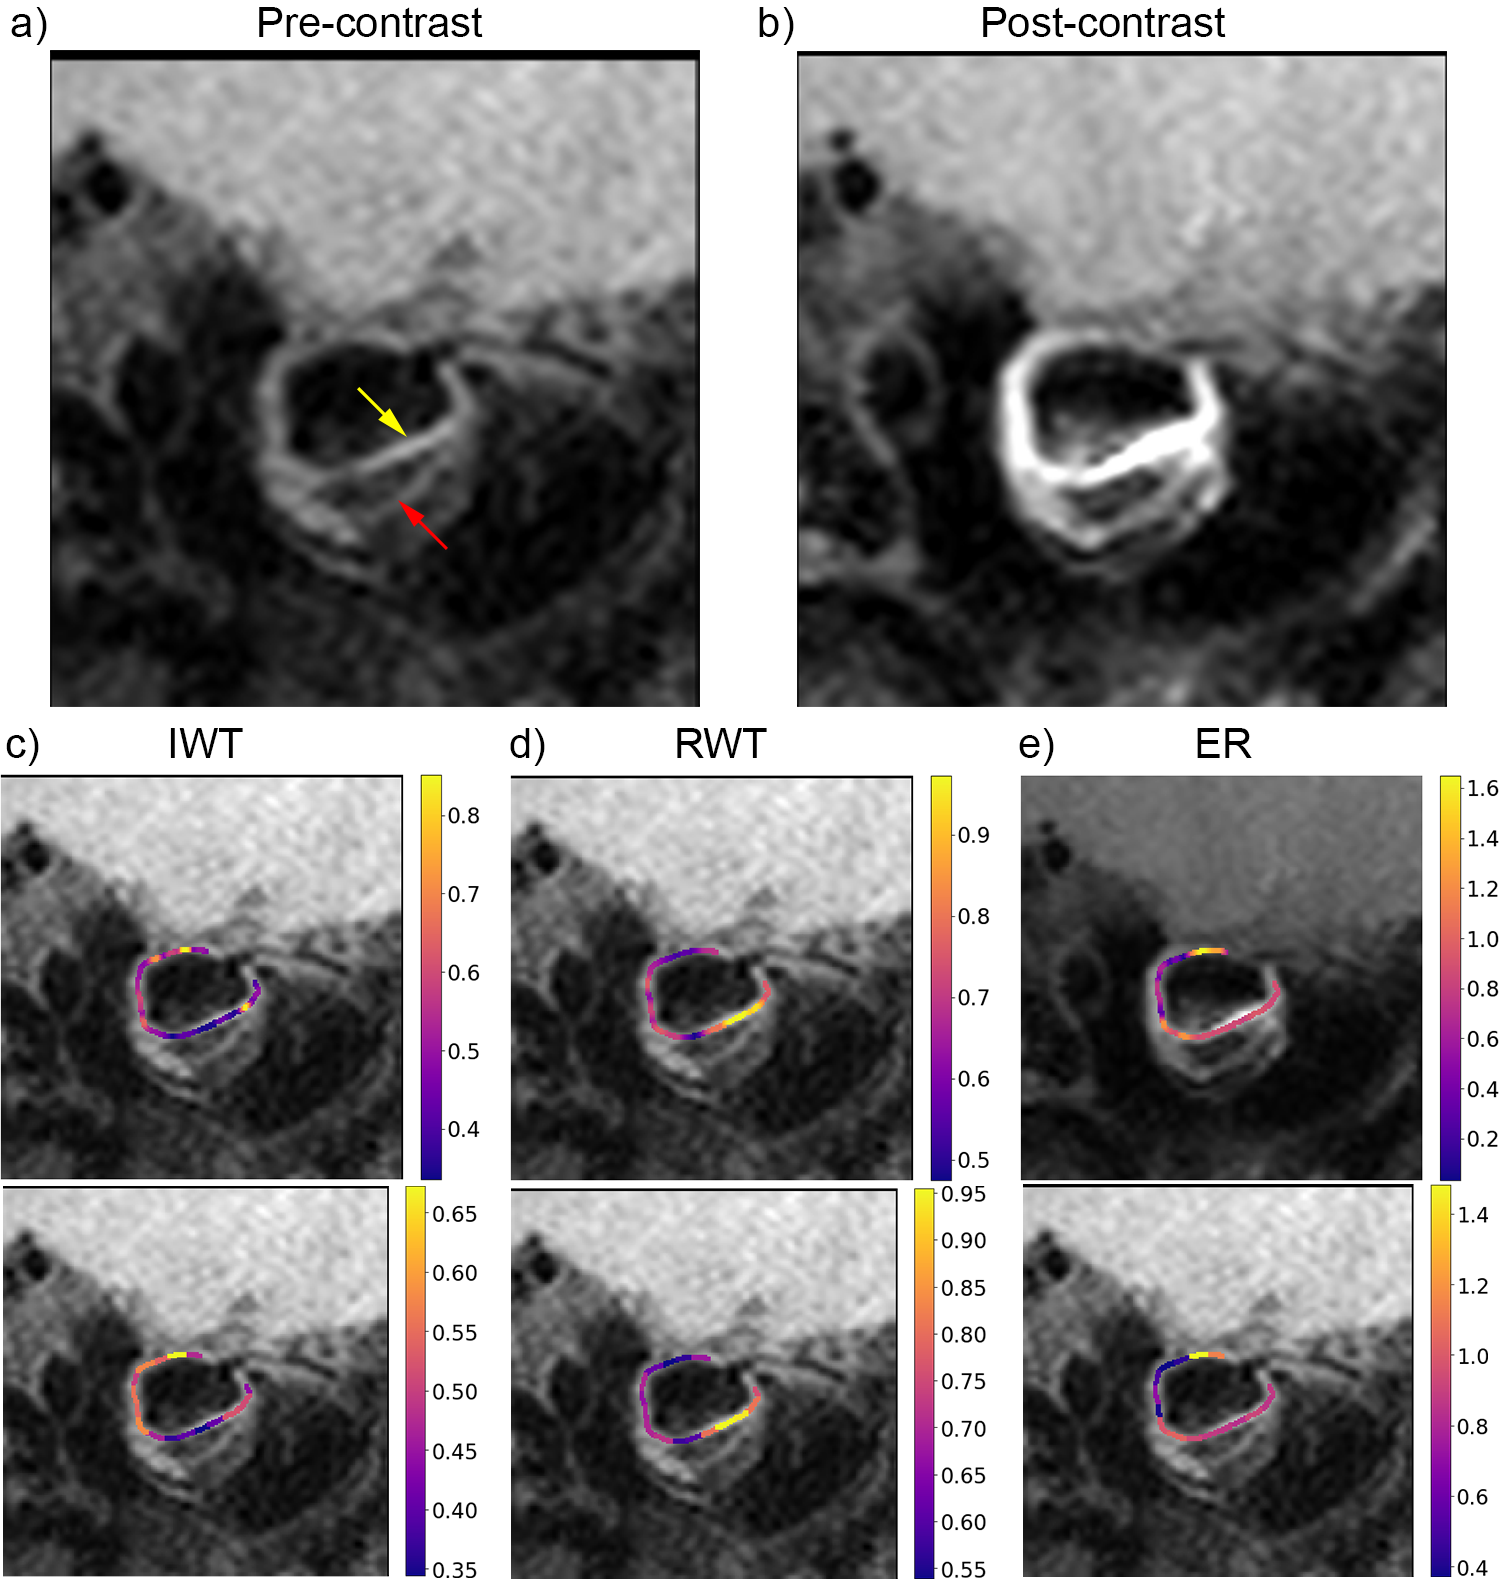
The linear regression with marginal distributions between the IWT and ER is plotted in Fig. 2a, whereas the regression between the RWT and ER is shown in Fig. 2b. There was a weak positive correlation between the IWT and ER (r = 0.318, p < 0.001). There was no correlation between the RWT and ER (r = -0.038, p = 0.639). Fig. 3 demonstrates an aneurysm with a high signal in the pre-contrast image. In this case, the calculated ER value was reduced because of the limited elevation of signal intensity after contrast administration.
DISCUSSION
Our study shows for the first time the relationship between the wall thickness and enhancement ratio of intracranial aneurysms. The optimized high-resolution T1w 3D-TSE explicitly delineates the aneurysmal wall and is highly sensitive to contrast enhancement caused by gadolinium deposition.
The high IWT value indicates the local thickening of the aneurysmal wall, which may be related to the inflammatory response of endothelial cells or the formation of mural thrombus and is believed to contribute to the enlargement of aneurysms 8. In the past, the rupture of an aneurysm was believed to occur in areas with thinner walls, such as the dome of an aneurysm 4. However, our results suggest that the wall thickness should be considered with the contrast enhancement when determining the rupture risk of an aneurysm. In contrast, the RWT calculated by the relative signal intensity should be treated cautiously when the ER also needs to be analyzed because the high intensity of the aneurysmal wall before contrast administration introduces negative correlations between the RWT and ER.
CONCLUSIONS
Using black-blood images at 0.40 mm isotropic resolution acquired by T1w 3D-TSE at 7T, we discovered for the first time a positive correlation between the wall thickness and the enhancement ratio. These quantitative parameters can provide more information in the management of intracranial aneurysms.Acknowledgements
This work was supported in part by the Beijing Municipal Natural Science Foundation (7184226), Young Elite Scientists Sponsorship Program by CAST (2017QNRC001), a Ministry of Science and Technology of China grant (2015CB351701), and the Chinese Academy of Sciences grant (XDBS01000000).References
1. Bhogal, P., Uff, C. & Makalanda, H. L. D. Vessel wall MRI and intracranial aneurysms. J. NeuroInterventional Surg. 8, 1160–1162 (2016).
2. Lehman, V. T. et al. Conventional and high-resolution vessel wall MRI of intracranial aneurysms: current concepts and new horizons. J. Neurosurg. 128, 969–981 (2018).
3. Zhu, C. et al. High resolution imaging of the intracranial vessel wall at 3 and 7 T using 3D fast spin echo MRI. Magn. Reson. Mater. Phys. Biol. Med. 29, 559–570 (2016).
4. Matouk, C. C. et al. Vessel Wall Magnetic Resonance Imaging Identifies the Site of Rupture in Patients with Multiple Intracranial Aneurysms: Proof of Principle. Neurosurgery 72, 492–496 (2013).
5. Fan, Z. et al. Whole-brain intracranial vessel wall imaging at 3 Tesla using cerebrospinal fluid-attenuated T1-weighted 3D turbo spin echo: Whole-Brain Intracranial Vessel Wall Imaging at 3 T. Magn. Reson. Med. 77, 1142–1150 (2017).
6. Blankena, R. et al. Thinner Regions of Intracranial Aneurysm Wall Correlate with Regions of Higher Wall Shear Stress: A 7T MRI Study. Am. J. Neuroradiol. 37, 1310–1317 (2016).
7. Wang, G. et al. Wall enhancement ratio and partial wall enhancement on MRI associated with the rupture of intracranial aneurysms. J. NeuroInterventional Surg. 10, 566–570 (2018).
8. Krings, T., Lasjaunias, P. L., Geibprasert, S., Pereira, V. & Hans, F. J. The Aneurysmal Wall: The Key to a Subclassification of Intracranial Arterial Aneurysm Vasculopathies? Interv. Neuroradiol. 14, 39–47 (2008).
Figures