2796
Evaluating Countermeasures Against Chemical Warfare Nerve Agents using Diffusion Tensor Imaging1Radiology, University of Calgary, Calgary, AB, Canada, 2Defence Research and Development Canada-Suffield Research Centre, Ralston, AB, Canada, 3CBRN Protection, TNO, Rijswijk, Netherlands
Synopsis
Seizures induced by chemical warfare nerve agents cause debilitating neurological damage. It is widely accepted that the main contributor to this neuropathology is excitotoxic damage. Current countermeasures to the damage are effective in preventing
Purpose:
Chemical warfare nerve agents (CWNA) have the potential to cause mass casualties. Survivors of attacks often suffer neurological consequences including motor, visual, and cognitive dysfunction1. These neurological deficits may be a result of CWNA-induced seizures, as such medical countermeasures should be used to mitigate seizure activity, therefore minimizing deficits. The current Canadian standard of care includes atropine sulfate, oxime (HI-6), and diazepam2. Treatments are effective in treating immediate symptoms and enhancing survival rates. However, seizures can still manifest after CWNA exposure if anti-seizure treatment is ineffective. Brivaracetam is a potent analog of levetiracetam, which is effective in preventing CWNA-induced seizures and reducing neuropathology3.
The objective of this study was to use diffusion tensor imaging (DTI) to determine whether brivaracetam, combined with various atropine sulfate doses, can act as an effective countermeasure to CWNA-induced seizures, compared to diazepam.
Methods:
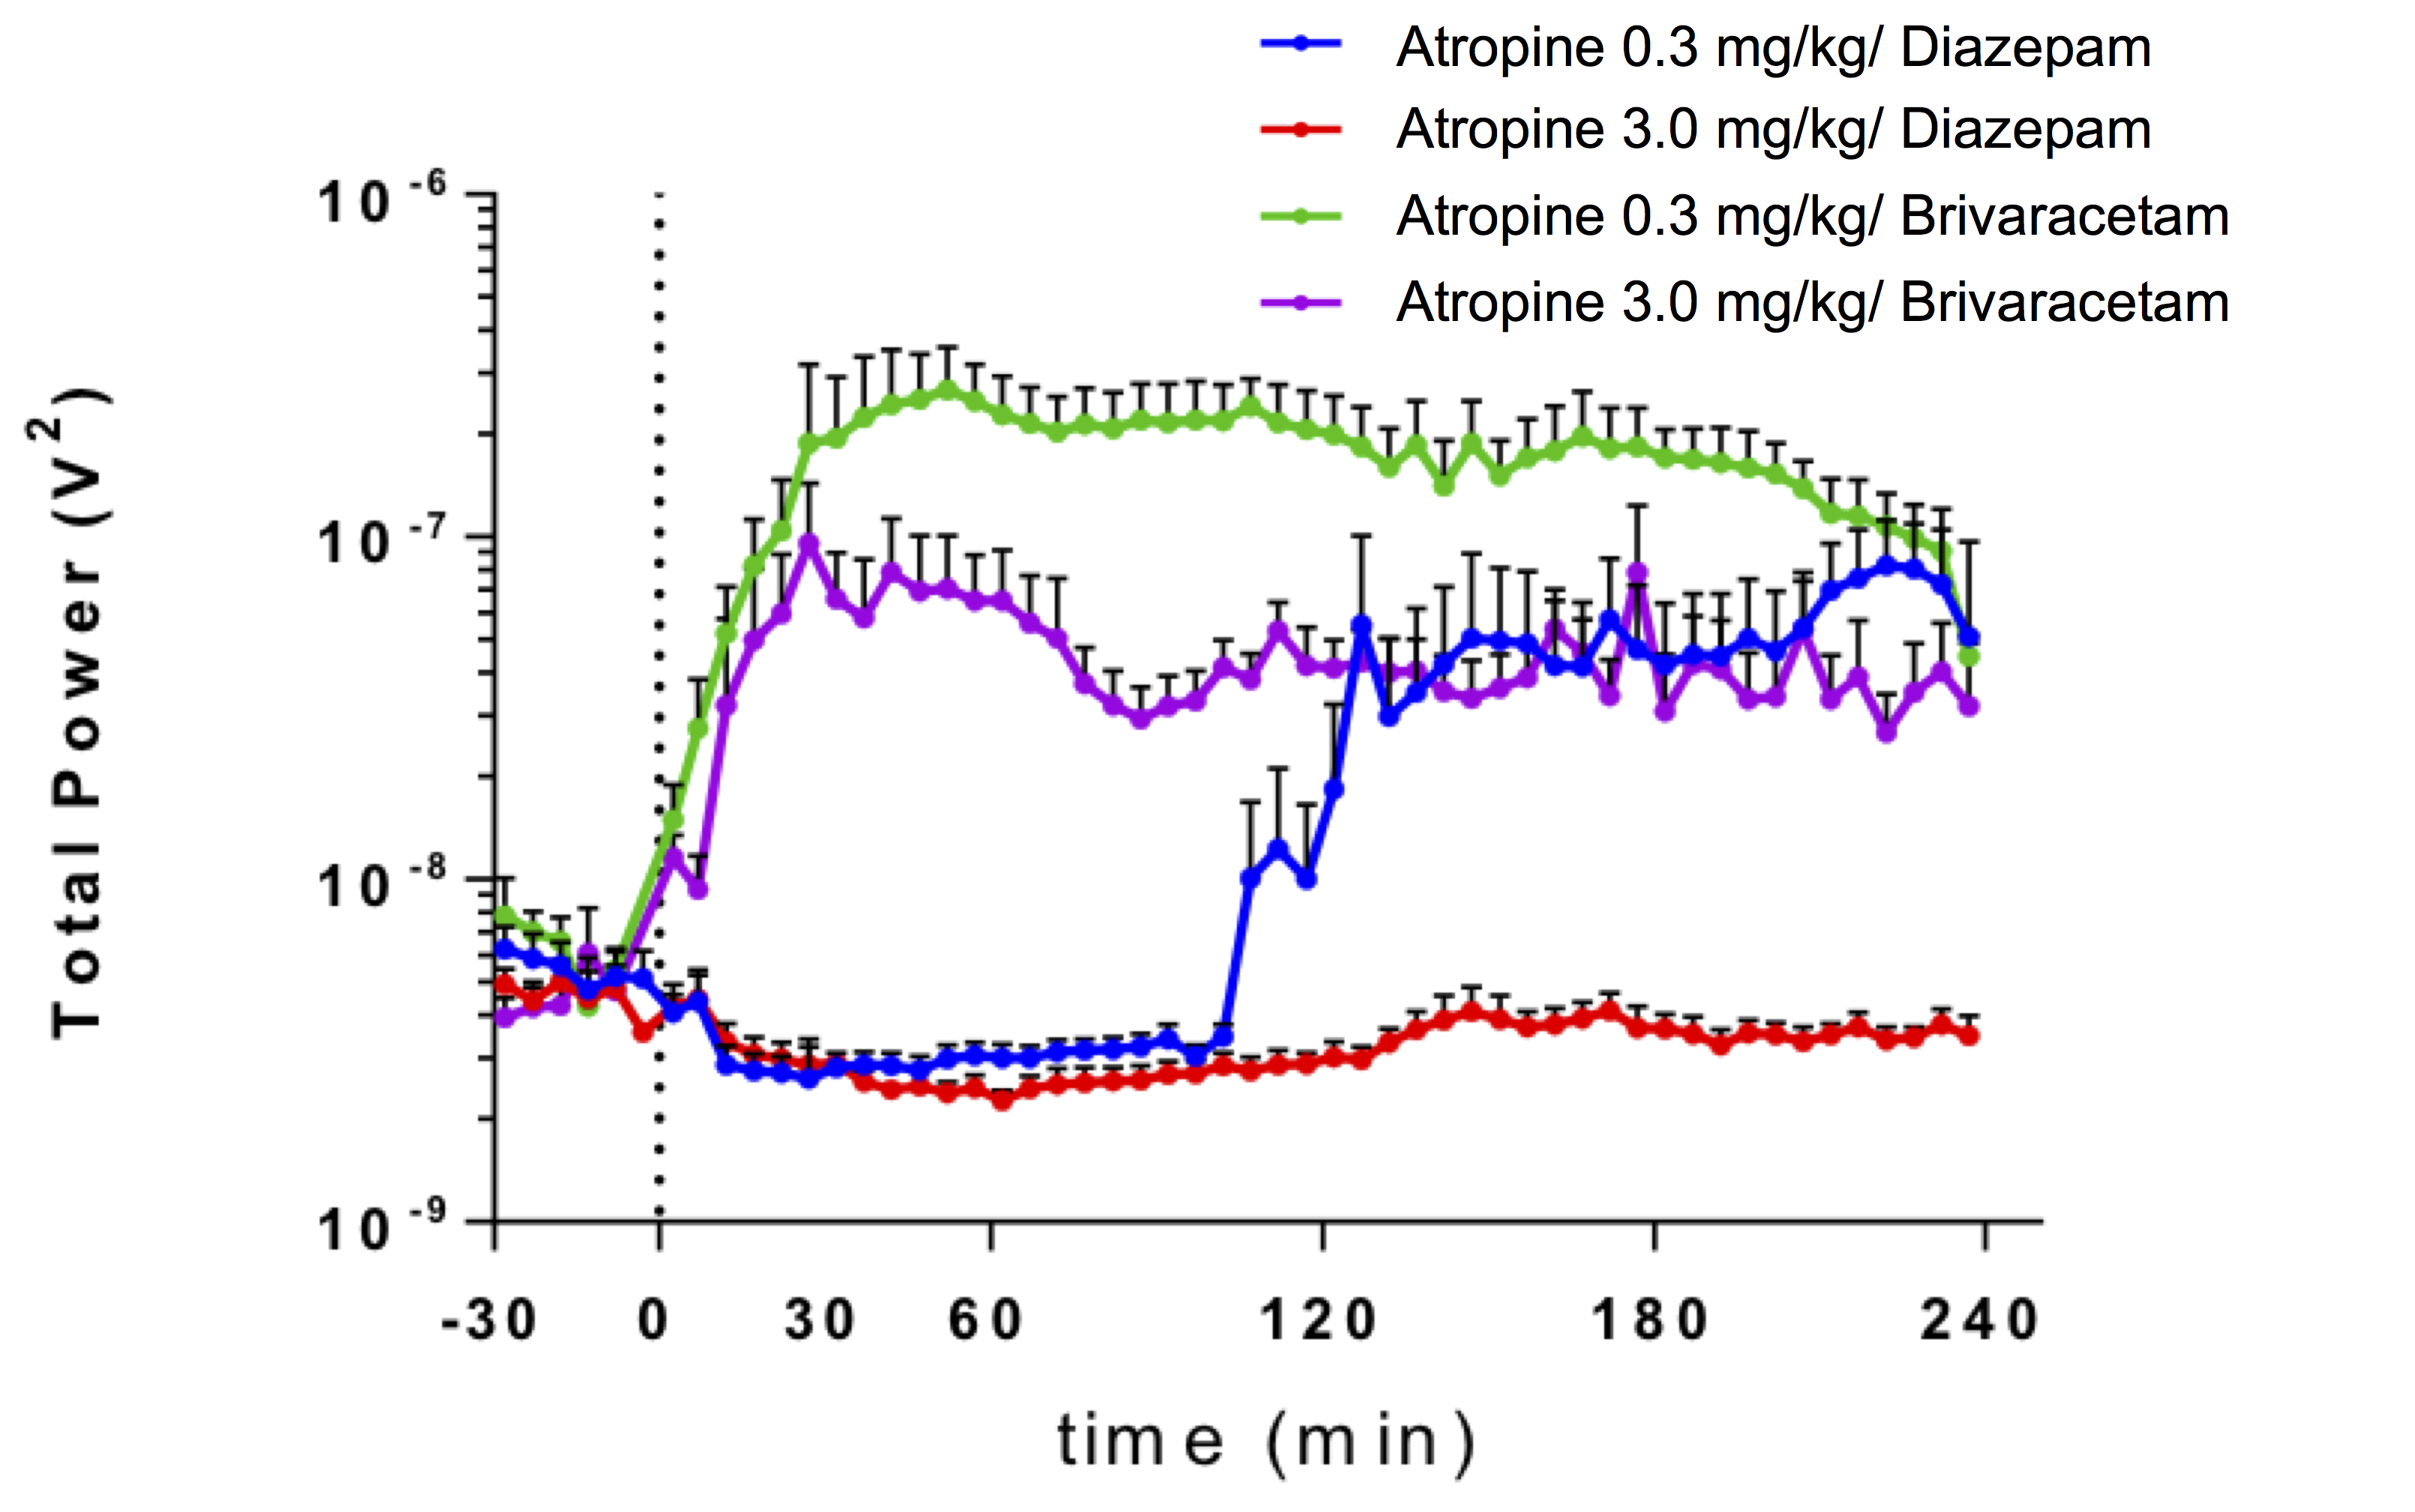
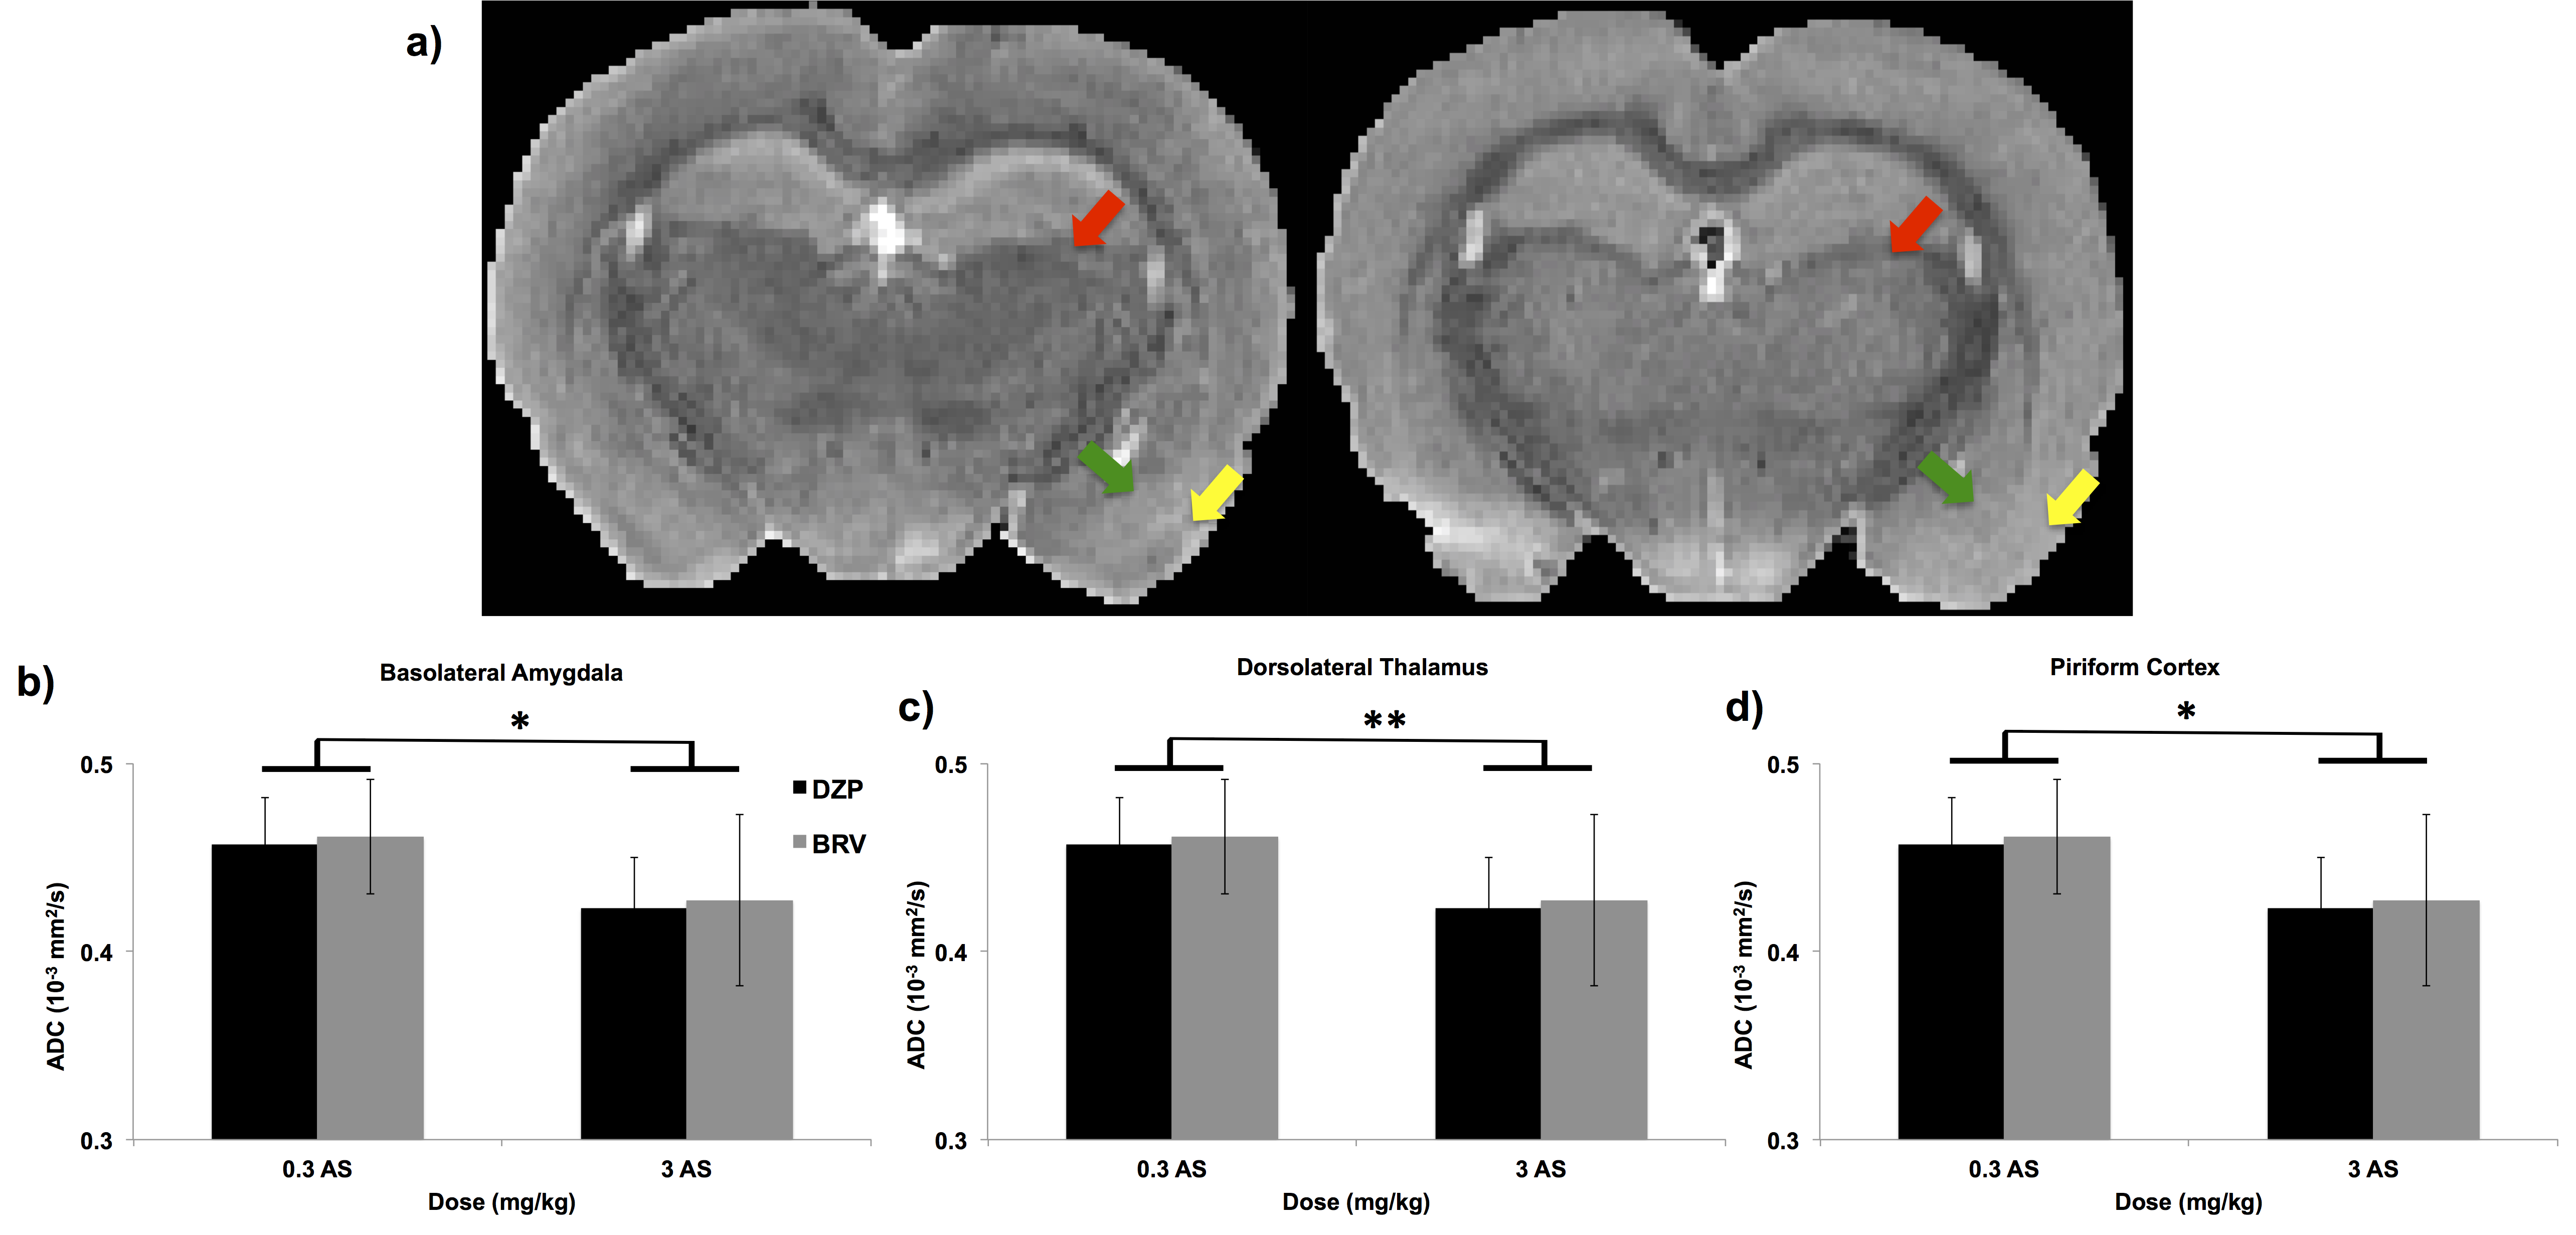
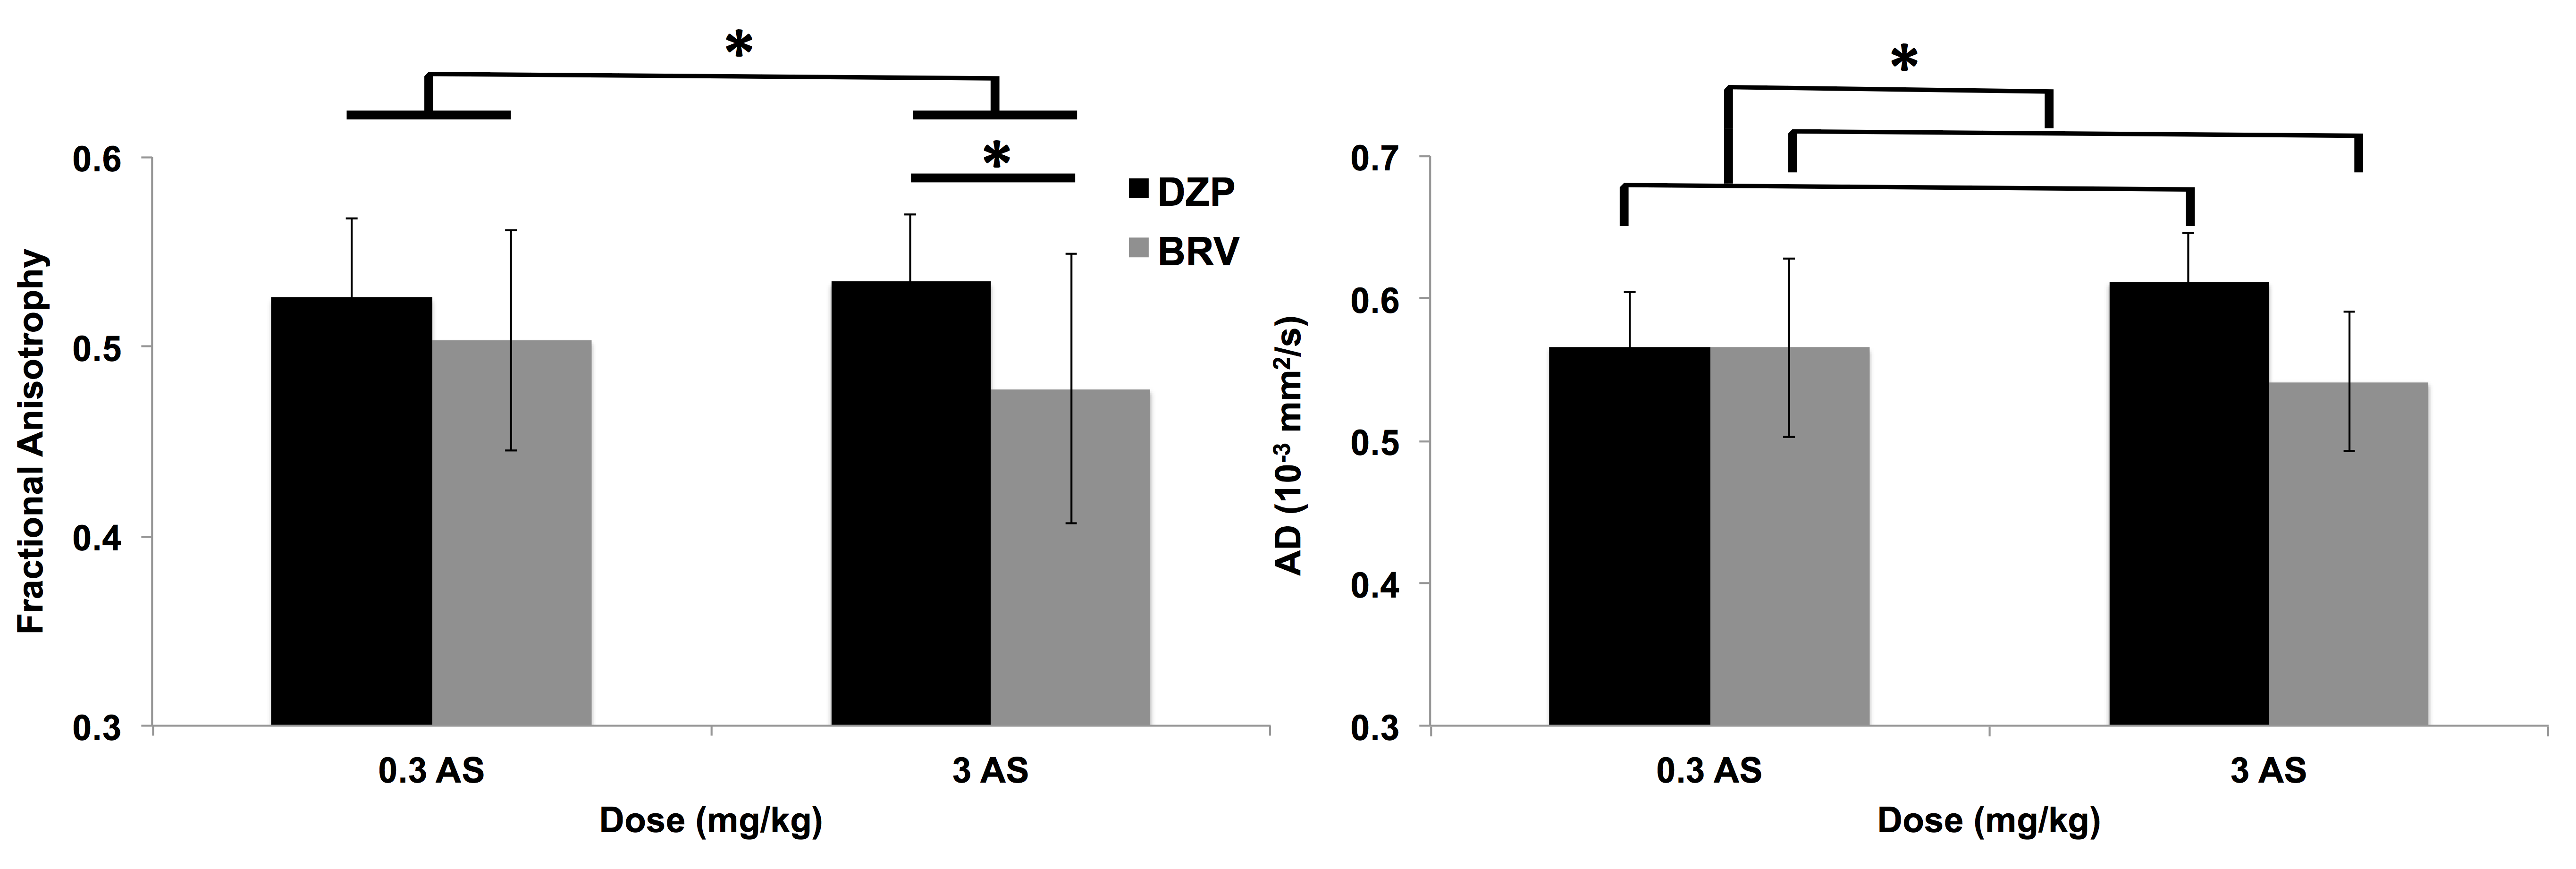
Male Wistar rats weighing 308±2g (n=24) were implanted with electroencephalography (EEG) electrodes to monitor seizure activity. Baseline EEG was recorded for 30 minutes before rats were subcutaneously exposed to 150μg/kg of soman, a CWNA. The rats were divided into four experimental groups (n=6 for each group; table 1). One minute after soman exposure, rats were treated intramuscularly with 0.3 or 3mg/kg atropine sulfate (AS) and 125mg/kg HI-6 oxime. Diazepam (DZP): 0.5mg/kg or Brivaracetam (BRV): 5mg/kg were given intramuscularly. Group 1: AS (low)/HI-6 and DZP, Group 2: AS (high)/HI-6 and DZP, Group 3: AS (low)/HI-6 and BRV, and Group 4: AS (high)/HI-6 and BRV. EEG was used to monitor seizure activity for 4 hours. The brains were extracted and imaged ex vivo using a 9.4T MRI and a Bruker Avance console with a 35mm volume coil. DTI was performed with an echo planar imaging (EPI) sequence: TR=12500ms, TE=36ms, number of averages=4, 30 directions, b-factor=3000s/mm2, matrix size=128x128, number of slices=50, and slice thickness=0.5mm. Acquisition time was approximately 2 hours. The images were analyzed using ExploreDTI to calculate fractional anisotropy (FA), axial diffusivity (AD), radial diffusivity (RD), and apparent diffusion coefficient (ADC)4. Regions of interest included piriform cortex, dorsolateral thalamus, basolateral amygdala, and corpus callosum. A two-way ANOVA was performed to analyze the changes in FA, AD, RD, and ADC followed by a Bonferroni post-hoc test. All statistical analysis was done with Sigma plot 13.0.Results:
Total EEG power showed that rats treated with DZP and high AS did not show seizure activity (Figure 1). Rats treated with low AS and DZP showed a delay in seizures onset for up to 40 minutes after soman exposure. BRV treated rats with high or low AS displayed seizure but high AS reduced total EEG power. A significant increase in ADC was found in rats treated with low AS concentration in the basolateral amygdala, dorsolateral thalamus, and piriform cortex (Figure 2). In the corpus callosum, rats that did have seizures (group 1, 2, and 4), display a significant decrease in the FA (Figure 3). In addition, AD was significantly reduced in BRV treated rats compared to DZP.Discussion:
DTI is sensitive to the microstructural changes from CWNA-induced seizures and was able to discern the efficacy of countermeasures. We found 1) increased ADC in rats treated with 0.3 mg/kg AS in the grey matter and 2) decrease in white matter integrity in rats showing convulsive seizures. The increase in ADC in the grey matter suggests neurodegeneration in rats treated with low AS. It is widely accepted in the field that soman-induced seizures cause glutamate excitotoxicity, leading to calcium influx and consequent neurodegeneration5-7. When neurodegeneration occurs, the diffusion of water becomes less restricted, causing an increase in ADC. The piriform cortex, basolateral amygdala, and dorsolateral thalamus are regions that are sensitive to soman-related neuropathology and also important in the initiation, propagation, and maintenance of soman-induced seizures8-10. DTI was sensitive in detecting changes reflective of neurodegeneration following CWNA-induced seizures. The microstructural change in the white matter suggests that there is axonal damage. In rats that had seizures, FA and AD was decreased, which suggests axonal injury11. Although axonal damage was histologically detected in previous CWNA12,13, this is the first time it was measured through MRI. The data suggest that DTI is sensitive in measuring axonal damage following CWNA-induced seizures.Conclusion:
We used DTI to measure microstructural changes to determine the efficacy of anti-seizure drugs and different dosages of atropine sulfate. The finding suggests AS may be neuroprotective against CWNA and modulate seizures hence reduce the neurodegeneration and axonal injury. We have shown that DTI may be a reliable method in studying the efficacy of novel countermeasures against CWNA.Acknowledgements
This research was supported by the Department of National Defence, Canada.
We thank the Brain Canada Platform grant.
References
1. Kawana, N., Ishimatsu, S. & Kanda, K. Psycho-physiological effects of the terrorist sarin attack on the Tokyo subway system. Mil Med 166, 23-26 (2001).
2. Newmark, J. Nerve agents. Neurologist 13, 20-32, doi:10.1097/01.nrl.0000252923.04894.53 (2007).
3. Myhrer, T., Mariussen, E., Enger, S. & Aas, P. Capacities of metabotropic glutamate modulators in counteracting soman-induced seizures in rats. Eur J Pharmacol 718, 253-260, doi:10.1016/j.ejphar.2013.08.024 (2013).
4. Leemans, A., Jeurissen, B., Sijbers, J. & Jones, D. ExploreDTI: a graphical toolbox for processing, analyzing, and visualizing diffusion MR data. In: 17th Annual Meeting of Intl Soc Mag Reson Med, p. 3537, Hawaii, USA, 2009 (2009).
5. Wade, J. V., Samson, F. E., Nelson, S. R. & Pazdernik, T. L. Changes in extracellular amino acids during soman- and kainic acid-induced seizures. J Neurochem 49, 645-650 (1987).
6. Fujikawa, D. G. The role of excitotoxic programmed necrosis in acute brain injury. Comput Struct Biotechnol J 13, 212-221, doi:10.1016/j.csbj.2015.03.004 (2015).
7. Lallement, G. et al. Neuroprotective activity of glutamate receptor antagonists against soman-induced hippocampal damage: quantification with an omega 3 site ligand. Brain Res 618, 227-237 (1993).
8. Myhrer, T., Enger, S. & Aas, P. Roles of perirhinal and posterior piriform cortices in control and generation of seizures: a microinfusion study in rats exposed to soman. Neurotoxicology 31, 147-153, doi:10.1016/j.neuro.2009.10.002 (2010).
9. Myhrer, T., Enger, S. & Aas, P. Anticonvulsant efficacy of drugs with cholinergic and/or glutamatergic antagonism microinfused into area tempestas of rats exposed to soman. Neurochem Res 33, 348-354, doi:10.1007/s11064-007-9429-3 (2008).
10. Prager, E. M. et al. Acetylcholinesterase inhibition in the basolateral amygdala plays a key role in the induction of status epilepticus after soman exposure. Neurotoxicology 38, 84-90, doi:10.1016/j.neuro.2013.06.006 (2013).
11. Song, S. K. et al. Dysmyelination revealed through MRI as increased radial (but unchanged axial) diffusion of water. Neuroimage 17, 1429-1436 (2002).
12. Baille, V. et al. Soman-induced convulsions: the neuropathology revisited. Toxicology 215, 1-24, doi:10.1016/j.tox.2005.05.028 (2005).
13. Petras, J. M. Neurology and neuropathology of Soman-induced brain injury: an overview. J Exp Anal Behav 61, 319-329, doi:10.1901/jeab.1994.61-319 (1994).
Figures