2795
Chemical exchange saturation transfer imaging depending on several neurodegenerative diseases at 3T1Tokushima University, Tokushima, Japan, 2Global MR Applications and Workflow, GE Healthcare Japan, Tokyo, Japan
Synopsis
In this study, CEST imaging was performed on the substantial nigra, the basal ganglia, and cerebral cortex level to reveal the mechanism each neurodegenerative disease. For this study, patients with Parkinson’s disease, multiple system atrophy, progressive supranuclear palsy, and spinocerebellar degeneration were examined. Region-of-interest analysis was performed in the substantia nigra, red nuclei, lentiform nucleus, and supplementary motor area. As the results, the CEST parameters were significantly different for each of the neurodegenerative diseases. CEST imaging might have the ability to obtain abnormal proteins each of the neurodegenerative diseases.
Introduction & Purpose
Chemical exchange saturation transfer (CEST) imaging may provide important insight into several types of mobile proteins, which are reflected in neurodegenerative diseases [1]. Our previous study showed that estimated CEST parameters on red nuclei and substantia nigra were different among several neurodegenerative diseases [2]. This result may suggest that the accumulation of the mobile protein in the red nuclei and the substantia nigra is different, depending on the neurodegenerative disease. However, the substantia nigra is part of the basal ganglia, and abnormal proteins would be accumulated in other basal ganglia areas. In this study, CEST imaging was performed on the substantial nigra, the basal ganglia, and cerebral cortex level to reveal the mechanism of each neurodegenerative disease.Materials & Methods
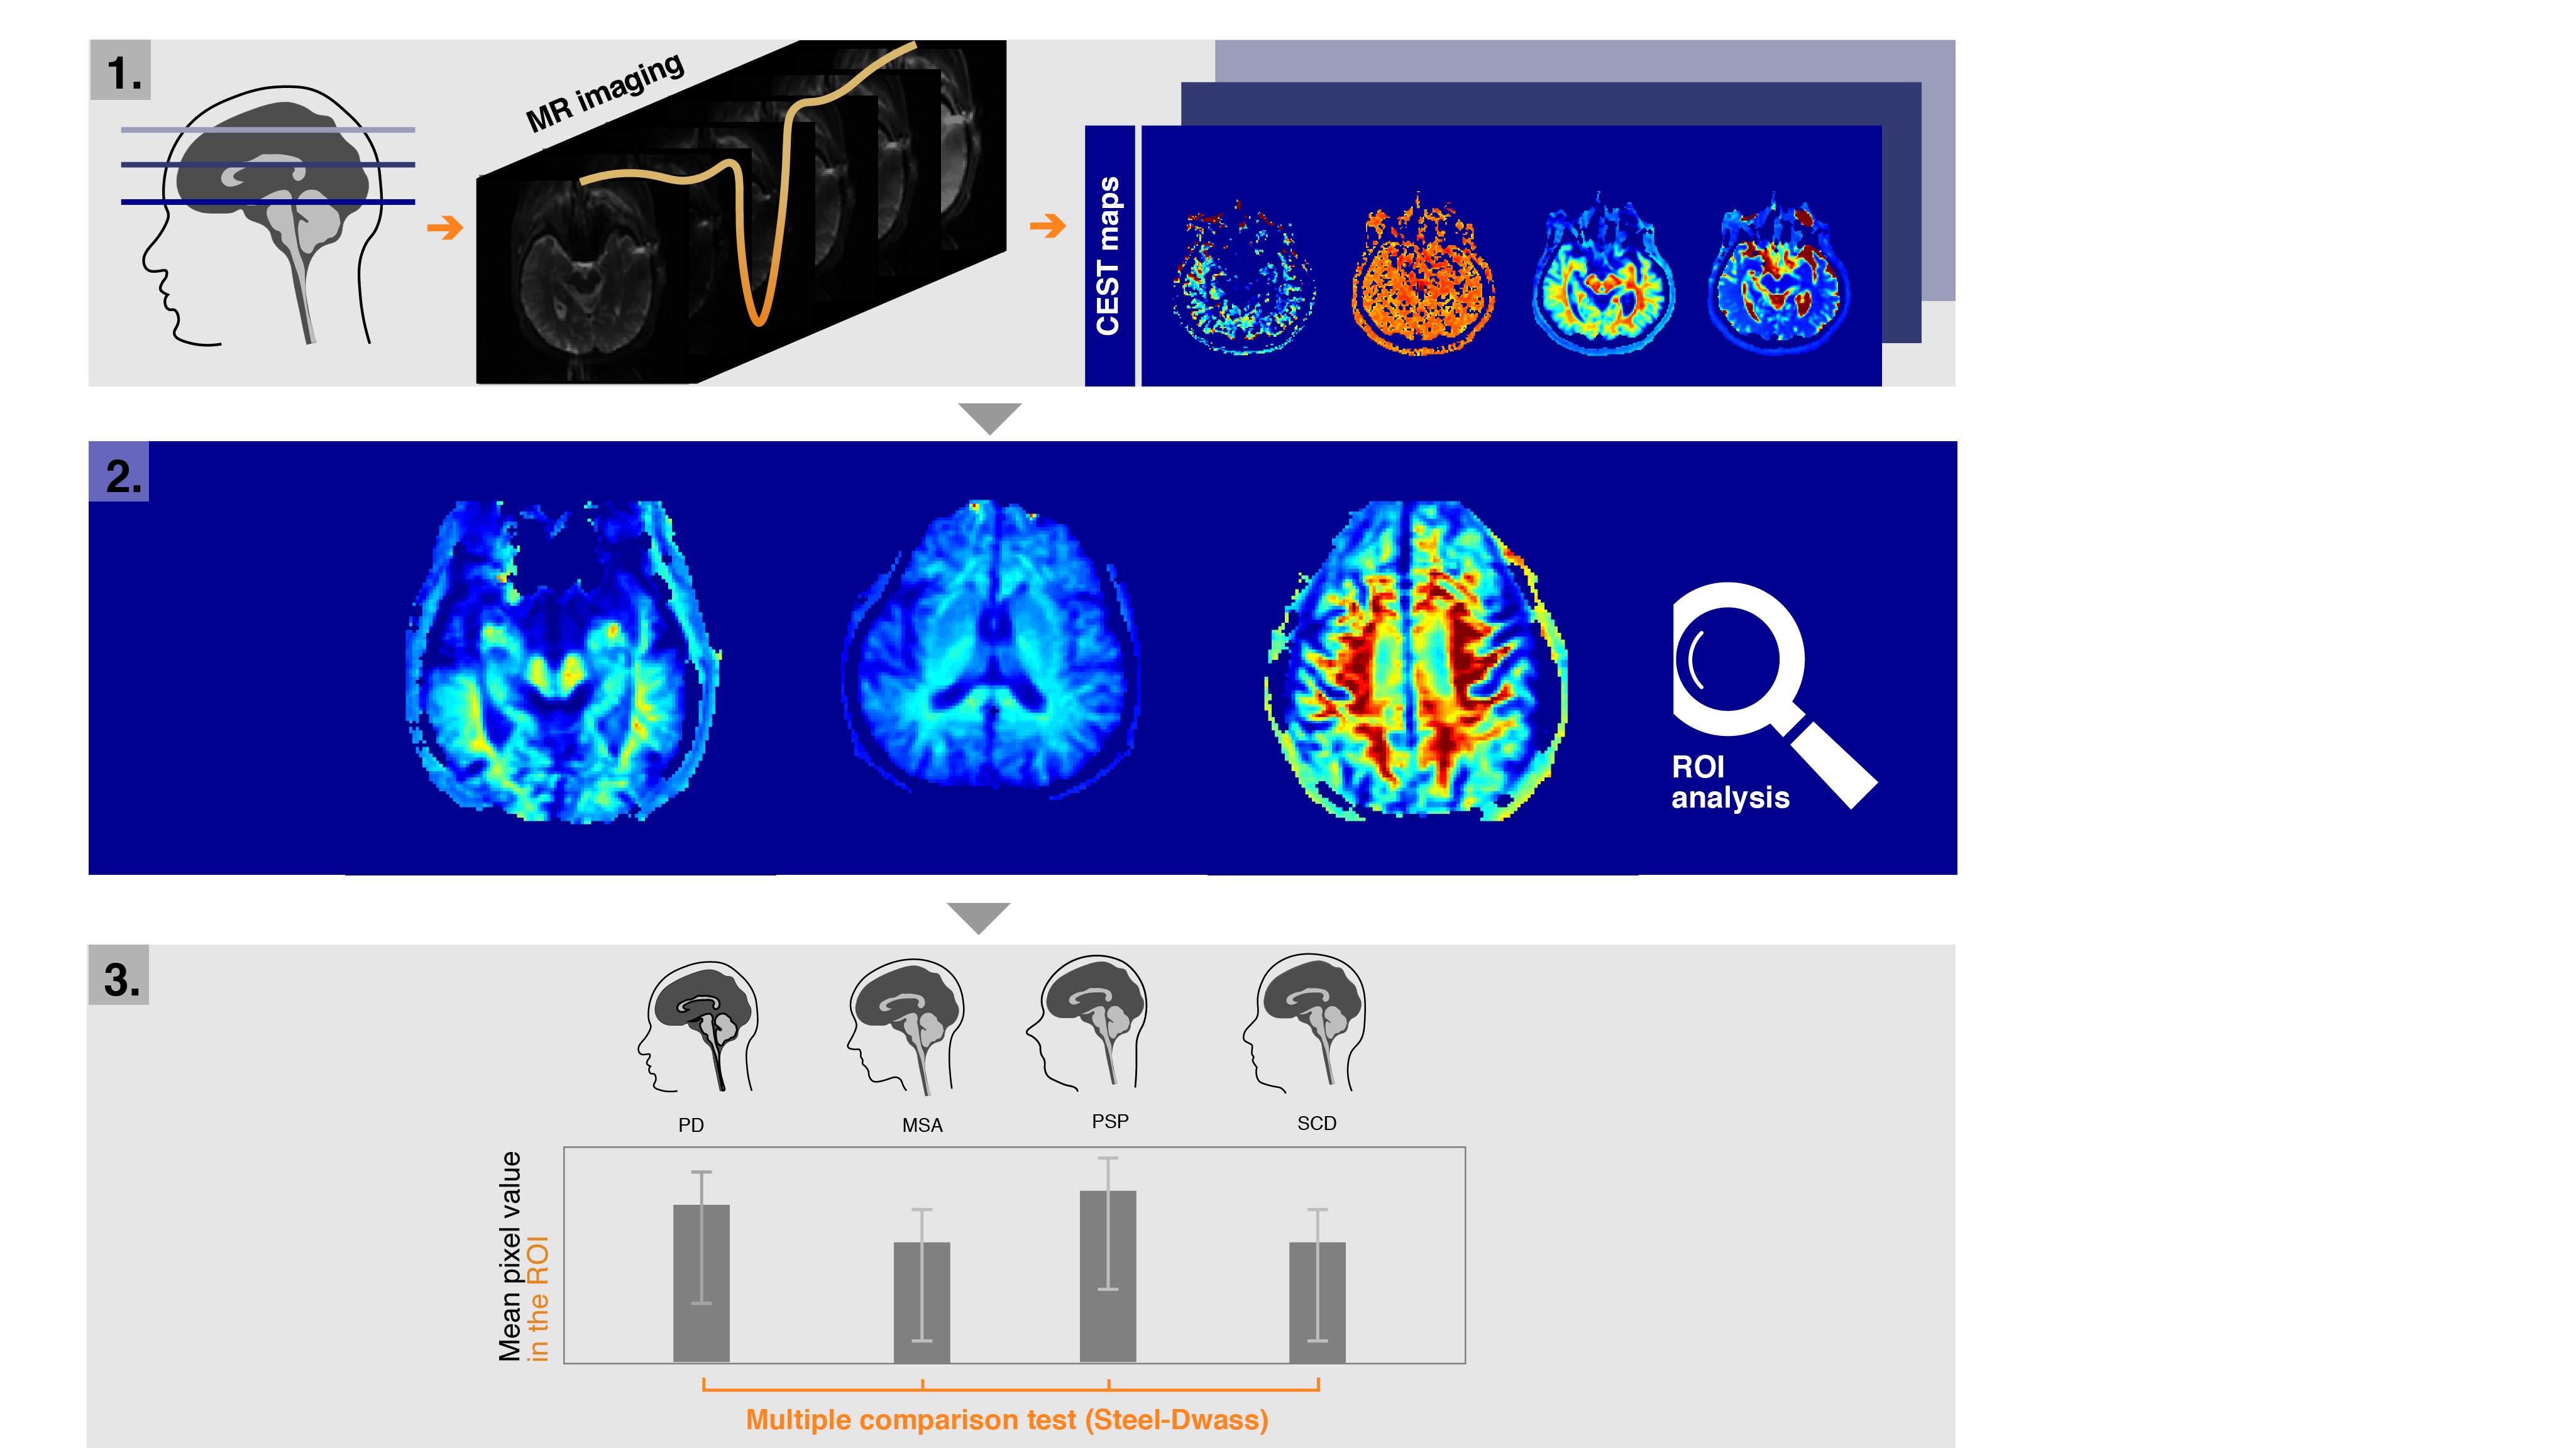
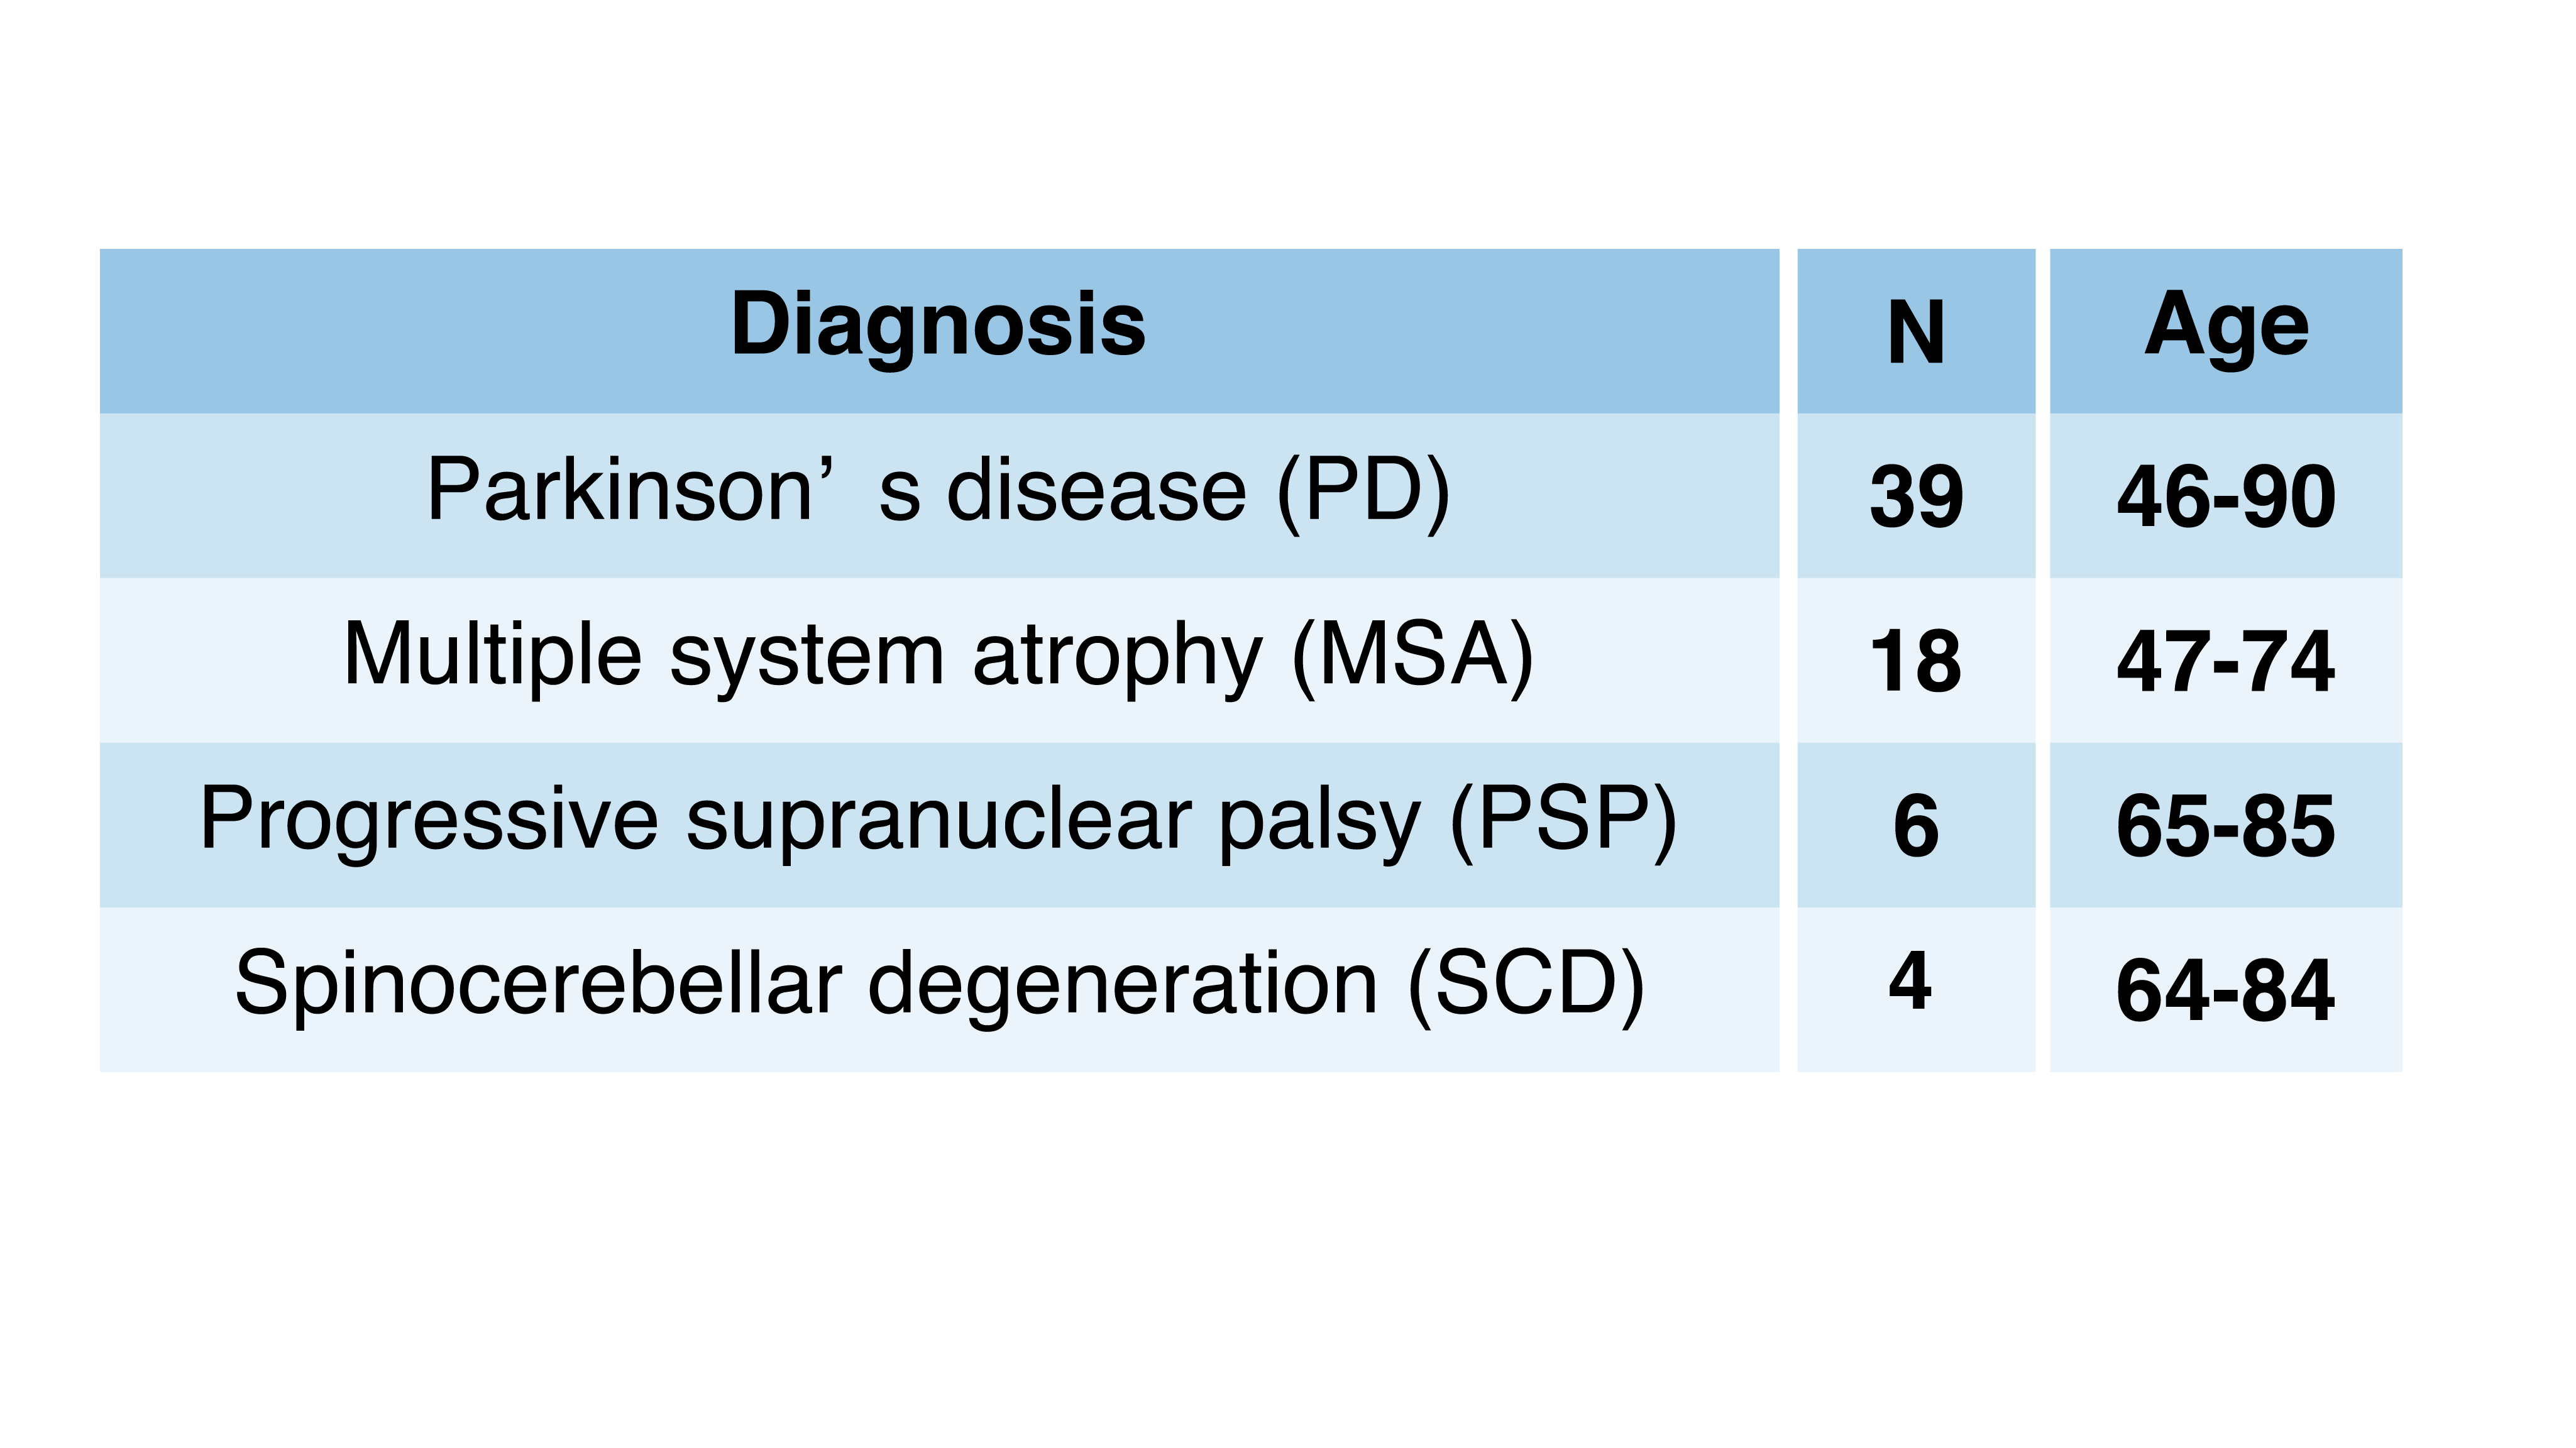
This study was approved by the local institutional review board. Figure 1 shows a schematic illustration of this experiment. The CEST imaging was performed on patients with PD, multiple system atrophy (MSA), progressive supranuclear palsy (PSP), and spinocerebellar degeneration (SCD) (see Fig.2). All imaging data were acquired on a 3.0 T MR system (Discovery 750, GE Healthcare) with a specialized echo-planner imaging sequence. The imaging parameters for CEST images were echo time, 20.3 ms; repetition time, 3000 ms; bandwidth, 3906 Hz/pixel; field of view, 22 cm; matrix size, 128×128; slice thickness, 5 mm; phase cycle radio frequency (RF) preparation (mean B, 2 μT); and offset frequency equivalent to ±7 ppm per 32 steps. Three transverse slices of the midbrain, the basal ganglia, and the cerebral cortex level were obtained. After acquiring imaging data, APT, pH, MT, and the ratio of T1 and T2 values (T1/T2) were calculated from the CEST peak extraction (CPE) fitting method [3]. Then, the estimated CEST value on the substantia nigra (SN), red nuclei (RN), lentiform nucleus (LN), and supplementary motor area (SMA) was obtained, drawing a region of interest (ROI). Finally, multiple comparison tests were carried out to compare whether there is a difference among the neurodegenerative diseases. In the calculated images, a P < 0.05 was considered to be statistically significant.Results & Discussions
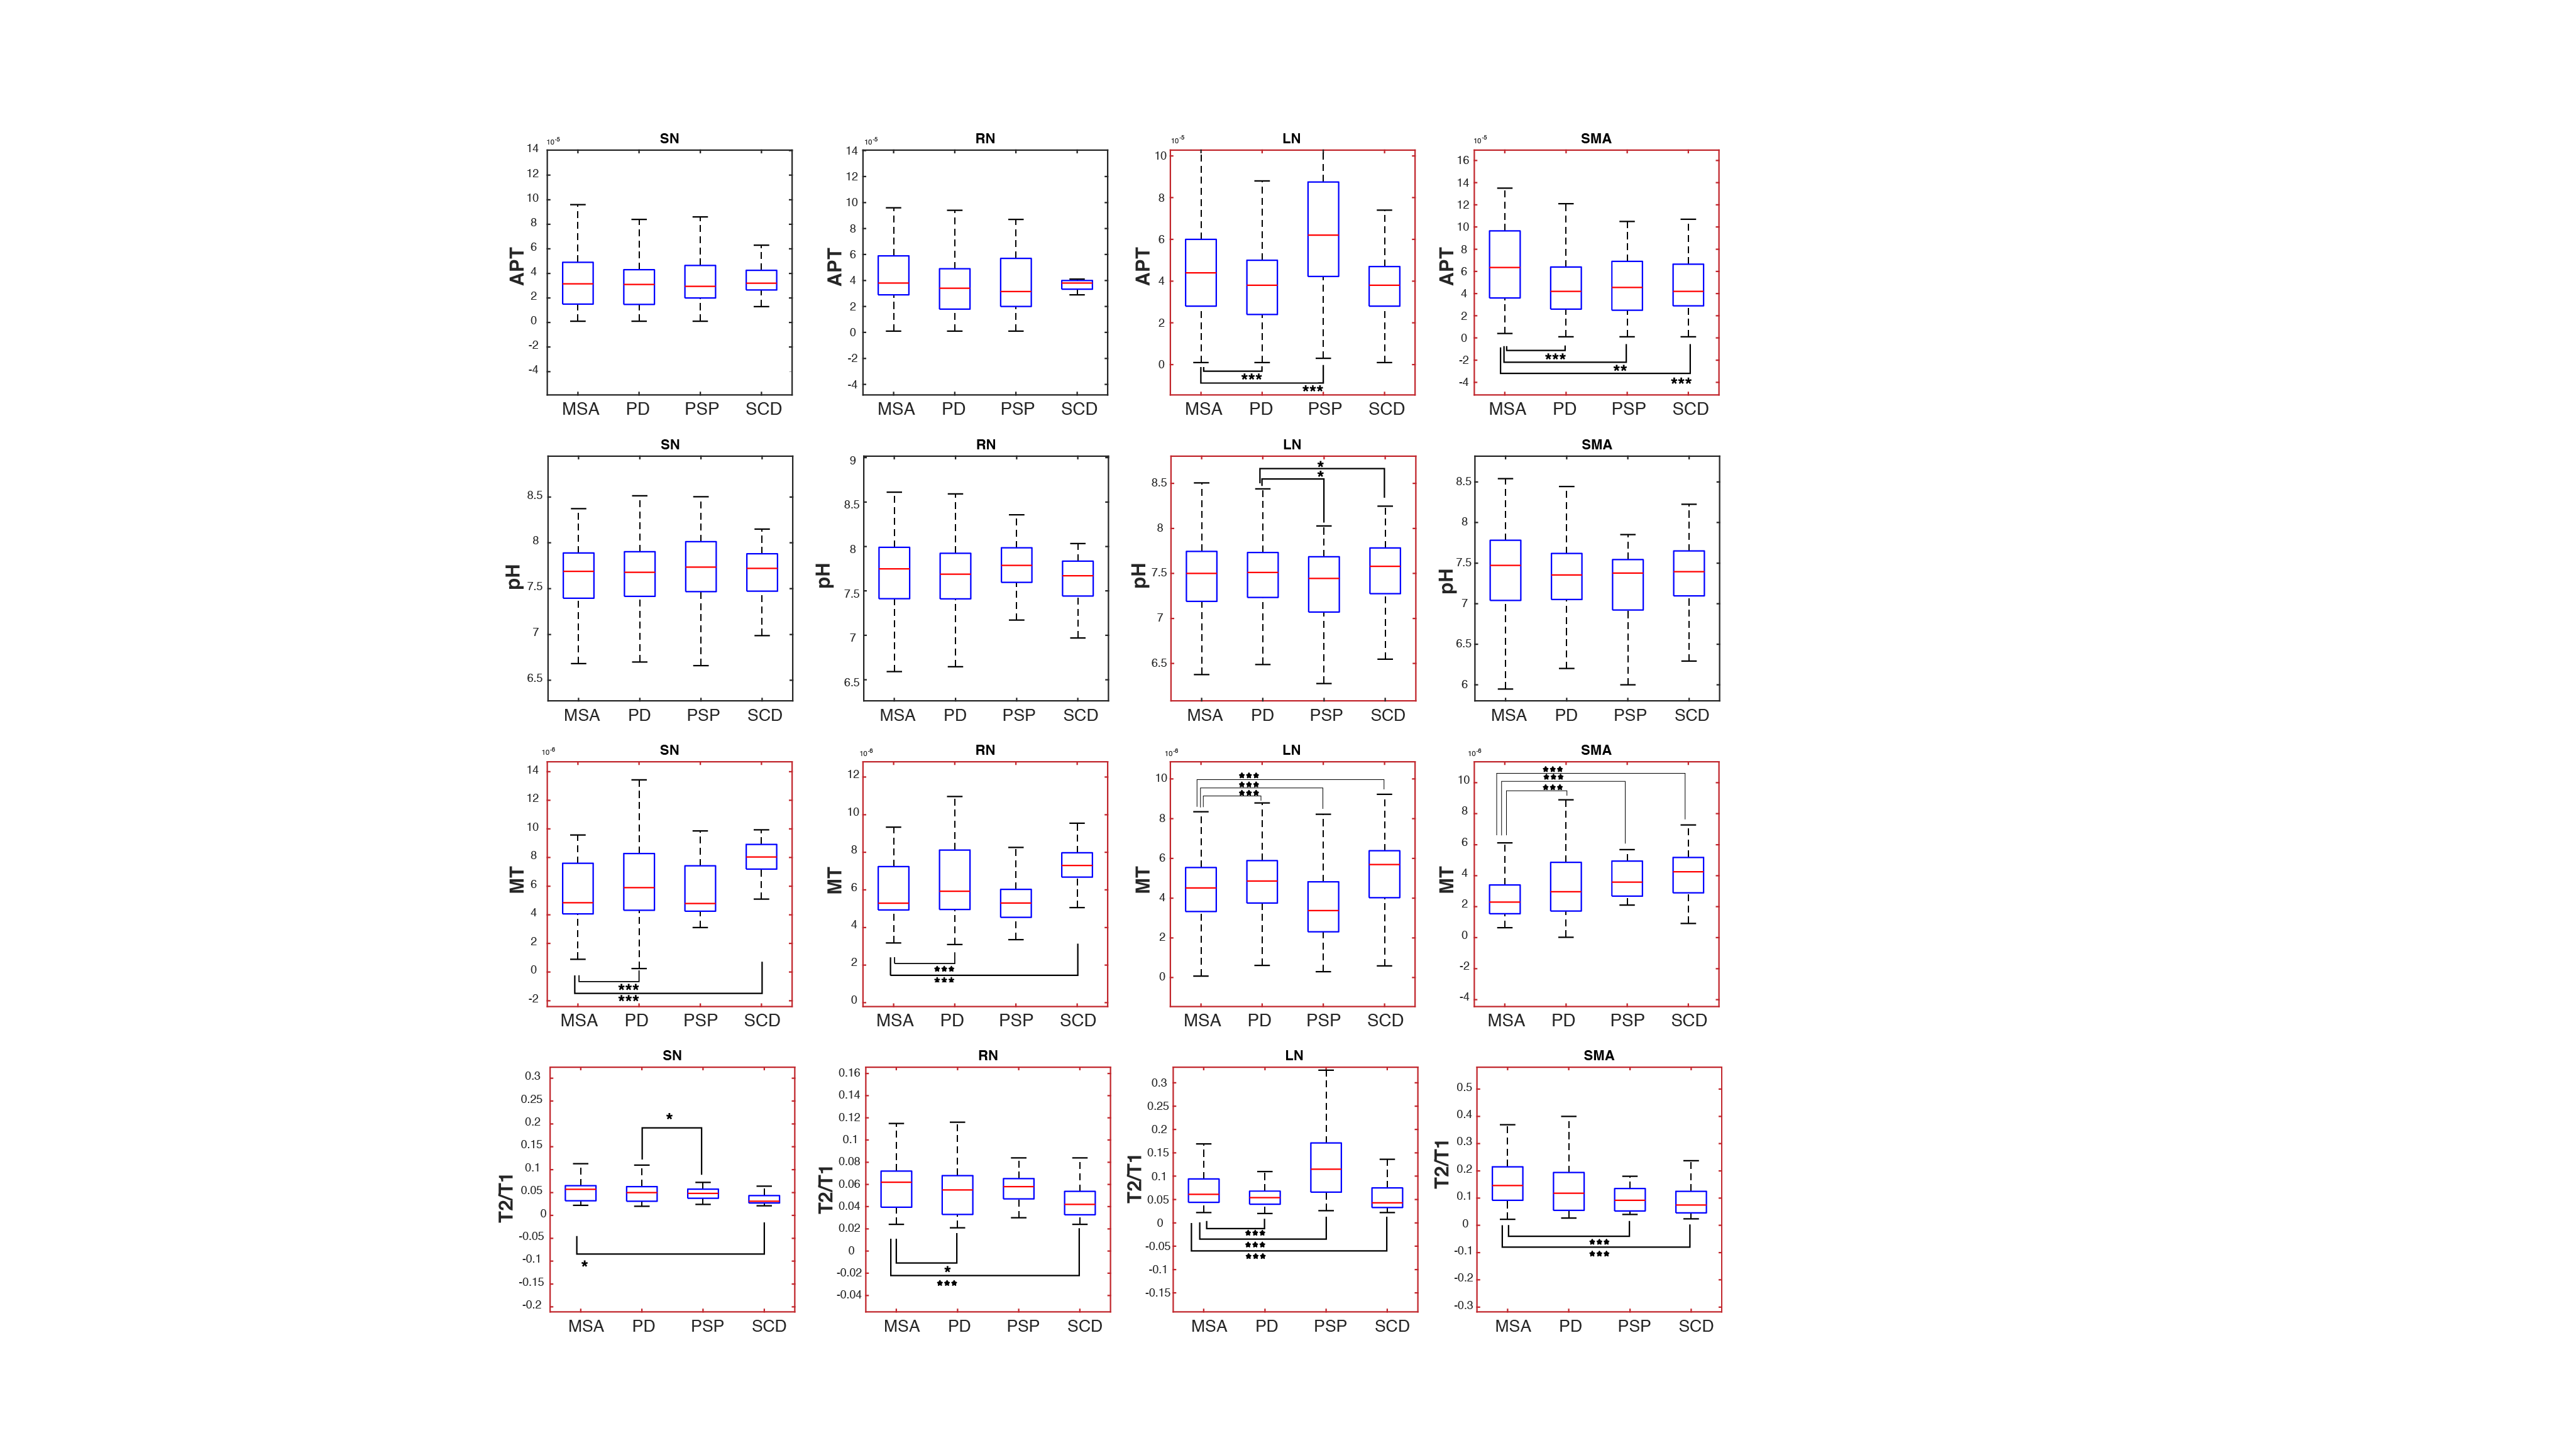
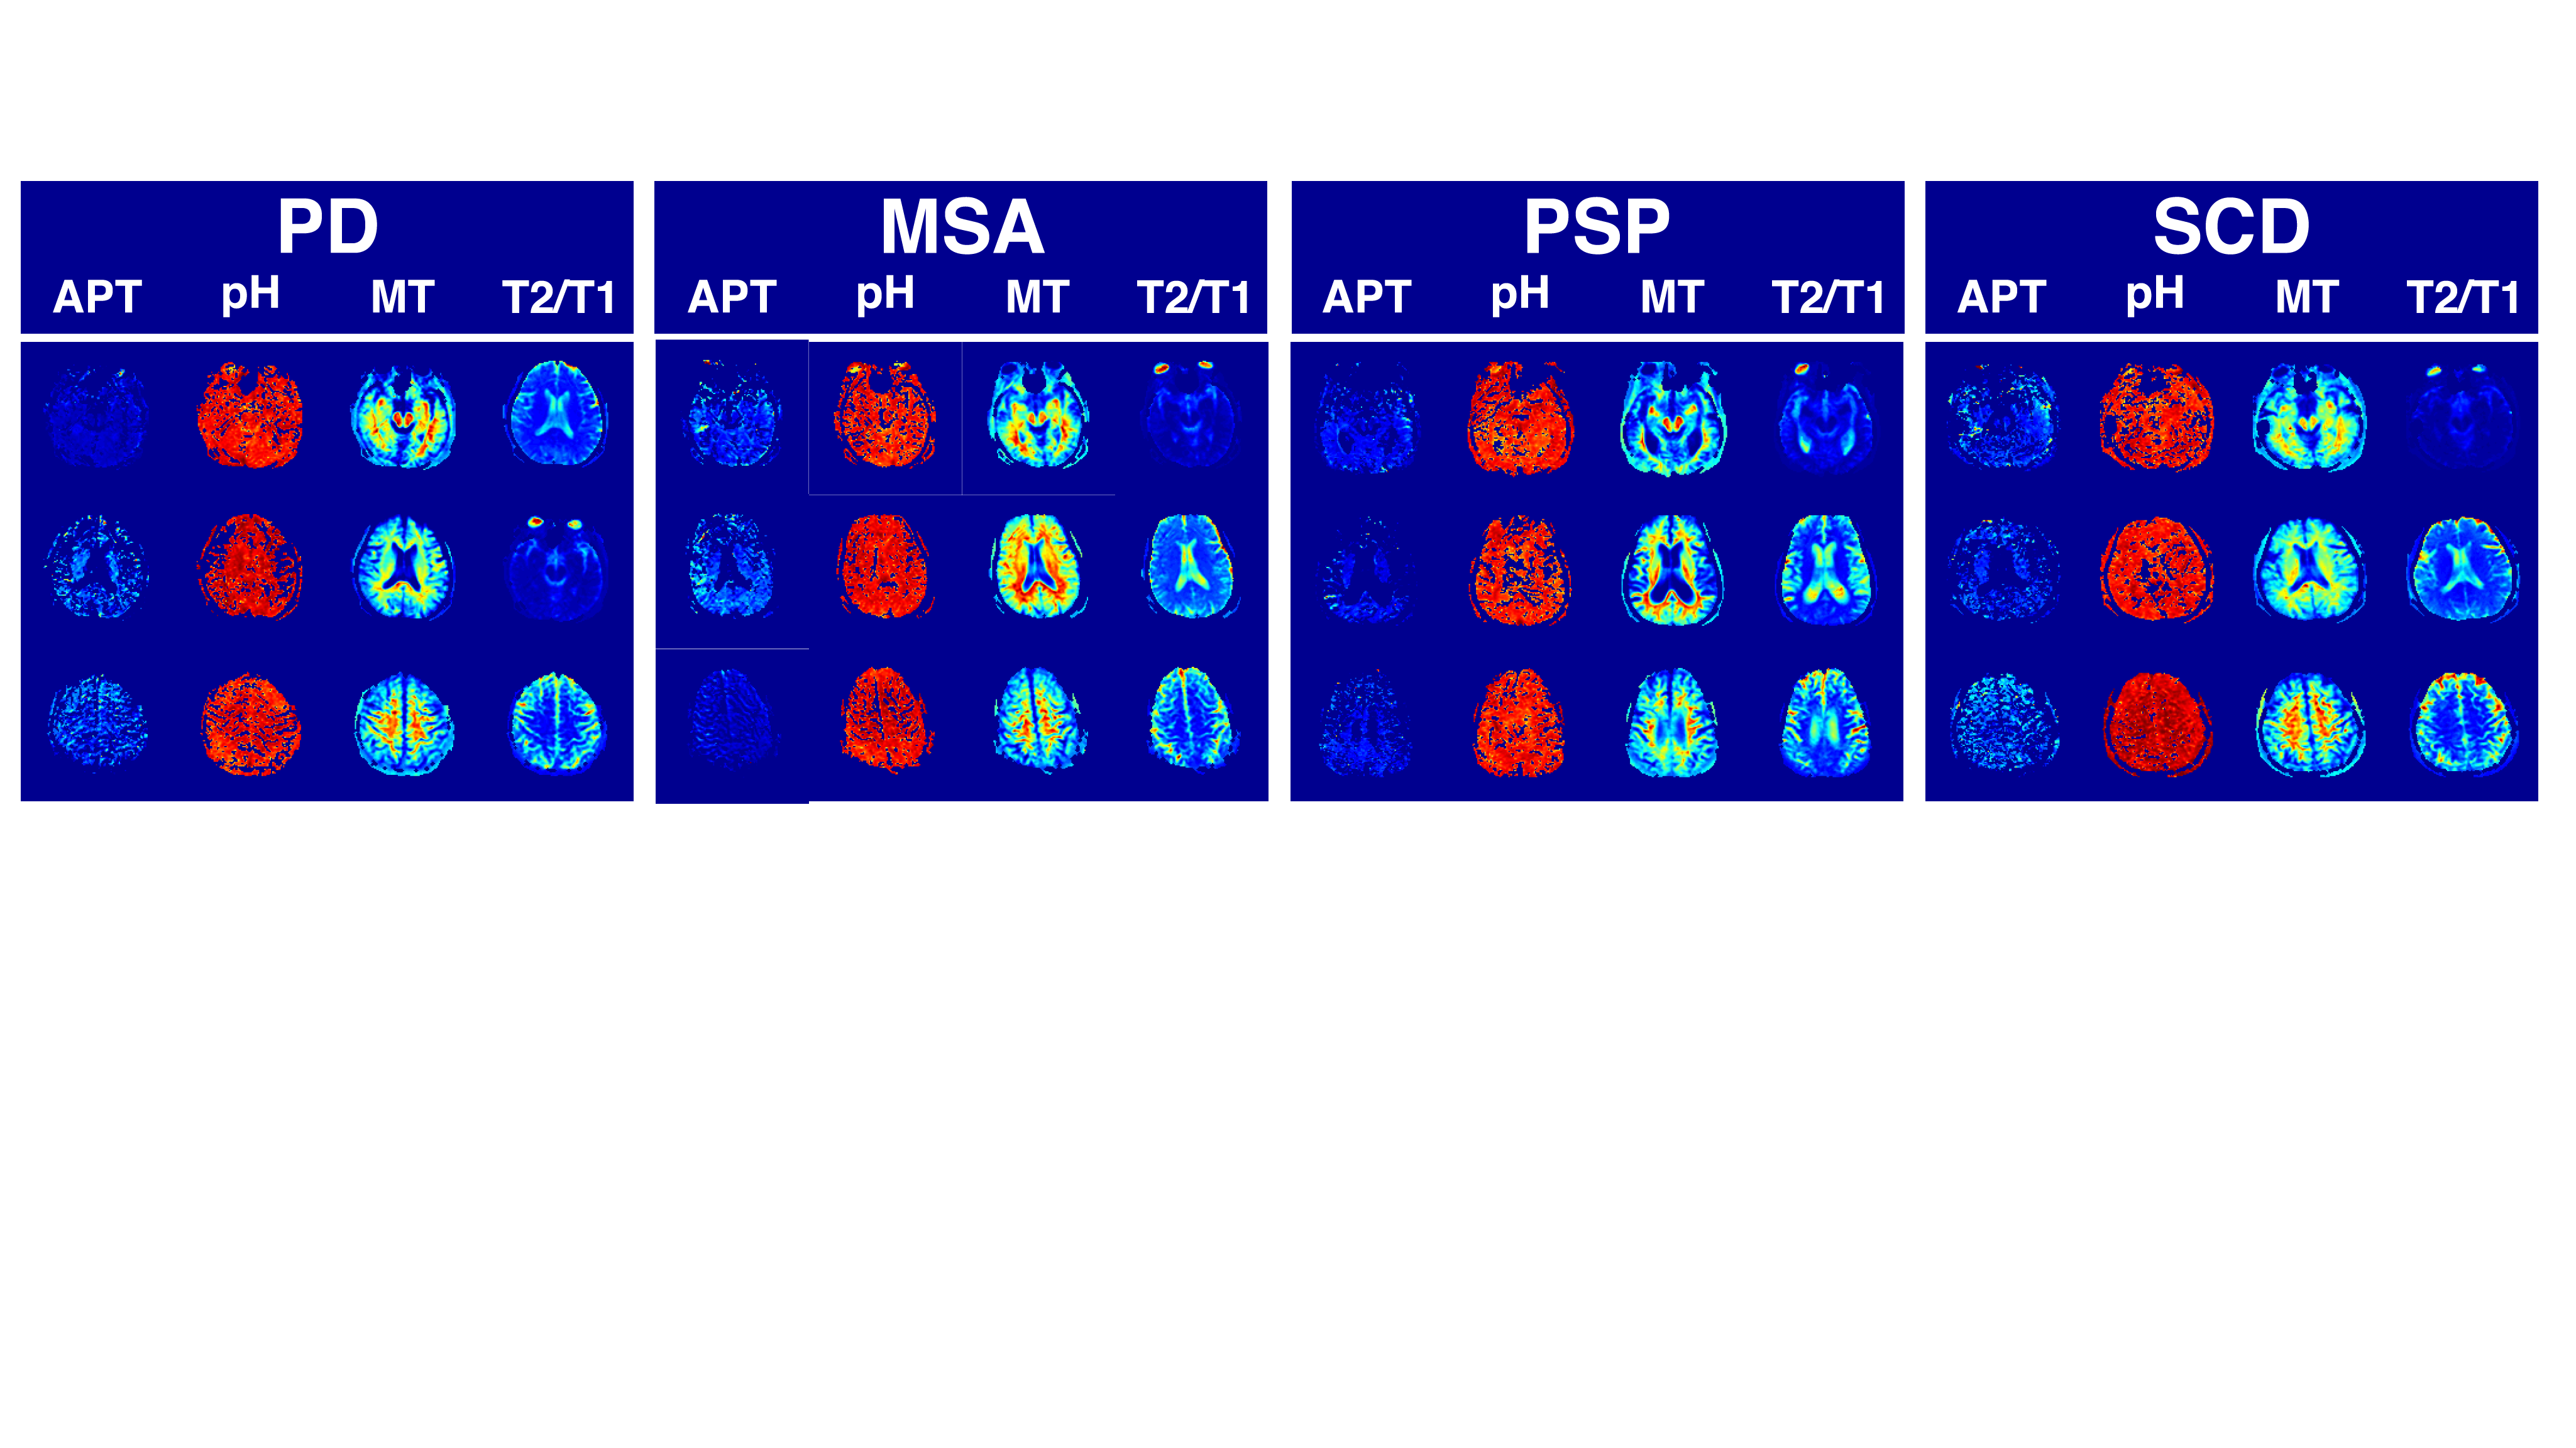
Figure 3 shows plots of the mean, APT, pH, MT, and T2/T1 values for the substantia nigra and red nucleus areas for PD patients (n = 39), MSA patients (n = 18), PSP patients (n =6), and SCD patients (n=4) from the ROI analysis. Figure 4 shows represented CEST images. In the substantia nigra region, the mean MT value for the MSA patients was significantly lower than that of the PD and SCD patients (P < 0.001). In the red nucleus region, the mean MT value of the MSA patients was also significantly lower than that of the PD and the SCD patients (P < 0.001). In the lentiform nucleus, APT value for the PSP was significantly higher than that of other neurodegenerative diseases. From the results, we hypothesized that CEST imaging can measure abnormal proteins depending on the various neurodegenerative in the several brain levels such as the basal ganglia. Our results may lead us to detect unique properties of various neurodegenerative diseases.Conclusion
CEST images derived from the CPE fitting method might give us the ability to reveal the mechanism of each neurodegenerative disease in the future.
Acknowledgements
No acknowledgment found.References
[1] Li C1, Peng S, Wang R, Chen H, Su W, Zhao X, Zhou J, Chen M. Chemical exchange saturation transfer MR imaging of Parkinson's disease at 3 Tesla. Eur Radiol. 2014 Oct;24(10):2631-9.
[2] Matsumoto Y, Harada M, Kanazawa Y, Otomo M, and Miyoshi M. Chemical exchange saturation transfer imaging for neurodegenerative diseases.Proceedings of the 23th Annual Meeting of ISMRM. 2018;8024
[3] Miyoshi M, Matsuda T, and Kabasawa H. CEST Peak Extraction method for multi peak fitting. Proceedings of the 23th Annual Meeting of ISMRM. 2015;3346
Figures