2794
Improved sensitivity to longitudinal changes with advanced DTI analysis in a rare neurodegenerative disease1Department of Radiology, University of Minnesota, Minneapolis, MN, United States, 2Department of Neurology, University of Minnesota, Minneapolis, MN, United States
Synopsis
We present an optimized processing pipeline for longitudinal DTI data analysis in spinocerebellar ataxia type 1 (SCA1) patients, a rare neurodegenerative disease. Tract-based spatial statistics (TBSS) analysis was used to investigate longitudinal changes in white matter (WM) integrity in patients. While no significant changes in WM integrity were observed using the standard TBSS analysis pipeline, TBSS with advanced spatial normalization with DTITK tool showed significant longitudinal alterations in WM integrity. This result suggests that the use of advanced spatial normalization must be considered for longitudinal group studies of DTI data, especially when small to moderate disease effects are expected.
Purpose
Detecting longitudinal changes of brain pathology in neurodegenerative diseases is often challenging due to their slow progression, and the need to monitor the patients over years. Rare neurodegenerative diseases present an added difficulty with small sample sizes. Therefore, identifying the analytic pipelines for best sensitivity to monitor imaging changes is essential.
Microstructural differences between patients with spinocerebellar ataxia type 1 (SCA1), a rare hereditary movement disorder, and healthy controls were previously reported in cross-sectional diffusion tensor imaging (DTI) studies [1-3]. However, microstructural changes in SCA1 have not been monitored longitudinally. In this study, our goal was to develop an optimized analytic pipeline with high sensitivity to longitudinal changes in white matter (WM) integrity in SCA1 patients. We hypothesized that modifications to the standard DTI processing pipeline [4] would improve sensitivity to longitudinal changes in WM integrity.
Methods
Eight patients (2 males, 54±10 years for baseline scan) with SCA1 at early disease stage (Scale for the Assessment and Rating of Ataxia (SARA) [5] mean = 6, range = 0-13) were scanned using a 3T Siemens Trio system to obtain HARDI data (1.8x1.8x1.8 mm3, b=1500s/mm2, 128 gradients with 15 additional b=0 volumes). The subjects underwent the same protocol 1.5-3 years following the baseline scan (SARA mean = 8, range 0-16.5). Postprocessing of DTI data in the subject’s native space was performed using diffusion processing pipeline in FSL (FDT) [6]. Tract-based spatial statistics (TBSS) [7] was used to identify alterations in WM integrity, using fractional anisotropy (FA) as the primary metric. The spatial normalization results from the TBSS pipeline were also used to transform WM labels from atlases to subject space for region-of-interest (ROI) analysis. Finally, enhancements to the TBSS pipeline such as the use of different FA templates [8-10], or advanced normalization technique such as DTITK [11, 12] were considered to identify the best strategy for detecting subtle within-subject changes in the brain (Figure 1). Paired two-group GLM analysis was performed on the spatially normalized and skeletonized data.Results
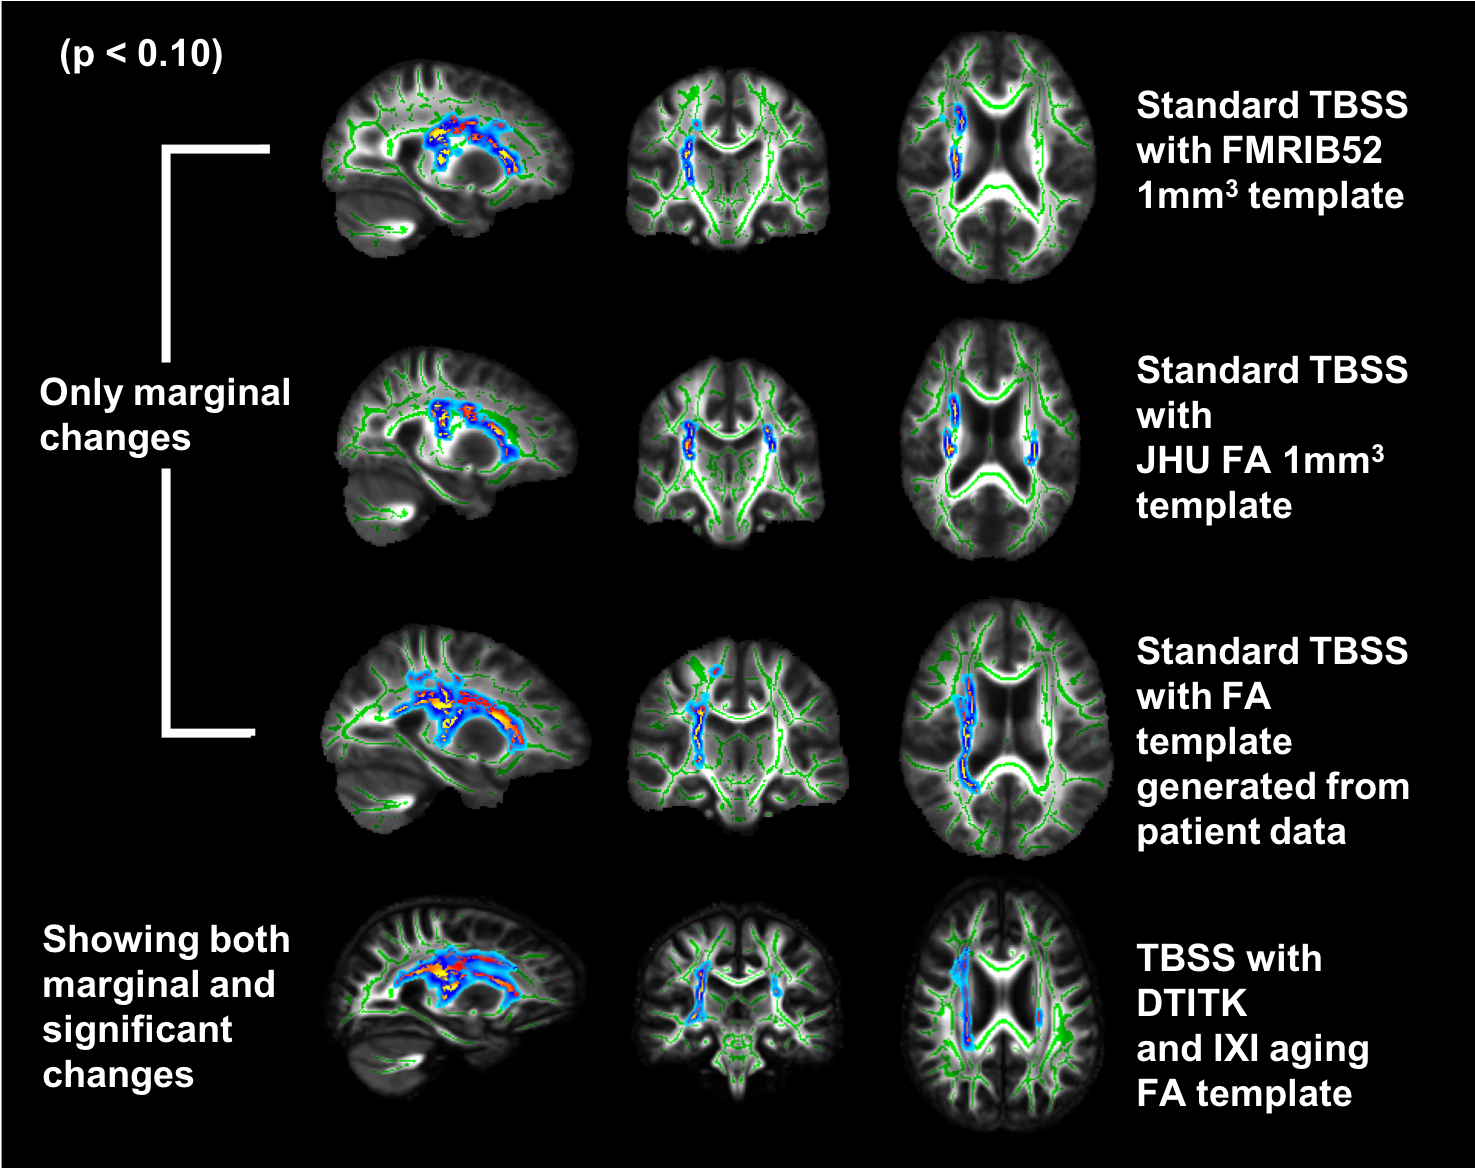
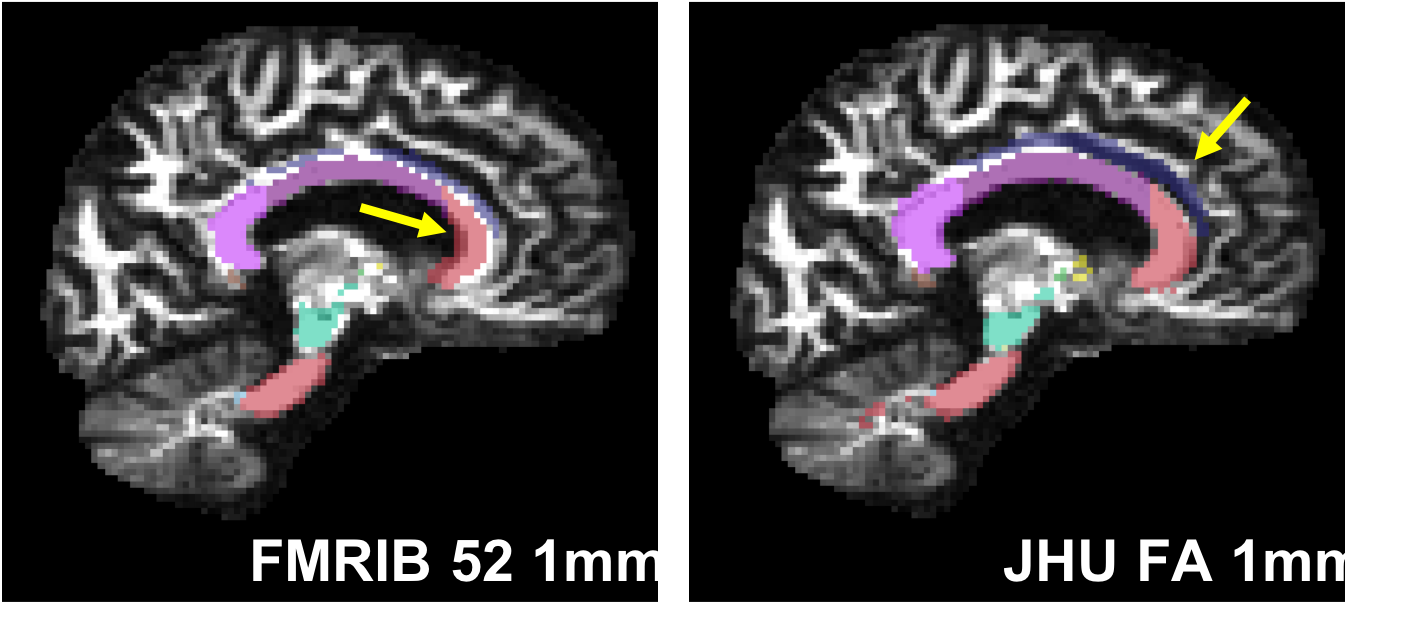
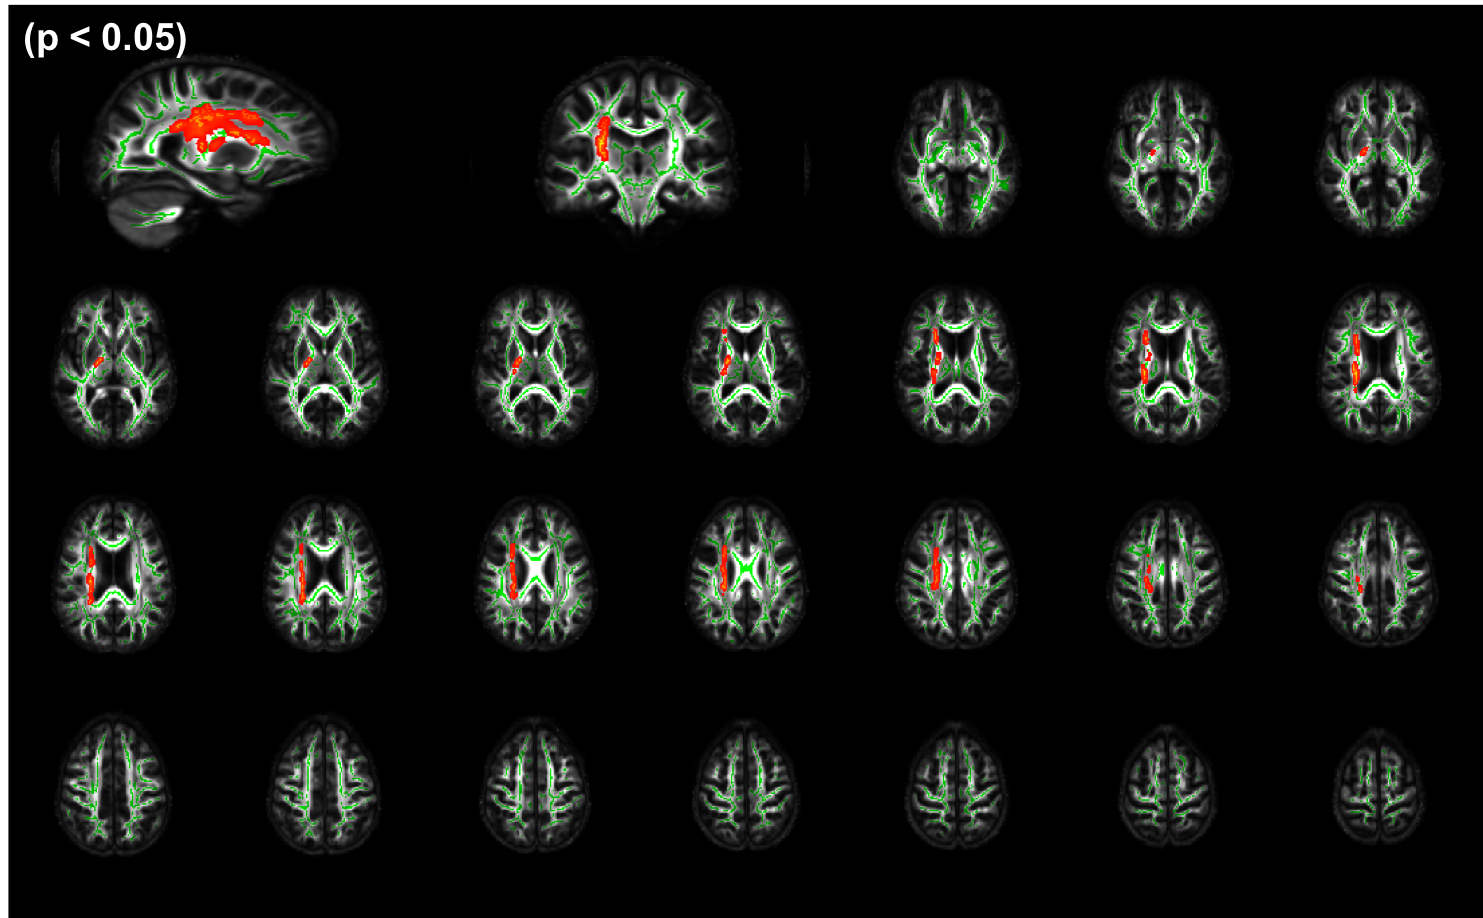
There were no regions with statistically significant differences between the two time points, when the data were analyzed through the default TBSS pipeline. When evaluating regions with marginal significance (Figure 2), a trend of increasing statistically significant changes was noted with use of a custom FA template generated from patient data. Discrepancy between ROI placement from atlas, which was obtained using the inverse of spatial normalization parameters from TBSS (FLIRT/FNIRT), and WM tracts in native subject space (Figure 3) also highlights limitations in spatial normalization of the default pipeline. In contrast, TBSS analysis with enhanced spatial normalization by DTITK, and using the IXI aging template, showed a statistically significant (p<0.05) increase of FA values among WM tracts in the right superior corona radiata and posterior limb of internal capsule in the follow up scan vs. baseline (Figure 4).Discussion
Differences in FA around the corona radiata and posterior limb of internal capsule vs. controls have been reported in a previous cross-sectional study [1]. However, unlike the prominent cross-sectional differences in cerebellum reported previously between controls and patients [1], our results show changes only within the cerebrum, with increased FA. Therefore, changes in the cerebellum likely occur earlier in the disease process. An additional analysis evaluating fiber crossings would be necessary to possibly obtain a more complete picture of changes in WM integrity. Interestingly, a previous longitudinal morphometry study of SCA1 subjects [13] showed volume changes only on the right putamen, which is located near corona radiata and internal capsule.
The analysis with different processing pipelines shows that the default spatial normalization in TBSS may not be adequate for handling atrophied brains of SCA1 patients, as demonstrated by the failure to detect any significant results, while the combination of DTITK and IXI aging template enabled the detection of significant longitudinal changes. In addition, the discrepancies between ROI placement and WM tracts further highlight the potential errors arising from registration of SCA1 patients’ data using the standard TBSS pipeline (Figure 3). However, as the standard pipeline with custom registration templates yielded improvements in statistical significance (Figure 2), it is worth investigating whether further improvements could be achieved by creating a customized template for SCA1 patients.
Conclusion
In this study, we detected longitudinal changes in WM integrity through optimized TBSS analysis of DTI data from a small cohort of patients with SCA1. The preliminary results reveal novel microstructural changes in cerebral WM over 1.5-3 years. This is particularly significant in the context of clinical trials, where sensitive imaging biomarkers are critically needed to help assess the efficacy of candidate treatments.Acknowledgements
Bob Allison Ataxia Research Center, Jay D. Schlueter Ataxia Research Fund, P41 EB015894, P30 NS076408, 1S10OD017974-01References
1. Martins Junior, C.R., et al., Structural signature in SCA1: clinical correlates, determinants and natural history. J Neurol, 2018.
2. Prakash, N., et al., Patterns of fractional anisotropy changes in white matter of cerebellar peduncles distinguish spinocerebellar ataxia-1 from multiple system atrophy and other ataxia syndromes. Neuroimage, 2009. 47 Suppl 2: p. T72-81.
3. Lenglet, C. White matter alterations in spinocerebellar and Friedreich’s ataxias. in 5th Ataxia Investigators Meeting. 2014. Las Vegas, NV, USA.
4. Bach, M., et al., Methodological considerations on tract-based spatial statistics (TBSS). Neuroimage, 2014. 100: p. 358-369.
5. Schmitz-Hubsch, T., et al., Scale for the assessment and rating of ataxia: development of a new clinical scale. Neurology, 2006. 66(11): p. 1717-20.
6. Jenkinson, M., et al., Fsl. Neuroimage, 2012. 62(2): p. 782-90.
7. Smith, S.M., et al., Tract-based spatial statistics: voxelwise analysis of multi-subject diffusion data. Neuroimage, 2006. 31(4): p. 1487-505.
8. Smith, S.M., et al., Advances in functional and structural MR image analysis and implementation as FSL. Neuroimage, 2004. 23 Suppl 1: p. S208-19.
9. Hua, K., et al., Tract probability maps in stereotaxic spaces: analyses of white matter anatomy and tract-specific quantification. Neuroimage, 2008. 39(1): p. 336-47.
10. Zhang, H., et al., A Computational White Matter Atlas for Aging with Surface-Based Representation of Fasciculi. Biomedical Image Registration, 2010. 6204: p. 83-+.
11. Keihaninejad, S., et al., An unbiased longitudinal analysis framework for tracking white matter changes using diffusion tensor imaging with application to Alzheimer's disease. Neuroimage, 2013. 72: p. 153-63.
12. Zhang, H., et al., High-dimensional spatial normalization of diffusion tensor images improves the detection of white matter differences: an example study using amyotrophic lateral sclerosis. IEEE transactions on medical imaging, 2007. 26(11): p. 1585-1597.
13. Reetz, K., et al., Genotype-specific patterns of atrophy progression are more sensitive than clinical decline in SCA1, SCA3 and SCA6. Brain, 2013. 136(Pt 3): p. 905-17.
Figures