2788
Factor analysis of atlas-segmented brain MRSI data in HIV infection1Russell H. Morgan Department of Radiology and Radiological Science, Johns Hopkins University School of Medicine, Baltimore, MD, United States, 2Department of Electronic Science, Xiamen University, Xiamen, China, 3Hawaii Center for AIDS, University of Hawaii, Honolulu, HI, United States, 4Department of Biomedical Engineering, Johns Hopkins University, Baltimore, MD, United States, 5F. M. Kirby Center for Functional Brain Imaging, Kennedy Krieger Institute, Baltimore, MD, United States
Synopsis
HIV-infection may cause HIV-associated neurocognitive disorder. Here, factor analysis is applied to atlas-segmented brain MRSI data from a cohort of HIV-positive subjects to evaluate the relationships of MRSI measures with neuropsychological test performance and immunologic markers. Results indicate that distribution of NAA in right-hemisphere brain regions of basal ganglia, thalamus, etc. may be positively correlated with CD4 counts, and distribution of Cho in both hemispheres of similar regions positively correlated with CD8 counts in HIV-infected subjects. Higher neuropsychological z-scores tends to be associated with higher NAA and/or lower Cho distributions in specific brain regions.
INTRODUCTION
Although advances in antiretroviral therapy have reduced the severity of HIV-associated neurocognitive disorder (HAND), symptoms still persist in a significant percentage of HIV-infected individuals. MR Spectroscopic Imaging (MRSI) is a commonly used approach for noninvasive mapping of tissue metabolites, and it may be useful in detecting metabolic and neuronal dysfunction before HAND becomes more severe, even progressing to HIV-associated dementia.
MRSI data may generate a large number of variables, on which the analyses could benefit from dimensionality reduction techniques such as factor analysis. It has been shown that factor analysis of MRSI data can be useful for determining brain regional metabolic variations in HIV infection and revealing correlations of metabolite levels with neuropsychological tests1. A fuller utilization of the acquired spectra in MRSI data can be achieved with introduction of atlas-based brain segmentation, which permits a more detailed evaluation of metabolite distribution across the brain2.
Here, factor analysis is applied to atlas-segmented brain MRSI data from a cohort of HIV-positive subjects for evaluation of the relationship of MRSI measures to neuropsychological assessments and immunologic markers for HIV infection.
METHODS
We evaluated 26 HIV+ individuals on stable antiretroviral therapy > 1 year and diagnosed with mild-to-moderate neuropsychological (NP) impairment at screening [23 males; age 57± 7 years; 92% with plasma HIV RNA < 20 copies/ml; median current and nadir CD4 count 583 and 100 cells/mm3]. Domain-specific composite NP z-scores (working memory; language; motor, etc.) were computed. The Beck Depression Inventory (BDI)-II was administered.
MR acquisition were done using a 3T scanner. The MRSI data were collected in 3 axial slices covering from the level of the third ventricle to the vertex (field of view = 230 × 172.5 mm2; slice matrix = 32 × 24; SENSE factor = 2.25 (1.5 (LR) × 1.5 (AP)); slice thickness = 15 mm; slice gap = 2.5 mm; echo time = 140 ms; repetition time = 3.2 s; acquisition time = 15m 44s).
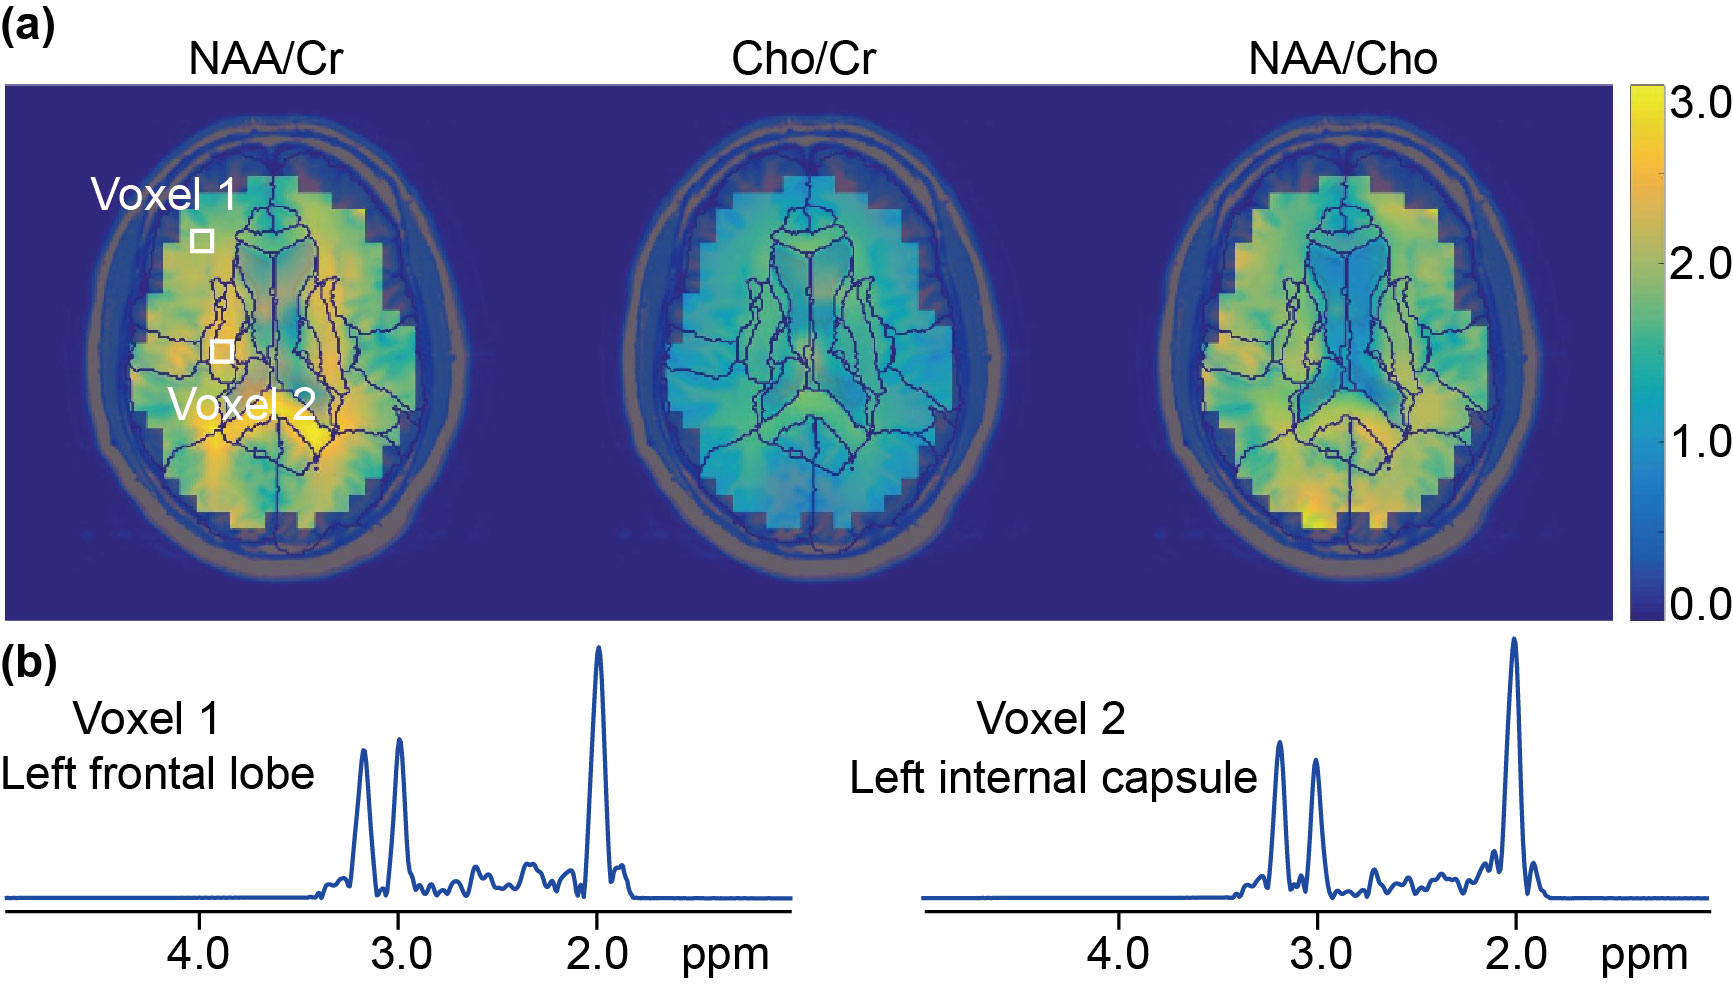
Residual water and lipid signals were removed by L2 regularization from the frequency domain3. Peak areas of N-acetylaspartate (NAA), creatine (Cr) and choline (Cho) were measured with Gaussian-line fitting to the individual spectra. Metabolite-ratio maps (Figure 1) of NAA/Cr, Cho/Cr and NAA/Cho were obtained for each subject. Image registration was carried out firstly from the template4 (including 31 defined brain regions) to the 3D T1-weighted image, and then to the 3-slice localizer image of each subject, using a series of linear transformations and LDDMM5. Metabolite maps were interpolated to match the corresponding atlases for each subject, and maps of the middle-slice which commonly cover 19 of the 31 brain regions was selected for further analysis.
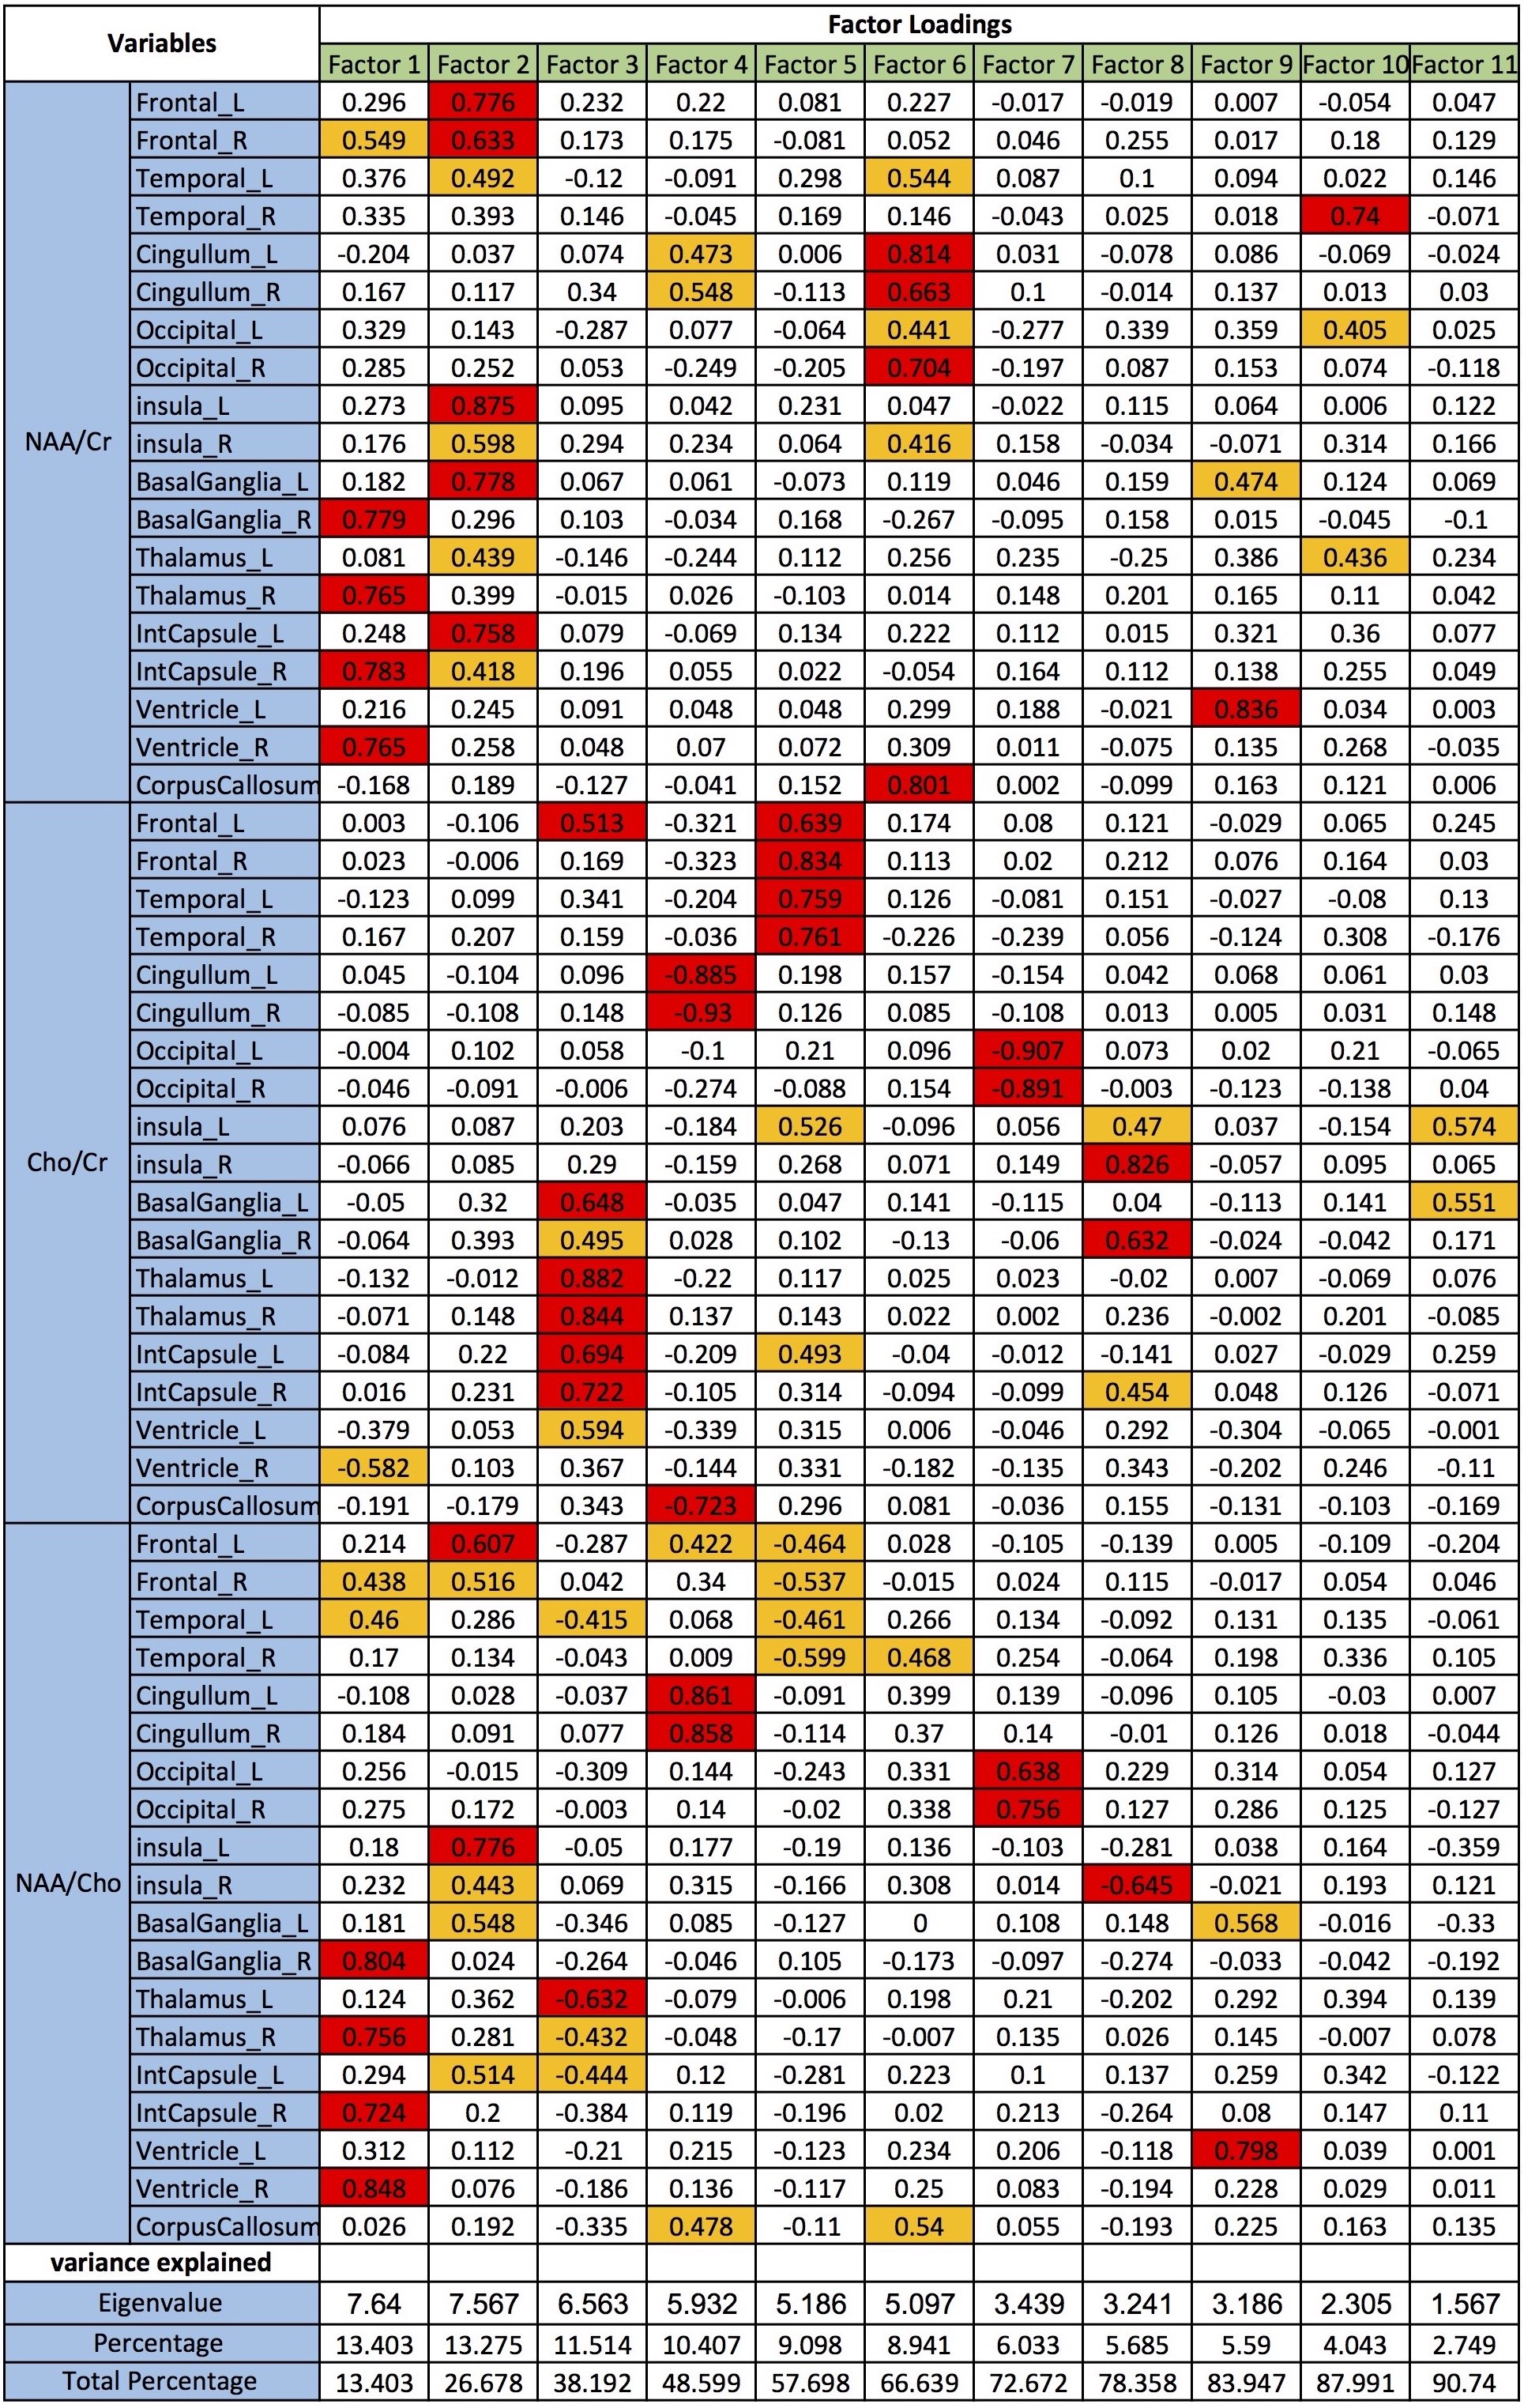
Factor analysis was performed by first calculation of the principal components of 57 variables (3 metabolite ratios from each of the 19 brain regions) generated from the MRSI data, creating 57 eigenvectors. 11 eigenvectors with eigenvalues greater than 1 were kept, explaining 90.7% of variance in the original dataset (remaining variation considered as noise). Factor loadings (Figure 2, strong: ≥0.6; moderate: 0.4-0.6; and weak: <0.4) explain the association of each variable with each factor. Spearman and Pearson correlation methods were used to relate the MRSI factors with immunologic markers and neurocognitive test scores.
RESULTS AND DISCUSSION
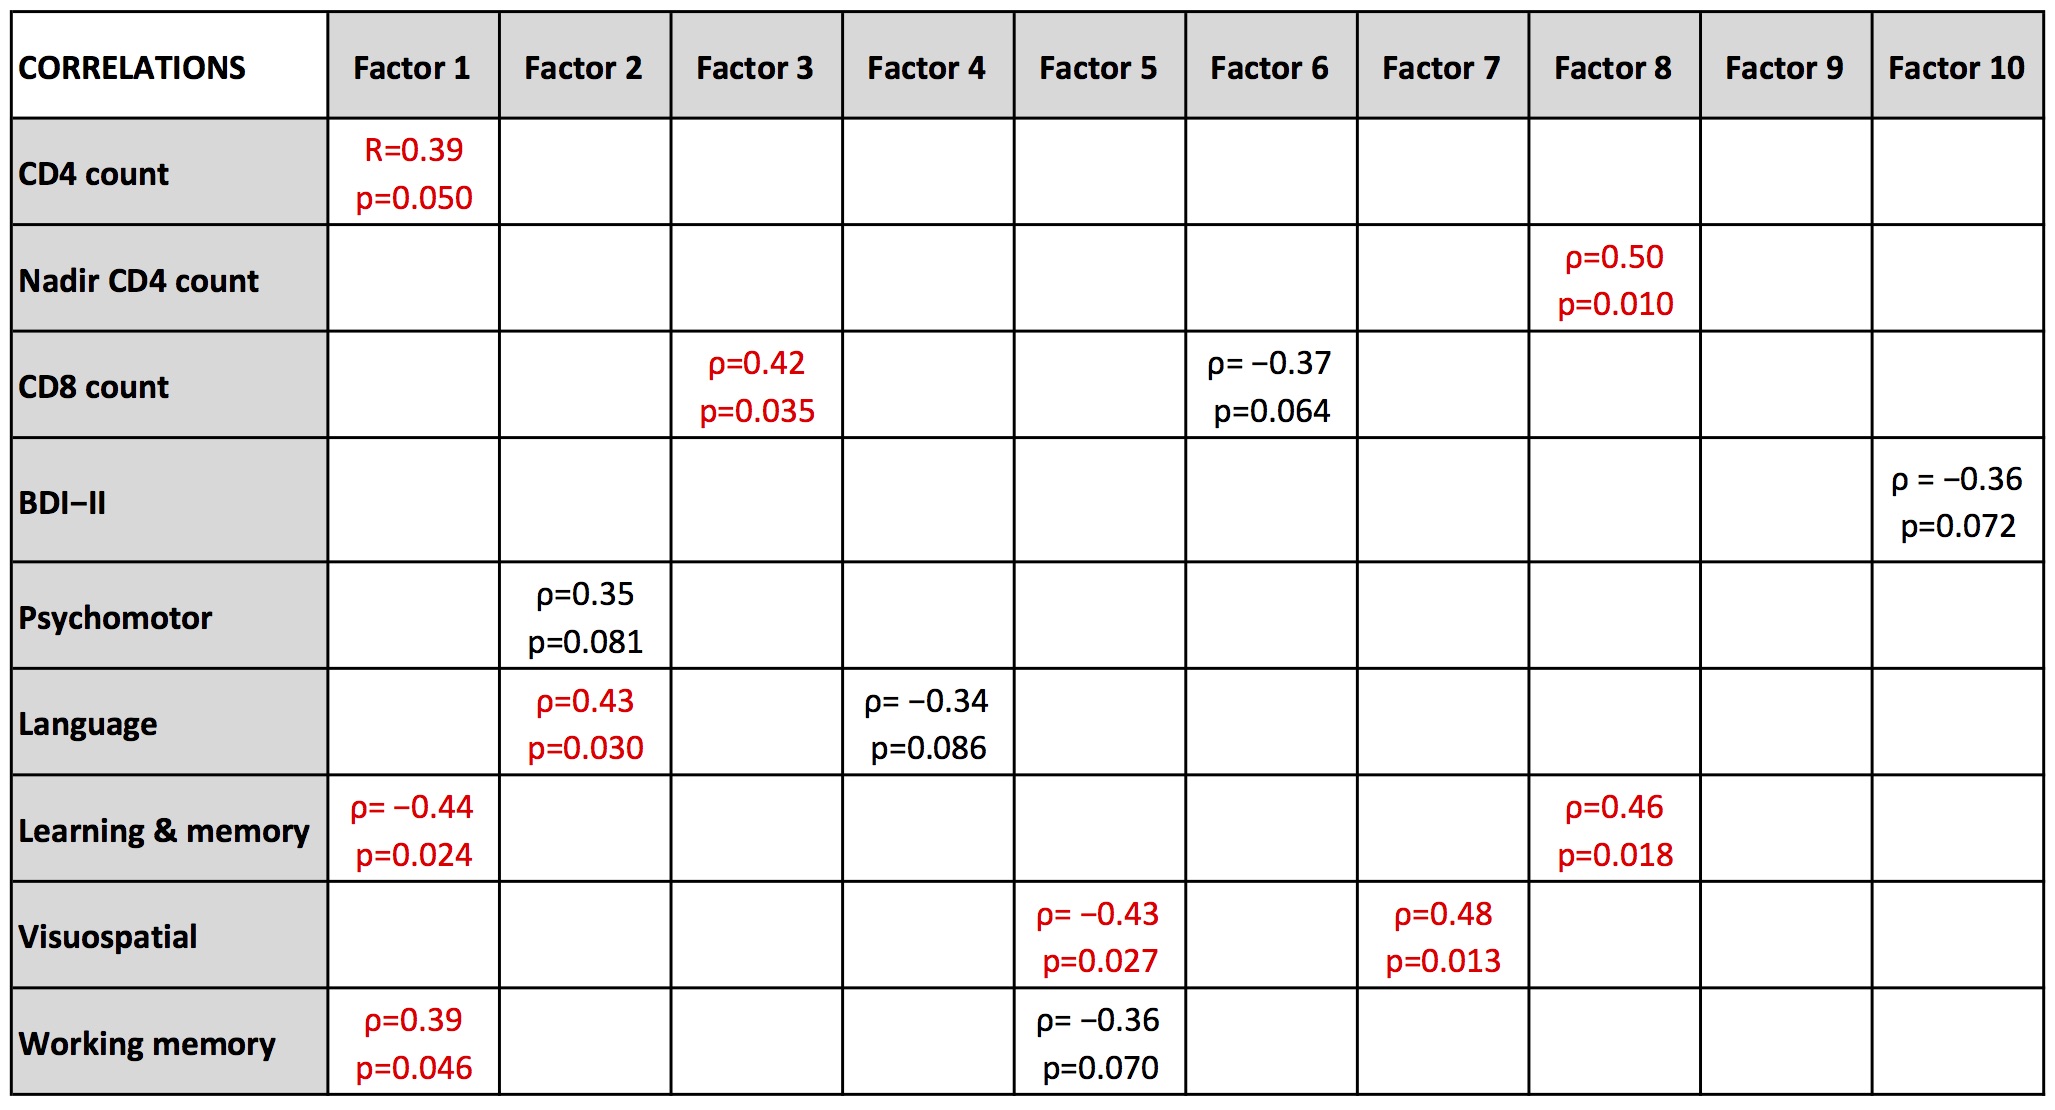
Significant positive correlations (Figure 3) are observed between CD4 count and Factor 1 (R=0.39, p=0.050), CD8 and Factor 3 (ρ = 0.42, p = 0.035), language z-score and Factor 2 (ρ = 0.43, p = 0.030), learning & memory z-score and Factor 8 (ρ = 0.46, p = 0.018), visuospatial z-score and Factor 7 (ρ = 0.48, p = 0.013), and working memory z-score and Factor 1 (ρ = 0.39, p = 0.046); significant negative correlations are observed between learning & memory z-score and Factor 1 (ρ = -0.44, p = 0.024), and visuospatial z-score and Factor 5 (ρ = -0.43, p = 0.027).
CD4 count tends to decrease, while CD8 count tends to increase after HIV infection. The positive correlations of CD4 and CD8 with Factor 1 and Factor 3 respectively indicate that distribution of NAA in right-hemisphere brain regions of basal ganglia, thalamus, internal capsule and ventricle may be positively correlated with CD4 counts, and distribution of Cho in both hemispheres of similar regions (except ventricle and plus left frontal) may be positively correlated with CD8 counts in HIV-infected subjects. The correlations between NP z-scores and MRSI factors indicate that the higher NP z-scores tends to be associated with higher NAA and/or lower Cho distributions in specific brain regions (except results for learning and memory z-score).
Factor analysis of MRSI data with automated atlas-based segmentation is a promising method for evaluating cerebral metabolism in subjects with HIV.
Acknowledgements
No acknowledgement found.References
1. Mohamed M, Lentz M, Lee V, et al. Factor analysis of proton MR spectroscopic imaging data in HIV infection: metabolite-derived factors help identify infection and dementia. Radiology. 2010;254:577-586.
2. Maudsley A, Domenig C, Govind V, et al. Mapping of brain metabolite distributions by volumetric proton MR spectroscopic imaging (MRSI). Magn Reson Med. 2009;61:548-559.
3. Lin L, Považan M, Berrington A, et al. Residual water signal removal in MR spectroscopic imaging with L2 regularization. In Proceedings of the 26th Annual Meeting of ISMRM, Paris, France, 2018. p. 3845.
4. Mori S, Oishi K, Jiang H, et al. Stereotaxic white matter atlas based on diffusion tensor imaging in an ICBM template. Neuroimage. 2008;40(2):570-582.
5. Beg M, Miller M, Trouve A, et al. Computing large deformation metric mappings via geodesic flows of diffeomorphisms. Int J Comput Vis. 2005;61(2):139-157.
Figures